1062
Changes of Groundwater Level due to the 1999 Chi-Chi Earthquake
in the Choshui River Alluvial Fan in Taiwan
by Yeeping Chia, Yuan-Shian Wang, Jessie J. Chiu, and Chen-Wuing Liu
Abstract
Changes of groundwater levels induced by the M
L7.3 Chi-Chi
earth-quake on 21 September 1999 were recorded at 157 out of 179 monitoring wells in
the Choshui River alluvial fan. Of those, 67 observed large groundwater-level
changes, ranging from 1.0 to 11.1 m. These 157 wells are clustered at 64 stations
located approximately 2 to 50 km west of the north–south–trending Chelungpu fault.
Both oscillatory and steplike changes of water level were observed on the analog
records at the time of earthquake, while only steplike changes were observed on the
hourly digital records. Coseismic changes of groundwater level were recorded not
only in the confined aquifers but also in the partially confined aquifers and the
un-confined aquifers. The recovery of water-level changes took minutes to months,
depending primarily on hydrogeologic conditions of the confining layers. The sign
and magnitude of coseismic water-level change at a well varied with its distance
from the fault. The distribution of coseismic water-level changes induced by the
Chi-Chi earthquake indicates that water-level rise predominated in most of the footwall
area, whereas water-level fall prevailed in a narrow zone adjacent to the fault trace.
Introduction
On 21 September 1999, an earthquake of ML 7.3
oc-curred near the town of Chi-Chi in central Taiwan at 1:47 a.m. local time. The epicenter of the earthquake was at 23.85⬚ N, 120.82⬚ E, and the hypocentral depth was about 8 km. The earthquake caused a widespread ground rupture, extending approximately 100 km in the north–south direc-tion, which appeared along the preexisting scarp of Che-lungpu fault. Field investigations and a Global Positioning System (GPS) survey indicated that the hanging wall on the east side of Chelungpu fault thrust northwestward. The dis-placement caused by the Chi-Chi earthquake increases northward, up to 4.2 m in the vertical direction and 7.1 m in the horizontal direction (Central Geological Survey of Taiwan, 1999).
During the occurrence of Chi-Chi earthquake, ground-water levels were monitored by a network of 179 wells in the Choshui River alluvial fan lying to the southwest of Che-lungpu fault (Fig. 1). Hourly digital records indicate steplike changes of ground water level at 157 wells in response to the earthquake. Of those, 67 recorded large water-level changes, ranging in magnitude from 1.0 to 11.1 m.
Earthquake-related changes of groundwater level have been studied for years (Wakita, 1975; Liu et al., 1989; Quilty and Roeloffs, 1997; King et al., 1999). Monitoring wells have been installed along fault zones to observe water level changes as an indicator of crustal deformation and to search for possible pre-seismic abnormal changes in the United
States (Roeloffs et al., 1989), Japan (Igarashi and Wakita, 1991; Ohno and Wakita, 1997), India (Chadha et al., 1997), and elsewhere. The number of groundwater level records in the vicinity of Chelungpu fault and the magnitude of water-level changes induced by the Chi-Chi earthquake, however, may be unprecedented. In this article, we describe the net-work of monitoring wells in the vicinity of Chelungpu fault and some typical coseismic and postseismic changes of groundwater level in the confined, partially confined, and unconfined aquifers. By presenting the distribution of co-seismic groundwater level changes in the Choshui River alluvial fan, one may better understand the impact of thrust-ing on groundwater level changes in the unconsolidated deposits.
Network of Monitoring Wells in the Choshui River
Alluvial Fan
The Choshui River alluvial fan lying in the western coastal plain of central Taiwan is abundant in groundwater resources. Extensive development (industrial, commercial, etc.) since the 1970s, however, has caused a drastic decline of groundwater level and serious land subsidence in the coastal area. The Bureau of Water Resources in Taiwan, therefore, initiated a groundwater monitoring well network project in 1992 to provide long-term groundwater-level in-formation for better management of groundwater resources.
Figure
1.
Location of Choshui River alluvial fan and distribution of 157 monitoring wells clustered at 64 stations where coseismic changes of groundwater level were observed at the time of Chi-Chi earth-quake. Open circles indicate stations where the groundwater level fell, solid circles indicate stations where the groundwater level rose, and squares indi-cate stations where both rise and fall of the water level were observed.Figure
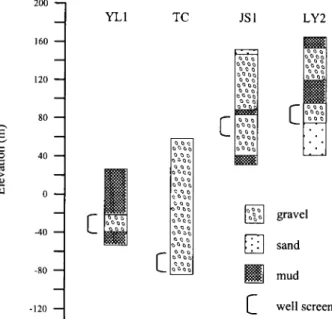
2.
Stratigraphic columns of the YL1, TC, JS1, and LY2 wells.From 1992 to 1997, 188 monitoring wells clustered at 73 stations were installed in the Choshui River alluvial fan (Liu
et al., 1999). Of those, 179 wells at 70 stations were in
opera-tion during the Chi-Chi earthquake.
These wells, located approximately 2 to 50 km west of the Chelungpu fault, were installed in the unconsolidated deposits. Each monitoring well station consisted of one to five wells, ranging in depth from 14 to 300 m. Each well monitors only one aquifer, which is primarily composed of gravel or sand. The wells were installed with 6-in diameter galvanized steel or stainless steel casing. The length of well screen ranges from 6 to 36 m. The gravel pack around the well screen is overlain by 3- to 5-m thick bentonite to pre-vent groundwater from flowing between aquifers of different depths.
Prior to the placement of a well station, an exploratory borehole was drilled for hydrogeologic investigations. Cor-ing, well loggCor-ing, sediment-size analysis, C-14 datCor-ing, water quality analysis, stratigraphic study, and hydraulic testing were conducted to provide comprehensive on-site
hydrogeo-logic information. Stratigraphic columns of four monitoring wells, which will be discussed in this article, are shown in Figure 2.
All monitoring wells are instrumented with either a pressure transducer or a float-type sensor for measuring groundwater level. A digital recorder or a combination of strip-chart analog recorder and analog-to-digital recorder is used to record water level data. Water levels in the moni-toring wells have been recorded at one-hour intervals since 1994. The precision of measuring water level by the digital recorder and analog recorder is approximately 1 and 5 mm, respectively. But the precision of hourly digital records is set to be 1 cm. The resolution of time on analog records is approximately 3 to 5 min.
Groundwater level at monitoring wells in the Choshui River alluvial fan is primarily influenced by pumping and rainfall. Generally, the groundwater level fluctuates with pumping along the coastal region. Away from the coastal region, the ground water level changes more with precipi-tation and less with pumping. The change of water level with pumping or rainfall ranges from a few centimeters to tens of centimeters over a 1-hr period of time.
Coseismic Changes of Groundwater Level
Examination and verification of hourly water level data of 179 wells indicated that changes of water level were ob-served at 157 wells at the time of earthquake. Of those, 67 recorded changes greater than 1 m, which is far greater than the effects of barometric pressure or earth tide. The largest water level change was 11.1 m. Among the other 22 wells, 12 were rejected due to poor recording quality, 9 were dis-carded due to damages of instrument at the time of
earth-Figure
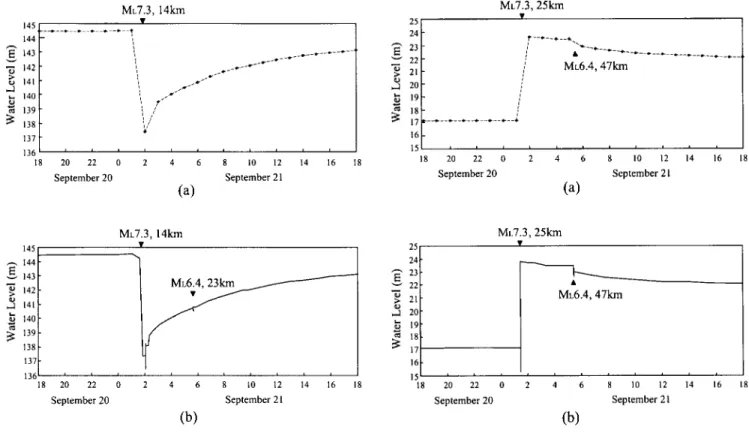
3.
Variations of water level from 6 p.m. on 20 September to 6 p.m. on 21 September at the JS1 well. (a) Hourly digital records showing a water-level fall of 7.12 m between 1 a.m. and 2 a.m. on 21 Sep-tember. (b) Analog records showing a water-level fall of 6.9 m between 1:47 a.m. and 1:52 a.m. on 21 Sep-tember.Figure
4.
Variation of water level from 6 p.m. on 20 September to 6 p.m. on 21 September at the YL1 well. (a) Hourly digital records showing a water-level rise of 6.55 m between 1 a.m. and 2 a.m. on 21 Sep-tember. (b) Analog records showing a water-level fall of 6.5 m between 1:47 a.m. and 1:52 a.m. on 21 Sep-tember.quake, and 1 did not show any coseismic change of water level. Due to the 1-hr sampling interval, only steplike changes of water level induced by the earthquake were ob-served on the digital records. Nevertheless, the continuous strip-chart analog instrument recorded both steplike and os-cillatory changes of water level during the earthquake.
Figure 3 shows a typical pattern of water level fall in a partially confined aquifer induced by the Chi-Chi earth-quake. The JS1 well, located approximately 2 km west of the Chelungpu fault, was screened at the depth from 66 to 96 m. As depicted in Figure 3a, hourly digital records clearly display an abrupt water level fall of 7.12 m between 1 a.m. and 2 a.m. on 21 September 1999. Apparently it is difficult to pinpoint the precise time and other details of water level change from the hourly digital records. However, the analog records of JS1, as shown in Figure 3b, indicated an abrupt water level fall of 6.9 m occurred between 1:47 a.m. and 1:52 a.m. that was close to the time of Chi-Chi earthquake. Water level changes were also observed at the time of a few aftershocks.
The rise of water level in a confined aquifer induced by the Chi-Chi earthquake can be typically shown by the re-cords of YL1 in Figure 4. The YL1 well, located
approxi-mately 13 km west of the Chelungpu fault, was installed to monitor the water level at the depth from 51 to 69 m. The hourly records in Figure 4a shows a steplike water level rise of 6.55 m between 1 a.m. and 2 a.m. on 21 September. On the analog records, as shown in Figure 4b, water level rose approximately 6.5 m between 1:47 a.m. and 1:52 a.m. on 21 September. The analog records at YL1 also show oscillatory phenomenon of water level at the time of steplike water-level rise. Because the oscillation was essentially the dy-namic response of water level to seismic waves of the Chi-Chi earthquake, it is believed that the correct time for the rise of groundwater level at YL1 was close to 1:47 a.m. on 21 September, when the Chi-Chi earthquake occurred.
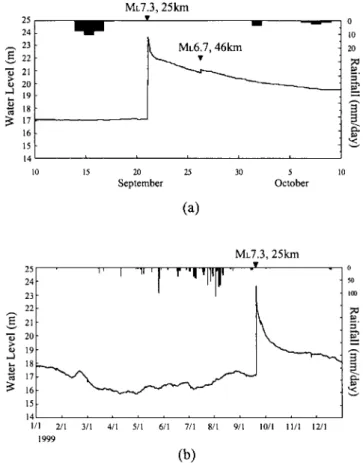
Coseismic changes of groundwater level were observed not only in the confined aquifer and the partially confined aquifer, but also in the unconfined aquifer, as shown in Fig-ure 5. The 50-m deepTCwell, located approximately 13 km west of the Chelungpu fault, was installed to monitor the water level in a thick unconfined gravel aquifer. Due to the low sampling rate, as shown in Figure 5a, the hourly digital records only observed a water-level rise of 0.2 m atTC be-tween 1 a.m. and 2 a.m. on 21 September in response to the Chi-Chi earthquake. However, as shown in Figure 5b, the
Figure
5.
Variation of water level from 6 p.m. on 20 September to 6 p.m. on 21 September at theTCwell. (a) Hourly digital records showing a water-level rise of 0.2 m between 1 a.m. and 2 a.m. on 21 Sep-tember. (b) Analog records show a water-level rise of 1.4 m between 1:47 a.m. and 1:52 a.m. on 21 Sep-tember.
Figure
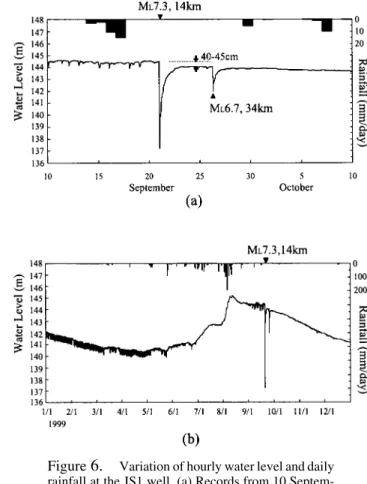
6.
Variation of hourly water level and daily rainfall at the JS1 well. (a) Records from 10 Septem-ber to 10 OctoSeptem-ber 1999. (b) Records from 1 January to 31 December 1999. The JS1 well, screened at the depth from 66 to 96 m, was installed to monitor the water level of a partially confined gravel aquifer. The water level rose during the rain season from May to September and declined during the dry season from October to April. Local pumping was active from Jan-uary to June and in September.analog records indicated that between 1:47 a.m. and 1:52 a.m. the water level rose approximately 1.4 m, far greater than the rise on hourly digital records. Strong oscillations of water level with large amplitudes, up to 6.2 m, were ob-served at the time of the mainshock as well as aftershocks of the Chi-Chi earthquake. The water level recovered to its original level within 20 min after each shock. The rapid re-covery of water level after earthquake indicates the impor-tance of sampling rate of digital recorder, particularly in the unconfined aquifer.
Similar oscillatory phenomena of water level were also observed at the time of steplike water-level changes on the analog records of many other monitoring wells. Therefore, it is concluded that the abrupt changes of water level at all of the monitoring wells in the Choshui River alluvial fan are likely to be coseismic.
Postseismic Changes of Groundwater Level
After the Chi-Chi earthquake, the elevated or declined groundwater level began to recover as a result of recharge
from or discharge to the surrounding formations. In the Cho-shui River alluvial fan, the recovery of coseismic water-level changes usually took less than one hour in an unconfined aquifer (Fig. 5), a few days in a partially confined aquifer (Fig. 6), and a few weeks to months in a confined aquifer (Fig. 7).
The recovery of water-level change induced by the Chi-Chi earthquake in a partially confined gravel aquifer can be demonstrated by the long-term monitoring records of the JS1 well located approximately 2 km south of the Choshui River. As shown in Figure 6a, the water level that fell 7.12 m co-seismically recovered 6.7 m in two days after the earthquake, possibly caused by a rapid recharge from the Choshui River. Instead of recovering further afterward, the water level fluc-tuated at approximately 40 to 45 cm below its preseismic level. At 8 a.m. on 26 September the water level fell again in response to the ML6.7 aftershock, then quickly recovered
to a level approximately 12 to 15 cm below the preaftershock level. It is suspected that the difference between preseismic and postseismic water levels at JS1 is related to the uplift of
Figure
7.
Variations of hourly water level and daily rainfall at the YL1 well. (a) Records from 10 September to 10 October 1999. (b) Records from 1 January to 31 December 1999. The YL1 well, screened at the depth from 51 to 69 m, was installed to monitor the water level of a confined gravel aqui-fer. Prior to the coseismic rise of 6.55 m, the water level varied primarily with precipitation and local pumping.Figure
8.
Variations of hourly water level and daily rainfall at the LY2 well. Records from 10 Sep-tember to 10 October 1999 showing that the water level continued to decline after the Chi-Chi earth-quake.ground surface as a result of faulting. Further investigations and geodetic survey are needed to interpret this phenome-non. From early October, the water level began to decline gradually due to the reduction of groundwater recharge dur-ing the dry season, as shown in Figure 6b.
The YL1 well was installed in a highly permeable con-fined gravel aquifer, but the recovery rate of coseismic change was rather slow. Figure 7a shows that water level declined 2 m rapidly in the first day after the coseismic rise of 6.55 m, then fell slowly and monotonously. It is noted that another coseismic rise of 29 cm occurred at 8 a.m. on 26 September as a result of the ML6.7 aftershock. As shown
in Figure 7b, by the end of October 1999 the elevated water level declined approximately 4.4 m, but did not fully return to its preseismic level. Obviously the rate of water-level re-covery in the confined aquifer is controlled more by the dif-fusivity of confining beds and less by the difdif-fusivity of the monitored gravel aquifer itself.
At some wells, the coseismically declined or elevated groundwater levels continued to fall or rise after the Chi-Chi earthquake. This phenomenon can be demonstrated by the variation of water level at the LY2 well located 4.8 km west of the Chelungpu fault (Fig. 8). LY2 was an artesian well before the Chi-Chi earthquake. The water level fell 5.94 m at the time of earthquake, but did not show any recovery after the earthquake. Instead, it continued to decline and be-came a nonartesian well. This phenomenon is possibly re-lated to outflow of groundwater through fractures induced by the earthquake as proposed by King et al. (1999). In addition, the water level at LY2 was relatively more respon-sive to aftershocks. The water level declined 40, 39, and 20 cm in response to ML4.8, 6.7, and 4.7 aftershocks,
respec-tively. It is suspected that the LY2 well is located at a place sensitive to fault movement.
Distribution of Coseismic Water-Level Changes
Pore fluid pressure could be very sensitive to crustal strains induced by the change of tectonic stress. Bredehoeft (1967) indicated that the water level in a well tapping a con-fined aquifer has the potential for monitoring small strains. Based on the close correlation between the coseismic groundwater level change and the volumetric strain caused by the faulting during the 1974 M 6.9 Izu-Hanto-Oki earth-quake, Wakita (1975) suggested that the water level of wells could be used to monitor the changes of tectonic strain. A network of observation wells has been established in the Parkfield area to monitor the crustal deformation since 1985 (Roeloffs et al., 1989). The distribution of coseismic ground-water level changes generally agreed with the sign of cal-culated volumetric strains (Roeloffs et al., 1995; Quilty et
al., 1995), but was not consistent with the magnitude of
calculated volumetric strains (Grecksch et al., 1999). The amplitude of coseismic water level rises in a single well can be related to the magnitude of earthquake and the well-epicenter distance (Roeloffs, 1998).
Figure
9.
Variations of coseismic changes of groundwater level with distance from the Chelungpu fault along lines AA⬘, BB⬘, CC⬘, and DD⬘ as shown in Figure 1.Among the 157 monitoring wells where coseismic changes of water level were observed in the Choshui River alluvial fan, 141 recorded coseismic rises while 16 recorded coseismic falls. These 157 monitoring wells are clustered at 64 stations in the footwall of Chelungpu fault. Locations of these well stations in the Choshui River alluvial fan are shown in Figure 1. Among the 64 stations, there are 53 sta-tions where coseismic rises of water level were observed and 8 stations where coseismic falls were observed. At the re-maining three stations, a coseismic rise was observed at one well, but a coseismic fall at another well of different depth. The sign and magnitude of the coseismic changes tend to vary with distance from the Chelungpu fault. Figure 9 illustrates the relationship between the largest coseismic change of groundwater level at a well station and the dis-tance from the well station to the fault zone along four east– west trending lines (Fig. 1). All of the four stations along line AA⬘, located approximately 16 to 33 km west of the Chelungpu fault, recorded coseismic rise of water level. Along line BB⬘, a coseismic change of ⳮ9 m (decline) was observed at SK located 3 km west of the fault. The coseismic change became positive atTClocated 13 km from the fault and reached the maximum at SC located 20 km from the fault. Beyond SC, the change reduced gradually, but re-mained positive. The variation of coseismic water level changes along lines CC⬘ and DD⬘ is similar to that along BB⬘. The general trend of coseismic changes inferred from Figure 9 indicated that groundwater level fell coseismically in the area adjacent to the fault and rose coseismically be-yond 10 to 12 km from the fault. The coseismic rise ap-proached the maximum in the area approximately between 20 and 30 km from the fault, and reduced gradually beyond that range.
Previous studies indicated that the area where ground-water level rose or fell coseismically is generally consistent with the area of volumetric compression or volumetric ex-pansion. The distribution of groundwater level changes, as depicted in Figures 1 and 9, shows that coseismic rises of groundwater level or volumetric compression resulting from thrust faulting predominated in most of the footwall area. Coseismic water-level falls were observed near the east bor-der of Choshui River alluvial fan. Obviously the water level fall or volumetric expansion occurred in the footwall as well, but only in a narrow zone adjacent to the Chelungpu fault trace. Further research is needed to understand the mecha-nisms involved in the distribution pattern of water-level changes as well as the relation between volumetric strains and water-level changes.
Conclusions
Results of this study indicated that steplike changes of water level induced by the Chi-Chi earthquake were gener-ally observed on the hourly digital records, but the analog records observed both oscillatory and steplike changes of water level coseismically. Coseismic rise or fall of water
level was observed not only in the confined aquifer, but also in the partially confined aquifer and the unconfined aquifer. The recovery of groundwater level was primarily controlled by hydrogeologic conditions, particularly the vertical con-finement of aquifers. It is anticipated that the recovery pro-cess of coseismic water level changes has the potential to be used for investigating regional hydrogeologic character-istics.
The coseismic changes of groundwater level at a well can be related to its distance from the fault. The distribution of coseismic water level changes in the Choshui River al-luvial fan indicated that the rise of water level predominated in most of the footwall of Chelungpu fault, while the fall of water level prevailed in a narrow zone adjacent to the fault trace. The belted distribution of water level fall adjacent to the thrust fault, however, remains to be confirmed by further studies.
Acknowledgments
We gratefully acknowledge the support from the Water Conservancy Agency and the Water Resources Bureau for providing water-level data, field information, and other assistance. Appreciation is due to Dr. Chi-Yu King, Professor Leon Teng, and Professor Francis T. Wu for their com-ments and suggestions. The research was funded by the National Science Council of the Republic of China under Grant NSC 89-2116-M-002-050.
References
Bredehoeft, J. D. (1967). Response of well-aquifer systems to earth tides,
J. Geophys. Res. 72, 3075–3087.
Central Geological Survey of Taiwan (1999). Geologic survey of 921 earth-quake, Report No. 008414880101 (in Chinese).
Chadha, R. K., H. K. Gupta, H. J. Kumpel, P. Mandal, A. N. Rao, N. Kumar, I. Radhakrishna, B. K. Rastogi, I. P. Raju, C. S. P. Sarma, C. Satyamurthy, and H. V. S. Satyanarayana (1997). Delineation of active faults, nucleation process and pore pressure measurements at Koyna (India), Pure Appl. Geophys. 150, 551–562.
Grecksch G., F. Roth, and H. J. Ku¨mpel (1999). Coseismic well-level changes due to the 1992 Roermond earthquake compared to static deformation of half-space solutions, Geophys. J. Int. 138, 470–478. Igarashi, G., and H. Wakita (1991). Tidal responses and earthquake-related
changes in the water level of deep wells, J. Geophys. Res. 96, 4269– 4278.
King, C.-Y., S. Azuma, G. Igarashi, M. Ohno, H. Saito, and H. Wakita (1999). Earthquake related water-level changes at 16 closely clustered wells in Tono, Central Japan, J. Geophys. Res. 104, 13,073–13,082. Liu, L. B., E. A. Roeloffs, and X. Y. Zheng (1989). Seismically induced
water level fluctuations in the Wali Well, Beijing, China, J. Geophys.
Res. 94, 9453–9462.
Liu, C. W., Y. Chia, C. G. Liu, L. C. Chang, C. S. Guon, C. S. Ting, W. F. Chen (1999). Compilation “Groundwater in Taiwan–Choshui River Alluvial Fan” Taiwan Bureau Water Resources Rept. 88EC2B370072 (in Chinese).
Ohno, M., and H. Wakita (1997). A water well sensitive to seismic waves,
Geophy. Res. Lett. 24, 691–694.
Quilty, E. G., and E. A. Roeloffs (1997). Water-level changes in response
to the 20 December 1994 earthquake near Parkfield, California, Bull.
Seism. Soc. Am. 87, 310–317.
Quilty, E. G., W. Danskin, C. D. Farrar, D. L. Galloway, S. N. Hamlin, E. A. Roeloffs, M. L. Sorey, and D. E. Woodcock (1995). Hydrologic effects associated with the January 17, 1994 Northridge, California, earthquake, U.S. Geol. Surv. Open-File Rept. 95-813.
Roeloffs, E. A. (1998). Persistent water level changes in a well near Park-field, California, due to local and distant earthquake, J. Geophys. Res.
103, 869–889.
Roeloffs, E. A., S. S. Burford, F. S. Riley, and A. W. Records (1989). Hy-drologic effects on water level changes associated with episodic fault creep near Parkfield, California, J. Geophys. Res. 94, 12,387–12,402. Roeloffs, E. A., W. R. Danskin, C. D. Farrar, D. L. Galloway, S. N. Hamlin, E. G. Quilty, H. M. Quinn, D. H. Schaefer, M. L. Sorey, and D. E. Woodcock (1995). Hydrologic effects associated with the June 28, 1992 Landers, California, earthquake sequence, U.S. Geol. Surv.
Open-File Rept. 95-42.
Wakita, H. (1975). Water wells as possible indicators of tectonic strain,
Science 189, 553–555.
National Taiwan University Department of Geosciences 245 Choushan Road Taipei, Taiwan 106 P. R. China