Abstract— In a high-speed railway system, wireless communications suffer heavy distortion introduced by the movement of the locomotives. For an alternation, this paper proposes an idea that utilizes the power-line communication in the high-speed electrical railway systems. This research builds a high-speed railway simulation system with a mobile-contacted PLC circuit to study the feasibility of this idea. This study uses two computers to simulate the communications between internet servers and mobile devices. By observing the packet lost rate of the connections, this paper concludes some possible factors that affect the high-speed electrical railway system working with PLC in the real world.
Keywords— PLC, OFDM, mobile environment, Doppler Effect. I. INTRODUCTION
Members of HomePlug Powerline Alliance [1] introduced many kinds of Power Line Carrier (PLC) products. PLC network uses power line circuits as the transmission media of network messages. This paper proposes a mobile PLC network that simulates a possible communication scenario in a high-speed railway system. Handheld mobile communication devices have almost become personal necessities in recent days. However, the speed of a moving vehicle hampers the connections between the mobile devices carried in the vehicle and their access points. QoS of wireless communication requires further improvement in a high-speed railway system. Tang and Pan [2] showed that moving in a low speed (2.5 Km/h), mobile-contacted PLC circuit is able to transmit data between two communication devices. This paper extends previous effort [2] by constructing another experimental environment called "High-speed Railway Simulation System" (HRSS). The goal of this paper is to combine HRSS and mobile PLC network to obtain the quality of service between two computers. With the results, this paper analyzes the possibility of using PLC network on a high-speed railway system.
II. HIGH-SPEED RAILWAY SYSTEM
A. Specifications
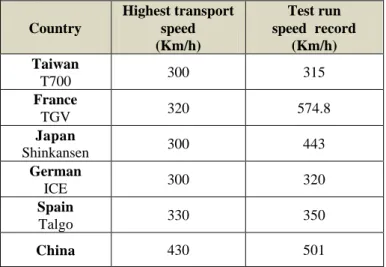
High-speed railway system is a railway system that has a top speed at 200Km/h or even faster, and the track gauge mostly is 1435 mm. Building high-speed railway system is for the need of carrying lots of passengers in short time. Table 1 lists several high-speed railway systems in different countries.
Table 1 High-Speed Railway Systems in Different Countries
Country Highest transport speed (Km/h) Test run speed record (Km/h) Taiwan T700 300 315 France TGV 320 574.8 Japan Shinkansen 300 443 German ICE 300 320 Spain Talgo 330 350 China 430 501 B. Power source
The power source of a locomotive in a high-speed railway system is the overhead supply system (OSS). OSS connects to the power substation with two electrical wires – contact wire and parallel return wire. A locomotive uses the pantographs to receive electricity from the contact wire. Figure 1 shows the structure of OSS and the locomotive.
SIMULATION AND ANALYSIS OF MOBILE
POWER-LINE COMMUNICATION ON
HIGH-SPEED ELECTRICAL RAILWAY
SYSTEM
Cheng-Jen Tang, Department of Electrical Engineering, Tatung University
Wei-Pong Zhang, Graduate Institute of Communication Engineering, Tatung University
III. POWER-LINE COMMUNICATION NETWORK
A. Power line medium
When the power line transmits electricity, the working frequency is 50 Hz or 60Hz. To avoid the transmission interference of electricity, PLC network uses a bandwidth between 1 MHz and 30 MHz to transmit signals. Table 2 lists some effects or noises in the power line medium that affect the performance of PLC network.
Table 2 Effects and signals of power line medium
Effects and signals Description
Time-varying loads
Different power appliances could increase or decrease the complexity of power line circuits.
Multipath effect
Causes Inter-symbol interference would and makes a distortion to original signal.
Impulse noise
When starts power appliances up, they could produce unpredictable impulse noise.
Background noise
Signals that produce by other power appliances and do not belong to PLC’s are called background noise.
Reflection signal
The original signal could reflect to the transmitter due to impaired loads or nonlinear characteristic of power line medium.
B. HomePlug 1.0
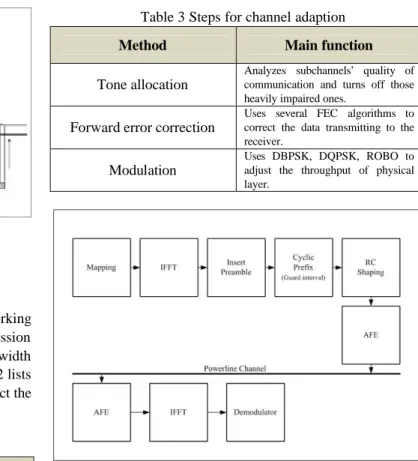
HomePlug 1.0 is the specification that HomePlug Powerline Alliance defined in 2000 [3]. HomePlug 1.0 uses a modified Orthogonal Frequency Division Multiplexing (OFDM) to reduce the affection of inter-symbol interference (ISI). Table 3 lists the steps for channel adaption of OFDM in HomePlug 1.0.
Figure 2 OFDM in HomePlug 1.0
HomePlug 1.0 also defines its own Medium Access Control protocol (MAC), it uses a variation of CSMA/CA to detect whether the medium is idle or not. MAC also provides the segmentation and reassembly mechanism in case of the Ethernet packets not fitting in a signal frame. For safety issues, 56-bit DES is used to encrypt the data during the communication.
C. PLC network and high-speed railway system
The power supply system of high-speed railway system is OSS; this circuit is able to be the medium of mobile PLC network. Figure 3 shows the connections between the power substation and the ISP building with a router or other network devices to offer internet service. Using Ethernet-to-PLC transferring devices, signals are transmitted through the contact wire and to the locomotive or carriage with pantographs. The wireless access points in the carriages offer internet connections to the mobile devices carried by passengers. This scenario eliminates the distortion of the wireless communication introduced due to the high-speed movement.
Figure 3 Connection between mobile PLC network and mobile devices
IV. HIGH-SPEED RAILWAY SIMULATION SYSTEM
A. Design issues
To simulate a real high-speed railway system, this paper identifies some major components required in HRSS. As mentioned above, PLC network uses the power lines as its transmission medium. Table 4 lists the real high-speed railway system’s components in comparison with HRSS’s.
Table 4 Components and their main functions of real system and HRSS
Real system HRSS Main function
Pantograph Graphic brush Receive electricity
Overhead supply
system Copper tracks
Connect to power source to receive/transmit
electricity
Locomotive Motor vane and graphic brush holder
Provides mobile environment
B. Motor set
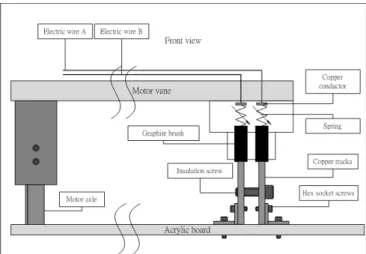
To simulate the ultra high-speed of a high-speed railway system with indoor power source, this paper uses a vane with a direct current (DC) motor that is able to rotate at a controllable rotation per minute (RPM). The DC motor needs to be firmly located on a supporting block to reduce the vibration. A vertical brace is used to stabilize the DC motor on an acrylic broad. Figure 4 shows the design of this motor set.
Figure 4 Design chart of motor set C. Graphite brush set and copper tracks
The graphite brush holder and the balance unit are fixed at the two sides of the motor vane; two graphite brushes are installed in the holder. A spring and a copper conductor are between the graphite brush and the holder. The springs offer the elastic force for the graphite brushes to stick with copper tracks. The copper conductors are used as the conductors between graphite brushes and two electrical wires to the rotating connector. The copper tracks are made from two copper stripes, the radius are 279 mm and 269 mm. Figure 5 shows the side view of the graphite brush set and the copper tracks.
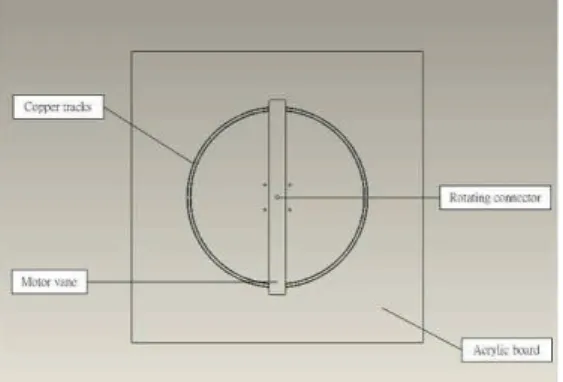
Figure 5 Design chart of graphite brush set and copper tracks D. Rotating connector
When the motor vane is rotating, the fixed electrical wires have to stay firmly. To solve this problem, a rotating connector is used in the middle of the motor vane for providing connections between the wires and the motor axle. The motor
Figure 6 Design chart of the rotating connector E. Design of the model
The original design chart of HRSS is shown in Figure 7. The copper tracks are screwed on the acrylic broad in front of the vertical brace. The graphite brush set and the balance unit are installed under the motor vane. The main difference between the design chart and the real model is the depth of the acrylic broad. The original design is not able to carry the weight of copper tracks. Therefore, a wooden broad is used between the acrylic broad and the vertical brace. The real model of HRSS is shown in Figure 8.
Figure 7 Design chart of HRSS
Figure 8 Real model of HRSS
Voltage(Vac) (Vdc) speed(rpm) speed(km/h)
20 12.2 310 32.61 25 17.9 536 56.38 30 21.8 650 68.37 35 24.2 840 88.32 40 29.8 1020 107.28 45 33.9 1158 121.8 50 36.4 1343 141.26 55 41.1 1469 154.51 60 45.7 1651 173.65 65 49.1 1824 191.85 70 52.9 1990 209.31 B. Experiment topology
For the communication between the client and the server, two computers (PC 1 and PC 2) are used. Table 6 lists the specifications of two computers.
Table 6 Specifications of PC 1 and PC 2
Name PC 1 PC 2
CPU Pentium(R) 4 2.4GHz
RAM 736MBytes 480MBytes
Network Interface Card
Sis 900-based PCI Fast Ethernet Adapter
IP 192.168.0.1 192.168.0.3
Operating System Debian GNU/Linux, kernel 2.6.18-6-686
Software
Iperf 2.0.3 Tcpdump 3.9.8
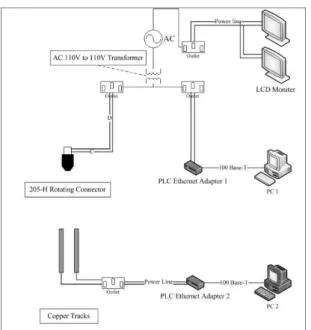
main function of them is setting up PLC network through HRSS to communicate PC 1 and PC 2 as shown in Figure 9.
Figure 9 Topology of real PLC network with HRSS PLC Ethernet 1 and PLC Ethernet 2 communicates with each other through the indoor power source and HRSS. To simulate the real PLC network, two LCD monitors are added in the power circuit as the extra background noise source. HRSS uses the rotating connector, the graphite brush and the copper tracks to transmit electricity to PLC Ethernet adapter 2.
Figure 10 shows that an 110V-to-110V AC transformer is installed between the HRSS and the indoor power source. The purpose of adding an AC transformer is to isolate the extra background noise from LCD monitors.
Figure 10 Topology of Isolated PLC Network with HRSS
C. Experiment method
PC 1 and PC 2’s operating system are both Debian GNU/Linux, kernel 2.6.18-6-686. A freeware named Iperf is used to test the performance of mobile PLC network working on HRSS. One computer is the client and another one is the server. In the experiment, PC 1 and PC 2 play the roles of client and server alternately. Table 7 lists the setting of Iperf .
Table 7 Commands of Iperf
Setting Iperf command
PC 1 as server Iperf –s -u PC 2 as client Iperf –c 192.168.0.1 –b 3M –t 240 PC 2 as server Iperf –s -u PC 1 as client Iperf –c 192.168.0.3 –b 3M –t 240
To observe the quality of service (QoS), this experiment transmits UDP packets and calculates the lost rate. The server is set to receive UDP packets from the client. Figure 11 shows the communication between PC 1 and PC 2 when using Iperf. The model of the PLC Ethernet adapter is JPL-2114BP, its frequency band is between 4.3 MHz and 20.9 MHz. The highest network data rate of JPL-2114BP is 14 Mbps. This experiment uses 3Mbps when setting Iperf. During the experiment, this paper also uses TCPDUMP [4] to record the transmitted packets.
Figure 11 The Communication of PC 1 and PC 2 D. Experiment results
This experiment sets four different situations. Situation A is shown in Figure 9. PC 1 sends UDP packets to PC 2. Situation
Situation C Isolated PLC network
with HRSS PC1 ? PC2 Situation D Isolated PLC network
with HRSS PC2 ? PC1 Table 9 lists all situations’ average UDP packets receive rate. All the data is obtained from Iperf’s results. The result is confirmed by the recorded TCPDUMP pcap files.
Table 9 Average UDP Packet Receive Rate of Situation A-D
Tangent speed (Km/h) Situation A Situation B Situation C Situation D 0 99.9499 % 99.8951 % 99.9962 % 99.9870 % 32.6 99.7848 % 99.7811 % 99.9379 % 99.9082 % 56.38 99.8845 % 99.8890 % 99.9379 % 99.9608 % 68.37 99.6552 % 99.7072 % 99.7396 % 99.7411 % 88.32 99.7115 % 99.7353 % 99.6898 % 99.5295 % 107.28 99.5280 % 99.5938 % 99.3250 % 99.3510 % 121.8 98.8790 % 98.9500 % 99.0150 % 99.1130 % 141.26 98.5900 % 98.4200 % 98.5950 % 98.7200 % 154.51 94.2400 % 95.8900 % 96.7800 % 97.4200 % 173.65 94.1600 % 93.8500 % 95.0900 % 95.7700 % 191.85 93.9900 % 93.7600 % 94.0000 % 93.1200 % 209.31 86.1900 % 90.6500 % 88.0900 % 89.9700 % Figure 12 to 15 shows the results of individual situation, Figure 16 combines situation A to D and Figure 17 shows the average data of all situations.
Figure 13 Average UDP Packet Receive Rate of Situation B
Figure 14 Average UDP Packet Receive Rate of Situation C
Figure 16 Average UDP Packet Receive Rate of Situation A-D
Figure 17 Average UDP Packet Receive Rate of All Situations When the graphite brush set’s tangent speed is higher, more UDP packets are lost.
VI. ANALYSIS OF EXPERIMENT
A. Multipath effect
When modeling HRSS, due to the high rotating speed of the DC motor, the copper tracks has to be well connected and moving smoothly. Signals travel two different routes from the source to the destination. Multipath effect has therefore occurred. Figure 19 shows multipath effect caused by copper tracks.
Figure 19 Copper Track with Multipath Effect The distance of route 1 and route 2 is d1 and d2, they are
changed according to the position of the graphite brush. The propagation delay (Δt) of two routes is obtained by:
R is the radius of copper tracks, T is the period of DC motor, and C is the velocity of light. Figure 20 shows the propagation delay during 5 rounds.
Figure 20 Diagram of Propagation Delay
The maximum propagation delay in this experiment is 5.8434 ns; the guard interval of the PLC Ethernet adapter is 800 ns. The guard interval is much greater than the propagation delay. Therefore, the multipath effect is not obvious in this experiment due to the short distance differences, it still needs further test and analyze for a longer distance.
B. Doppler Effect
During this experiment, PLC signals are transmitted in a mobile environment. Therefore, there is a frequency offset introduced by Doppler Effect. The frequency of Doppler shift (fD) is obtained by:
Vm is the tangent speed of graphite brush set and fc is the
frequency of PLC Ethernet adapter (4.3 MHz to 20.9 MHz). With different Vm, Table 10 lists all the frequencies of Doppler
shift in the experiment.
Table 10 fD with Different Tangent Speed Tangent speed (Km/h) fD , when fC = 4.3 MHz (Hz) fD , when fC = 20.9 MHz (Hz) Network data rate (bits/sec) 0 0 0 2.994M 32.61 0.1298 0.6309 2.983M 56.38 0.2245 1.0912 2.993M 68.37 0.2722 1.3230 2.979M 88.32 0.3516 1.7089 2.976M
means the symbol error rate (SER) raises as the speed increasing. Using the experiment results to calculate the SER with fD:
By inputting the equation into Matlab, a diagram of SER that fc’s upper bound is 20.9 MHz and its lower bound is 4.3MHz as
shown in Figure 21.
Figure 21 Diagram of SER and tangent speed C. Structure defect
This experiment uses a video camera to record the processes of experiments. According to recorded files, a phenomenon is discovered: when motor vane is rotating, both ends are floating. The floating of motor vane’s horizontal makes the graphite brushes dis-attach form the copper tracks. The quality of the communication between two PLC Ethernet adapters is therefore lowered, when the motor vane rotates faster. Two reasons explain this phenomenon. One, the material of the motor vane is aluminum; it is not able to endure the torque force during rotating. Two, Bernoulli Effect is caused by the shape of the motor vane with the graphite brush set and balance unit held under both ends of it. Although the theoretical maximum tangent speed is able to achieve 300 Km/h, the communication between two PLC Ethernet adapters breaks off when the tangent speed is faster than 209.31 Km/h due to the
VIII. FUTURE WORKS
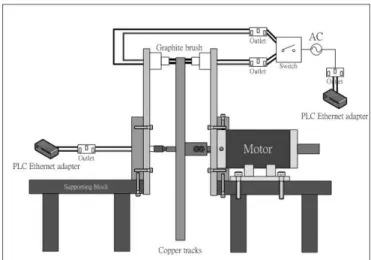
In the real world, a locomotive travels through different power substations with some neutral zones among them. Figure 22 shows a modified HRSS that offers a switch of two different power sources to simulate the situation of a locomotive traveling in a neutral zone.
Figure 22 Modified design of HRSS
The PLC technology used by this paper is HomePlug 1.0, the newest one is HomePlug AV. More modulation methods (16-QAM, 32-QAM… etc) are provided for the channel adaption. The SER equation is estimated and only fits the situation of the experiment results in this paper.
REFERENCES
[1] HomePlug Powerline Alliance, http://www.HomePlug.org
[2] Cheng-jen Tang, Jian-Ming Pan, "An Experimental Model of the Mobile Power-Line Communication Systems," 2006 International Workshop on Computer Networks and Wireless Communications, proceedings of the International Computer Symposium 2006, vol. II, pp. 687-696, December, 2006.
[3] HomePlug Powerline Alliance , "HomePlug 1.0 Technology White Paper,"
http://www.homeplug.org/products/whitepapers/
[4] TCPDUMP/LIBPCAP public repository, http://www.tcpdump.org/
[5] Mark Gates, Ajay Tirumala, Jon Dugan, Kevin Gibbs, Iperf User Docs, May, 2004.
[6] Chunfeng Luo, Shijie Cheng, Lan Xiong, Joseph Nguimbis, Youbing Zhang, Jia Ma , "A Nonlinear Equalization Method Based on Multilayer Perceptron
for OFDM Power-Line Communication," IEEE Transactions On Power Delivery, vol. 20, no.4, October, 2005.
[7] Kaywan H. Afkhamie, Srinivas Katar, Larry Yonge, Richard Newman, "An Overview of the upcoming HomePlug AV Standard," proceedings of International Symposium on Powerline Communications, pp. 400-404, April, 2005.
[8] Y. H. Ma, P. L. So, E.Gunawan, Y. L. Guan, " Analysis of Impulsive Noise and Multipath Effects on Broadband Power Line Communications," 2004 International Conference on Power System Technology – PoewerCon 2004, vol.2, pp. 1404-1409, Singapore. 21-24 November, 2004.
[9] H. Meng, Y. L. Guan, S. Chen, "Modeling and Analysis of Noise Effects on Broadband Power-Line Communications," IEEE Transactions On Power Delivery, vol. 20, no. 2, April 2005.
[10] Nikolaos Papandreou, Theodore Antonakopoulos, "Resource Allocation Management for Indoor Power-Line Communications Systems," IEEE Transactions On Power Delivery, vol. 22, no. 2, April 2007.
[11] Mark Russell, Gordon Stüber, "Interchannel Interference Analysis of OFDM in a Mobile Environment," proceedings of IEEE VTC’95, IL, Chicago, pp.820-824, July, 1995.
[12] Per Kristian Remvik, Nils Holte, Anders Vahlin, "Fading and Carrier Frequency Offset Robustness for different Pulse Shaping Filters in OFDM," Vehicular Technology Conference, 1998. VTC 98. 48th IEEE, 1998. [13] Tiejun (Ronald) Wang, John G. Proakis, Elias Masry, James R. Zeidler,
"Performance Degradation of OFDM Systems Due to Doppler Spreading," IEEE Transactions On Wireless Communications, vol. 5, no. 6, June 2006.