行政院國家科學委員會專題研究計畫 成果報告
解約失效率期限結構之研究
研究成果報告(精簡版)
計 畫 類 別 : 個別型 計 畫 編 號 : NSC 97-2410-H-004-040- 執 行 期 間 : 97 年 08 月 01 日至 98 年 10 月 31 日 執 行 單 位 : 國立政治大學國際貿易學系 計 畫 主 持 人 : 郭維裕 計畫參與人員: 此計畫無其他參與人員 碩士級-專任助理人員:洪梅菱 報 告 附 件 : 出席國際會議研究心得報告及發表論文 處 理 方 式 : 本計畫可公開查詢中 華 民 國 99 年 01 月 22 日
0
行政院國家科學委員會補助專題研究計畫成果報告
解約失效率期限結構之研究
計畫類別:個別型計畫
計畫編號:NSC 97-2410-H-004-040-
執行期間:2008 年 8 月 1 日至 2010 年 1 月 31 日
計畫主持人:郭維裕
成果報告類型(依經費核定清單規定繳交):精簡報告
執行單位:國立政治大學
中 華 民 國 九十九 年一月三十一日
1
The Term Structure of Lapse Rate
Abstract
We study the dynamics of the term structure of lapse rate in Taiwan based on the principal component analysis and the family of the Nelson-Siegel models commonly used in the literature of the term structure of interest rate. Our data consist of six types of lapse rates calculated according to the total number and the total dollar value of lapsed life insurance policy. From the principal component analysis, we find that three common factors are needed to explain the time-series dynamics of the term structures of lapse rate reasonably well. In particular, three common factors explain as high as 94% of the variation in the lapse rate in terms of total policy value of female policyholder and 79% of the variation in the lapser rate in terms of the number of lapsed policy of male policyholder. Based on the results of the principal component analysis, we fit two-factor Nelson-Siegel model and the original three-factor Nelson-Siegel model to the lapse rate term structure. Interestingly, we find that the more parsimonious two-factor Nelson-Siegel model has better or similar performance of the in-sample fit measured by the sum of squared errors in all cases, except the lapse rate in terms of total policy value of male policyholder.
Keywords: the term structure of lapse rates, principal component analysis, mimicking portfolios, Nelson-Siegel Model, Svensson Model
2
摘要
本研究探討台灣人壽保險契約的失效率期限結構。我們採用的方法為利率期限結 構相關文獻中常用的主成分分析以及與 Nelson-Siegel 模型相關的配適模型。樣 本資料包括六種不同分類的保險契約失效率,分別為根據失效契約的總數和總金 額計算而得的總失效率、男性要保人失效率以及女性要保人失效率。根據主成分 分析的結果,我們發現三個共同因子便可解釋失效率期限結構的大部分變異。更 明確的說,三個共同因子最高可解釋以契約總金額所計算之女性要保人失效率的 變異達 94%,而最低則可解釋以契約總數所計算之男性要保人失效率的變異達 79%。由主成分分析的結果判斷,我們決定配適二因子 Nelson-Siegel 模型以及 原始的三因子 Nelson-Siegel 模型。實證結果發現:除了以契約總金額所計算之 男性要保人失效率外,二因子模型的配適效果並不遜於較複雜的三因子模型,而 且往往具有更好的配適度。 關鍵詞:失效率期限結構、主成分分析、複製投資組合、Nelson-Siegel 模型、 Svensson 模型3
Introduction
Understanding the dynamics of the lapse rate is crucial to insurance companies. First, the pricing of an insurance policy is dependent on the dynamics of the lapse rate. Policy lapse may make the insurance companies unable to fully recover their initial expenses, including the cost of procuring, underwriting, and issuing new business. Hence, the insurance companies may incur losses from lapsed policies. Second, the evaluation of reserve adequacy of an insurance company is usually conducted under a presumed dynamics of lapse rate. Third, since the returns of the assets in which an insurance company invests and the lapse rate are both interest-rate-dependent, the dynamics of the lapse rate is also an important factor to the success of the asset-liability management of an insurance company. Therefore, the dynamics of the lapse rate, especially that of the term structure of lapse rate, is of great importance for an insurer’s liquidity and profitability.
Similar to the term structure of interest rate, which illustrates the relationship between interest rates and term to maturity, the term structure of lapse rate describes the relationship between the lapse rate and the policy year of an insurance contract. Kim (2005) find that there exists a convex term structure of lapse rate in Korean insurance market. In other words, the lapse rates decrease as the policy age increases. We observe a similar pattern of the term structure of lapse rate in Taiwan. According to Taiwan Standard Ordinary Experience Mortality and Lapse Rate Report published by Life Insurance Association (LIA-ROC), the lapse rates of various insurance policies also decline as the policy age increases.
Previous studies on the dynamics of lapse rate focus on the relationship between the lapse rate and macroeconomic and firm-specific variables. Richardson and Hartwell (1951) examine the causes of lapse rates and the characteristic of business with high or low persistency. They identify some factors that affect lapse rates, including age, income, occupation, previous insurance, premium frequency, and sex. Chen and Lin (2003) apply data mining technology to predict the probability of early lapse for life insurance policy in Taiwan. They find that the most important factors include the job-quitting problem of salesmen, service quality, premium payment mode, and ability of policyholders to pay the premium. Tsai (2006) finds that the unemployment rate, consumer price index, rate of returns for stock market, economic growth rate, and personal average annual income are the most important factors influencing the lapse behavior in Taiwan. Based on the logit model and the complementary log-log model, Kim (2005) discovers a number of factors that affect lapse rates such as the difference between reference rate and crediting rates, policy age since issue, financial crises, unemployment and economy
4
growth rates, and seasonal effects. More importantly, he also shows that lapse rates decrease as policy ages increase. This result implies a potential term structure of lapse rates.
Two hypotheses have been proposed to explain lapse behavior. The emergency hypothesis contends that policyholders utilize cash surrender values as emergency funds when facing personal financial distress. A testable implication of this hypothesis is that the lapse rate would increase during economic recessions. On the other hand, the interest rate hypothesis posits that the lapse rate rises when the market interest rate increases because the latter acts as the opportunity cost for owning insurance contracts. Outreville (1990) finds consistent support for the emergency fund hypothesis based on two lapse rate measurements in both the United States and Canada. The support for the interest rate hypothesis is weak because interest rate variables are significant in only one of four cases.
The interest rate hypothesis finds its ground from more recent studies in the
Transaction of Society of Actuaries Reports (Cox et. al., 1992) and the Annuity
Persistency Study in the 1995-1996 reports. These studies find that lapse rates increase with the spread between the policy’s credited rate and the market interest rate. These somewhat inconsistent results are probably due to the differences in sample periods and empirical methods.
Kuo, Tsai, and Chen (2003) utilize the error-correction model to reexamine the contending lapse rate hypotheses: the emergency hypothesis and the interest rate hypothesis. They find that the employment rate influences the lapse rate in both the long and short run and the interest rate causes variations in the lapse rate mainly in the long run, the interest rate hypothesis is favored against the emergency hypothesis in the sense that the interest rate is more economically significant than the unemployment rate in explaining the dynamics of lapse rates.
Based on the above literature review, we can summarize two important conclusions. First, there exists a term structure of lapse rates. Second, there exists a significant relationship between the lapse rate and some macroeconomic variables, such as the difference between the market interest rate and crediting rates, financial crises, unemployment and economy growth rates, and seasonal effects. The purpose of this study is to investigate the dynamics of the term structure of lapse rates and relate it to macroeconomic variables so that we can understand the underlying forces that drives the lapse behavior.
This paper adopts the stochastic models in the literature of the term structure of interest rates to study the dynamics of the term structure of lapse rates in Taiwan. Firstly, we follow Litterman and Scheinkman (1991) to employ principal component analysis (PCA) to extract underlying latent factors of the term structure of lapse rates.
5
Next, we adopt the methodology of Chen, Roll, and Ross (1986) to relate these factors to some macroeconomic variables. Finally, we attempt to construct the mimicking portfolios of these underlying factors based on interest rates of different terms to maturity. These mimicking portfolios are important because it is possible for insurance companies to hedge the risks caused by the shifts of the term structure of lapse rates through them.
Secondly, we employ the Nelson-Siegel family models to describe and estimate the shape of the term structure of lapse rates. Although these models have been proven useful in describing the shape of the yield curve, they can be classified as static models that are not able to properly illustrate the dynamic behavior of the yield curve. The same reason is equally applied to the dynamic behavior of the lapse curve. Therefore, we decide to take up the method proposed by Diebold and Li (2006) to describe the dynamics of the term structure of lapse rates. Diebold and Li begin by estimating the parameters of Nelson-Siegel model for every yield curve and then examine the dynamic behavior of the parameters by fitting various time series models, e.g., the ARIMA models and the error-correction model. If some time series models can satisfactorily fit the time series of these parameters, then it is possible to forecast them in advance and the whole yield curve. In other words, if we are able to successfully estimate the term structure of lapse rates based on Diebold and Li’s method, we have a chance to forecast the future behavior of the lapse curve. After this, we also attempt to follow the method of Willner (1996) to explore the possibility of hedging the cash flow risk caused by the lapse behavior of policyholders based on estimated Nelson-Siegel model.
Despite of the obvious importance of lapse rate, there is a paucity of academic research on its dynamics, not to mention the dynamics of the term structure of lapse rate. As a matter of fact, to the best of our knowledge, this paper is the first rigorous study of this topic. This is the major contribution of this paper. Because the empirical results of this paper would be useful for the insurance companies to evaluate their reserve adequacy and pricing correctness of policies, this paper also has significant practical contribution to the insurance industry.
Our data consist of six types of lapse rates calculated according to the total number and the total dollar value of lapsed life insurance policy. From the principal component analysis, we find that three common factors are needed to explain the time-series dynamics of the term structures of lapse rate reasonably well. In particular, three common factors explain as high as 94% of the variation in the lapse rate in terms of total policy value of female policyholder and 79% of the variation in the lapser rate in terms of the number of lapsed policy of male policyholder. Based on the results of the principal component analysis, we fit two-factor Nelson-Siegel model and the
6
original three-factor Nelson-Siegel model to the lapse rate term structure. Interestingly, we find that the more parsimonious two-factor Nelson-Siegel model has better or similar performance of the in-sample fit measured by the sum of squared errors in all cases, except the lapse rate in terms of total policy value of male policyholder.
Methodology
We employ principal component analysis (PCA) to extract underlying latent factors of the term structure of lapse rates. The data input to PCA must be stationary. However, most financial data are non-stationary, e.g., stock prices, rates or yields. Lapse rates may not be the exceptions. If this is true, lapse rates will have to be transformed, commonly into log first differences or rates of change, before PCA is applied. The transformed lapse rates will also need to be normalized to have mean 0 and variance 1 before the estimation, otherwise the first principal component will be dominated by the input variable with the greatest volatility. In other words, we assume that each column in the T k stationary data matrix of lapse rates has mean 0 and variance 1. PCA is based on an eigenvalue and eigenvector analysis of , the symmetric correlation matrix of the variables in .
Denote the matrix of eigenvectors of . Therefore ,
where is the diagonal matrix of eigenvalues of . Now order the columns of according to the magnitude of corresponding eigenvalue. If
for then the th column of , denoted by
, is the eigenvector corresponding to the eigenvalue and the column labeling has been chosen so that . The th principal component can be defined as follows.
,
where is the ith column of . This definition can be expressed in matrix notation as
.
As we can see, each principal component is a time series of the transformed variables, and the full matrix of principal components, which has as its
mth column, can be expressed as
.
7
.
Since is an orthogonal matrix, , and so . Because is a diagonal matrix, the columns of are uncorrelated, and the variance of the mth principal component is . From , we know that the variance of each principal component is determined by its corresponding eigenvalue, the proportion of the total variation in explained by the mth component is . Furthermore, . Therefore, the proportion of variation explained by the first n principal components is . Notice that in a highly correlated system the first eigenvalue is always much larger than the others, so the first principal component also will explain a large part of the variation in .
Since and , we have , that is,
. Thus, each vector of lapse rates may be written as a linear combination of the principal components. This is the principal component representation of the original variables that lies at the core of PCA models. It is quite often that only the first few principal components are used to represent each of the input variables, because they are sufficient to explain most of the variation in the system.
After extracting the dominant principal components, we would like to explore their economic intuitions. We will conduct simple correlation analysis and multiple regression analysis. Specifically, we follow Chen, Roll, and Ross (1986) to estimate the following multiple regression analysis.
where , are the macroeconomic variables that may influence lapse rates, e.g., the market interest rate, the unemployment rate, and the economic growth. Through this procedure, we can understand the economic forces underlying the variation of lapse rate term structure.
Finally, based on the returns of fixed-income securities with different terms to maturity, we would like to construct mimicking portfolios for dominant principal components and test the effectiveness of these portfolios in hedging lapse risks. Following Litterman and Scheinkman (1991), we construct mimicking portfolios by solving a quadratic minimization problem subject to linear constraints. For example, in the case of three dominant principle components, constructing a mimicking portfolio that is sensitive to only one single component involves solving three equations with f unknowns, where f is the number of fixed-income securities employed. In addition to its sensitivity to a single common factor, the return on a mimicking portfolio will depend on the variance of the specific factor of each fixed-income security, weighted by the weight of that security in the portfolio. Therefore, the mimicking portfolio that minimized this specific variance is the ideal
8
one.
Litterman and Scheinkman (1991, 1994) perform FA for the interest rate term structure and identify three important common factors that can explain the term structure in great deal. These factors are dubbed as the level, steepness, and curvature factors. Based on their results, several curve-fitting models are developed to better explain the interest rate term structure. The most popular curve-fitting models are the Nelson-Siegel family of models. These are the models we employ to investigate the dynamics of lapse rate term structure. After the determination of the best curve-fitting model, we further adopt the methodology of Diebold and Li (2006) to construct the dynamic models for the estimated parameters of the optimal model in order to forecast the future movements of lapse rate term structure.
Diebold, Piazzesi, and Rudebusch (2005) suggest a two-factor version model of the original three-factor Nelson-Siegel model to fit bond yields. We can estimate this model for the term structure of lapse rate as follows:
,
where and are two latent factors that represent the cross-section average lapse rate and the steepness of the lapse rate term structure, respectively. In comparison, the original three-factor model of Nelson and Siegel (1987) contains one more factor, the curvature factor, as follows:
,
where is the extra latent factor that controls the age point with the maximum curvature.
To make the Nelson-Siegel model more flexible, many extensions of the model have been proposed in the literature. Bliss (1997) develops a three-factor Nelson-Siegel model with two different decay parameters and as follows:
.
Apparently, the Bliss Nelson-Siegel model will only be different from the benchmark model if . Bjork and Christensen (1999) suggest a four-factor Nelson-Siegel model given by
9
.
The fourth component, , resembles the second component as it also
mainly affects short-term maturities. Bjork and Christensen also consider a five-factor model:
.
However, Diebold, Rudebusch, and Aruoba (2006) report that adding two additional factors only leads to a negligible improvement in in-sample fit.
The four-factor Svensson (1994) model is a popular term structure estimation method among central banks. Svensson proposes to increase the flexibility and fit of the Nelson-Siegel model by adding a second hump-shape factor with a separate decay parameter. The resulting model is as follows:
.
The fourth component introduces a second medium-term component to the model. The Svensson Nelson-Siegel model can easily fit term structure shapes with more than one local maximum or minimum along the age spectrum. There are two weaknesses of the Svensson model that it is highly non-linear making the estimation of the model difficult and that a multicolinearity problem occurs when the decay
10
parameters and assume similar values. To overcome these weaknesses, De Pooter (2007) suggests an ‘Adjusted’ Svensson model as the following:
.
Based on the above discussions, we plan to estimate the two-factor model of Diebold, Piazzesi, and Rudebusch, the three-factor model of Nelson and Siegel, the four-factor model of Svensson, and the ‘Adjusted’ Svensson four-factor model of De Pooter. We will compare the performance of these term structure model according to their in-sample fitness and out-of-sample forecast accuracy.
After we decide the optimal model for the term structure of lapse rate, we follow the methodology of Diebold and Li (2006) to construct the dynamic time series model for the estimated ’s. The models we consider include the random walk model, the ARIMA model, the vector autoregression model, and the erro-correction model for cointegrated time series. After the determination of the best dynamic model for each estimated parameter, we are able to predict the future movement of the whole lapse rate term structure through predicting the estimated
’s.
Empirical Results
Our sample data consist of six types of annual lapse rate in 16 policy years during the period 1993-2004. Specifically, for each year during the sample, we have lapse rates for a specific group of policyholders defined in terms of total contract number or total contract value in 16 policy years. Three groups of policyholder are included: all policyholders, male policyholders, and female policyholders. Hence, for a specific group of policyholders, we have two kinds of lapse rate defined in terms of total contract number or total contract value, each of them having 12 annual lapse rate curves which consist of lapse rates in 16 different policy years. Figure 1 shows the term structure of male lapse rate in terms of total contract number.
11
Fig. 1 Lapse Rates for Males in Taiwan Insurance Market During 1993-2004
It displays a convex structure rather than a concave pattern normally seen in the term
structure of interest rates. In other words, lapse rates decrease as the policy age
increases just as shown by Kim (2005). One particular interest feature in Fig. 1 is
that lapse rate drops sharply in the second policy year and then declines gradually in
the subsequent policy years. We hope that our empirical method is able to capture
this interesting property.
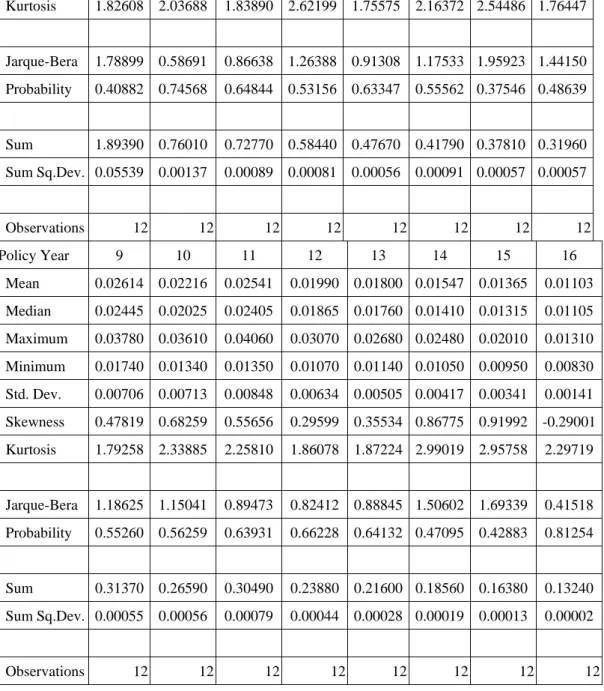
The summary statistics of female lapse rate in terms of total contract number are shown in Table 11.
Table 1. The Summary Statistics of Lapse Rates in Terms of Total Contract Number for Female Policyholders
Policy Year 1 2 3 4 5 6 7 8 Mean 0.15783 0.06334 0.06064 0.04870 0.03973 0.03483 0.03151 0.02663 Median 0.11600 0.06045 0.05995 0.04625 0.03955 0.03260 0.02815 0.02370 Maximum 0.28050 0.08080 0.07500 0.06700 0.05170 0.05040 0.04650 0.03800 Minimum 0.09160 0.04500 0.04770 0.03870 0.03110 0.02380 0.02500 0.01890 Std. Dev. 0.07096 0.01116 0.00900 0.00860 0.00716 0.00909 0.00720 0.00719 Skewness 0.74160 0.24810 0.31009 0.77215 0.26362 0.64251 0.96324 0.58234 1
The other five types of lapse rates show similar patterns as that in Table 1. The results are available from the authours upon request.
12 Kurtosis 1.82608 2.03688 1.83890 2.62199 1.75575 2.16372 2.54486 1.76447 Jarque-Bera 1.78899 0.58691 0.86638 1.26388 0.91308 1.17533 1.95923 1.44150 Probability 0.40882 0.74568 0.64844 0.53156 0.63347 0.55562 0.37546 0.48639 Sum 1.89390 0.76010 0.72770 0.58440 0.47670 0.41790 0.37810 0.31960 Sum Sq.Dev. 0.05539 0.00137 0.00089 0.00081 0.00056 0.00091 0.00057 0.00057 Observations 12 12 12 12 12 12 12 12 Policy Year 9 10 11 12 13 14 15 16 Mean 0.02614 0.02216 0.02541 0.01990 0.01800 0.01547 0.01365 0.01103 Median 0.02445 0.02025 0.02405 0.01865 0.01760 0.01410 0.01315 0.01105 Maximum 0.03780 0.03610 0.04060 0.03070 0.02680 0.02480 0.02010 0.01310 Minimum 0.01740 0.01340 0.01350 0.01070 0.01140 0.01050 0.00950 0.00830 Std. Dev. 0.00706 0.00713 0.00848 0.00634 0.00505 0.00417 0.00341 0.00141 Skewness 0.47819 0.68259 0.55656 0.29599 0.35534 0.86775 0.91992 -0.29001 Kurtosis 1.79258 2.33885 2.25810 1.86078 1.87224 2.99019 2.95758 2.29719 Jarque-Bera 1.18625 1.15041 0.89473 0.82412 0.88845 1.50602 1.69339 0.41518 Probability 0.55260 0.56259 0.63931 0.66228 0.64132 0.47095 0.42883 0.81254 Sum 0.31370 0.26590 0.30490 0.23880 0.21600 0.18560 0.16380 0.13240 Sum Sq.Dev. 0.00055 0.00056 0.00079 0.00044 0.00028 0.00019 0.00013 0.00002 Observations 12 12 12 12 12 12 12 12
The average lapse rates show a decreasing trend with the highest average lapse rate in the first policy year and the lowest average lapse rate in the sixteenth policy year. The volatility of lapse rate has a similar pattern. The standard deviation of the lapse rate in the first policy year is 7.1% and that in the sixteenth policy year is 0.14%. These results indicate there exists significant heteroscadasticity in lapse rates.
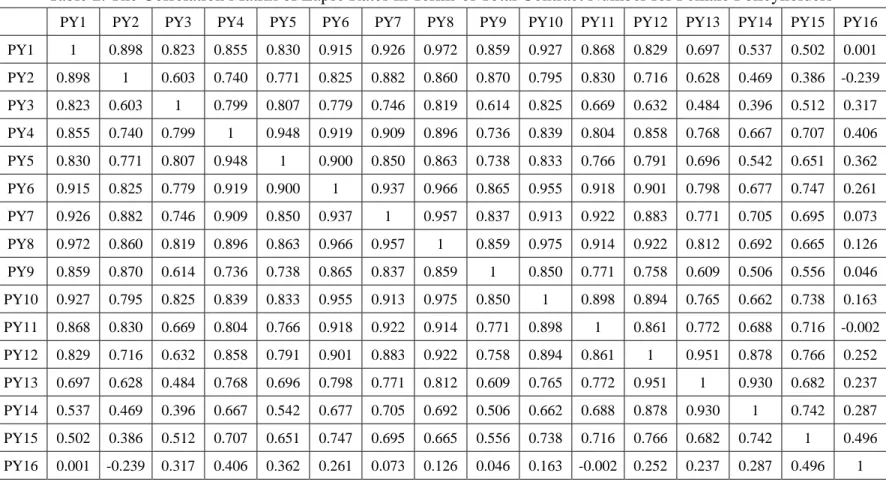
Table 2 presents the correlation structure among the lapse rates in different policy years2. It is obvious that most lapse rates are significantly correlated except the lapse rate in the sixteenth policy year. In other words, there exist common
2
The other five types of lapse rates show similar patterns as that in Table 2. The results are available from the authours upon request.
13
factors among the lapse rates in the first fifteen policy years.
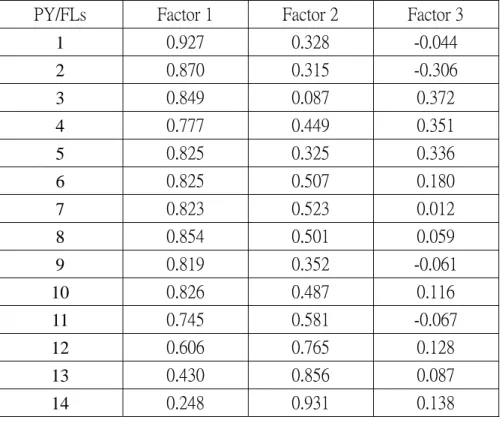
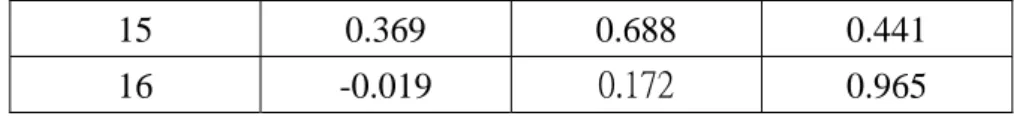
We perform the principal component analysis on the standardized lapse rates in terms of total contract number for female policyholders. The results shown in Table 3 indicates that the first three eigenvalues are all larger than 1 and in total explain about 92% of the variation of lapse rates3. The conventional selection criterion in the literature of the principal component analysis suggests that three principal components are enough to explain the lapse rates in terms of total contract number for female policyholders reasonable well. This result also implies that two-factor or three-factor Nelson-Siegel models are suitable for estimating the term structure of lapse rate. Table 4 presents the factor loadings on the principal components of the lapse rates in sixteen policy years. We can see that the factor loadings on the first principal component are all positive, implying that this common factor influences the average lapse rate in every policy year in similar way. In particular, a decrease in this common factor will induce all lapse rates to decrease but with different magnitude. We dub this common factor as the level factor. It is interesting that the factor loading of the lapse rate in policy year 16 is much larger than those in the other fifteen policy years. This result reveals that the third common factor is closely related to the lapse rate in policy year 16 only. In contrast, the factor loadings on the second common factor do not show any consistent pattern.
Based on these results, we consider discarding the third common factor in order to reach a more parsimonious model and fit the two-factor Nelson-Siegel model proposed in Diebold, Piazzesi, and Rudebusch (2005) to the term structure of lapse rate in terms of total contract number for female policyholders. The estimated parameters, β , β , and λ , for each lapse rate curve are shown in Table 5. We can see that β ’s are all negative and β ’s are all positive. In general, the estimated term structures of lapse rate have good in-sample fit to the original term structures of lapse rates. In the next step, we will follow the method of Diebold and Li (2006) to estimate the dynamics models for these three estimated parameters in order to predict the future dynamic behavior of the term structure of lapse rate.
Conclusions
We study the dynamics of the term structure of lapse rate in Taiwan based on the principal component analysis and the family of the Nelson-Siegel models commonly used in the literature of the term structure of interest rate. Our data consist of six types of lapse rates calculated according to the total number and the total dollar value
3
The other five types of lapse rates show similar patterns as that in Table 3. The results are available from the authours upon request.
14
of lapsed life insurance policy. From the principal component analysis, we find that three common factors are needed to explain the time-series dynamics of the term structures of lapse rate reasonably well. In particular, three common factors explain as high as 94% of the variation in the lapse rate in terms of total policy value of female policyholder and 79% of the variation in the lapser rate in terms of the number of lapsed policy of male policyholder. Based on the results of the principal component analysis, we fit two-factor Nelson-Siegel model and the original three-factor Nelson-Siegel model to the lapse rate term structure. Interestingly, we find that the more parsimonious two-factor Nelson-Siegel model has better or similar performance of the in-sample fit measured by the sum of squared errors in all cases, except the lapse rate in terms of total policy value of male policyholder.
15
Table 2. The Correlation Matrix of Lapse Rates in Terms of Total Contract Number for Female Policyholders
PY1 PY2 PY3 PY4 PY5 PY6 PY7 PY8 PY9 PY10 PY11 PY12 PY13 PY14 PY15 PY16
PY1 1 0.898 0.823 0.855 0.830 0.915 0.926 0.972 0.859 0.927 0.868 0.829 0.697 0.537 0.502 0.001 PY2 0.898 1 0.603 0.740 0.771 0.825 0.882 0.860 0.870 0.795 0.830 0.716 0.628 0.469 0.386 -0.239 PY3 0.823 0.603 1 0.799 0.807 0.779 0.746 0.819 0.614 0.825 0.669 0.632 0.484 0.396 0.512 0.317 PY4 0.855 0.740 0.799 1 0.948 0.919 0.909 0.896 0.736 0.839 0.804 0.858 0.768 0.667 0.707 0.406 PY5 0.830 0.771 0.807 0.948 1 0.900 0.850 0.863 0.738 0.833 0.766 0.791 0.696 0.542 0.651 0.362 PY6 0.915 0.825 0.779 0.919 0.900 1 0.937 0.966 0.865 0.955 0.918 0.901 0.798 0.677 0.747 0.261 PY7 0.926 0.882 0.746 0.909 0.850 0.937 1 0.957 0.837 0.913 0.922 0.883 0.771 0.705 0.695 0.073 PY8 0.972 0.860 0.819 0.896 0.863 0.966 0.957 1 0.859 0.975 0.914 0.922 0.812 0.692 0.665 0.126 PY9 0.859 0.870 0.614 0.736 0.738 0.865 0.837 0.859 1 0.850 0.771 0.758 0.609 0.506 0.556 0.046 PY10 0.927 0.795 0.825 0.839 0.833 0.955 0.913 0.975 0.850 1 0.898 0.894 0.765 0.662 0.738 0.163 PY11 0.868 0.830 0.669 0.804 0.766 0.918 0.922 0.914 0.771 0.898 1 0.861 0.772 0.688 0.716 -0.002 PY12 0.829 0.716 0.632 0.858 0.791 0.901 0.883 0.922 0.758 0.894 0.861 1 0.951 0.878 0.766 0.252 PY13 0.697 0.628 0.484 0.768 0.696 0.798 0.771 0.812 0.609 0.765 0.772 0.951 1 0.930 0.682 0.237 PY14 0.537 0.469 0.396 0.667 0.542 0.677 0.705 0.692 0.506 0.662 0.688 0.878 0.930 1 0.742 0.287 PY15 0.502 0.386 0.512 0.707 0.651 0.747 0.695 0.665 0.556 0.738 0.716 0.766 0.682 0.742 1 0.496 PY16 0.001 -0.239 0.317 0.406 0.362 0.261 0.073 0.126 0.046 0.163 -0.002 0.252 0.237 0.287 0.496 1
16
Table 3. The PCA Results of Lapse Rates in Terms of Total Contract Number for Female Policyholders
PC Eigenvalue Difference Proportion Cumulative
1 12.0504 10.39044 0.7532 0.7532 2 1.659967 0.619342 0.1037 0.8569 3 1.040625 0.653431 0.065 0.9219 4 0.387194 0.053563 0.0242 0.9461 5 0.333631 0.092747 0.0209 0.967 6 0.240884 0.127298 0.0151 0.982 7 0.113587 0.031375 0.0071 0.9891 8 0.082212 0.022866 0.0051 0.9943 9 0.059346 0.036285 0.0037 0.998 10 0.023061 0.013972 0.0014 0.9994 11 0.009089 0.009089 0.0006 1 12 0 0 0 1 13 0 0 0 1 14 0 0 0 1 15 0 0 0 1 16 0 0 1
Table 4. The Factor Laodings of Lapse Rates in Terms of Total Contract Number for Female Policyholders
PY/FLs Factor 1 Factor 2 Factor 3
1 0.927 0.328 -0.044 2 0.870 0.315 -0.306 3 0.849 0.087 0.372 4 0.777 0.449 0.351 5 0.825 0.325 0.336 6 0.825 0.507 0.180 7 0.823 0.523 0.012 8 0.854 0.501 0.059 9 0.819 0.352 -0.061 10 0.826 0.487 0.116 11 0.745 0.581 -0.067 12 0.606 0.765 0.128 13 0.430 0.856 0.087 14 0.248 0.931 0.138
17
15 0.369 0.688 0.441
16 -0.019 0.172 0.965
Table 5. The Estimated Parameters of Lapse Rate in Terms of Total Contract Number for Female Policyholders
Year β β λ β β 1993 -6.6 5.01 0.123 -5.47 4.14 1994 -5.43 3.82 0.163 -5.03 3.54 1995 -4.60 3.17 0.268 -4.84 3.30 1996 -4.72 3.24 0.309 -5.10 3.40 1997 -4.73 3.00 0.316 -5.10 3.15 1998 -4.78 2.74 0.286 -5.04 2.86 1999 -4.96 3.01 0.298 -5.28 3.14 2000 -5.33 3.33 0.215 -5.34 3.33 2001 -5.33 3.36 0.213 -5.32 3.36 2002 -5.60 3.41 0.181 -5.38 3.26 2003 -5.62 3.64 0.214 -5.62 3.64 2004 -5.89 3.90 0.178 -5.71 3.71
18
Reference
Alexander, C., 2001, Market Models: A Guide to Financial Data Analysis, John Wiley & Sons, LTD.
Barber, J.R., and M.L. Copper, 1996 Immunization Using Principal Component Analysis, Journal of Portfolio Management Fall,99-105.
Chen, J., and M. Lin, 2003, Predicting Early Lapse of Life Insurance Policies, Journal of Risk Management 5 (風險管理學報), 341-361.
Chen, N., R. Roll, and S.A. Ross, 1986, Economic Forces and the Stock Market, Journal of Business 59, 383-403.
Cox, S.H., P.D. Laporte, S.R. Linney, and L. Lombardi, 1992, Single-Premium Deferred Annuity Persistency Study, Transactions of Society of Actuaries Reports, 281-332.
Diebold, F.X., M. Piazzesi, and G.D. Rudebusch, 2005, Modeling Bond Yields in
Finance and Macroeconomics, American Economic Review, 415-420.
Driessen, Melenberg, and Nijman, 2003, Common Factors in International Bond Returns, Journal of International Money and Finance 22, 629-656.
Golub, B.W., and L.M. Tilman, 1997, Measuring Yield Curve Risk Using Principal Components Analysis, Value at Risk, and Key Rate Durations, Journal of Portfolio Management 23, 72-84.
Kim, C., 2005, Modeling Surrender and Lapse Rates with Economic Variables, North American Actuarial Journal 9, 56-70.
Kuo,W., C. Tsai, and W. Chen, 2003, An Empirical Study on the Lapse Rate: The Cointegration Approach, Journal of Risk and Insurance 70, 489-508.
Litterman,R., and J. Scheninkman, 1991, Common Factors Affecting Bond Returns, Journal of Fixed Income June, 54-61.
Outreville, J.F., 1990, Whole-Life Insurance Lapse Rates and the Emergency Fund Hypothesis, Insurance: Mathematics and Economics 9, 249-255.
Perignon, C., D.R. Smith, and C. Villa, 2007, Why Common Factors in International Bond Returns are not so Common?, Journal of International Money and Finance 26, 284-304.
Richardson, C.F.B., and J.M. Hartwell, 1951, Lapse Rates, Transactions of the Society of Actuaries 3, 338-396.
Soto, G.M., 2004, Using Principal Component Analysis to Explain Term Structure Movements: Performance and Stability, in: Tavidze, A. (Ed.) Progress in
Econmics Research, Volume 8. Nova Science Publishers, New York.
19
Between Life Insurance Surrender Rate and the Macroeconomics, Master Thesis, Feng-Chia University.
行政院國家科學委員會補助國內專家學者出席國際學術會
議報告
計畫期間參加的第一次會議
報告人姓名 郭維裕 服務機構及職稱 政治大學國際經營與貿易學系 專任副教授 時間 會議 地點 2008 / 7 /6 –7/ 10 日本橫濱 本會核定 補助文號 NSC 97-2410 -H-004-040 會議 名稱 (中文)(英文) Asian FA-NFA 2008 International Conference
發表 論文 題目
(中文)
(英文)Market Trading Mechanism and Market Quality: Call Market versus Continuous Action Market
報告內容應包括下列各項: 一、參加會議經過 個人先是於 7/6 早上參加 welcome reception。7/7 到 7/9 兩日陸續參加幾場研討會, 亦曾提供報告者意見。7/9 下午進行文章的 presentation,同時間擔任一篇文章的評 審。 二、與會心得
在會議的 reception and breaks 中,和一些舊識與新認識的學者有不錯的互動,很好。 也有機會看到其他學者正在研究的東西,一方面 update 最新資訊,二方面激勵自 己。值得一提的是,這次擔任我的文章評審是國際知名市場微結構的研究者 Thomas McInish,他給本篇文章許多富有建設性的建議。 三、考察參觀活動(無是項活動者省略) 無 四、建議 五、攜回資料名稱及內容 大會製作之發表人論文集光碟片一份 六、其他 無