國 立 交 通 大 學
電子物理學系
碩士論文
含鐵超導材料 FeSe
1-δ與銅摻雜之(Fe
1-xCu
x)Se
1-δ的核磁共振
研究
NMR study of Iron-based superconductor FeSe
1-δand
Cu-doped (Fe
1-xCu
x)Se
1-δ
研 究 生:吳家慶
含鐵超導材料 FeSe
1-δ與銅摻雜之(Fe
1-xCu
x)Se
1-δ的核磁共振
研究
NMR study of Iron-based superconductor FeSe
1-δand Cu-doped
(Fe
1-xCu
x)Se
1-δ研 究 生:吳家慶 Student:Chia-Chin Wu ,Jack
指導教授:楊本立 Advisor:Ben-Li Young
國 立 交 通 大 學
電 子 物 理 系
碩 士 論 文
A ThesisSubmitted to Department of Electrophysics College of Science
National Chiao Tung University in partial Fulfillment of the Requirements
for the Degree of Master
in Electrophysics
含鐵超導材料 FeSe
1-δ與銅摻雜之(Fe
1-xCu
x)Se
1-δ的核磁共振
研究
國立交通大學電子物理學系碩士班
學生:吳家慶 指導教授:楊本立 教授
中文摘要
我們利用固態核磁共振的方法研究最近發現的鐵基超導體 FeSe1-δ 及摻雜銅元素取代部分鐵的(Fe1-xCux)Se1-δ。這些樣品具有微量的 Se 缺 陷(δ≈0.12,0.15)。我們主要是探討 Se 缺陷和鐵元素在 FeSe1-δ中超導性所扮演的角色。由 Spin-lattice relaxation rate(1/T1)的實驗我們
發現樣品中 spin fluctuation 的強度隨著 Se 缺陷的增加而變小,spin fluctuation 一般被懷疑與非傳統超導體有關,也確實出現在 FeSe1-δ
的樣品中;另外分析 1/T1數據發現並不是整體 FeSe1-δ樣品內部都具有
超導性。藉由 AC susceptibility 實驗的量測,我們亦發現 FeSe1-δ在
Se 缺陷較多樣品中的 superconducting volume fraction 也較少。這 些結果暗示著超導性只出現在 Se 缺陷較少甚至無 Se 缺陷的相中。。至 於摻銅的(Fe1-xCux)Se1-δ,我們的實驗發現摻銅效應導致超導臨界溫度下
降且在極微量的銅摻雜(x≈0.03)時 FeSe 的超導性消失,由我們的 1/T1
數據發現樣品的 Spin-lattice relaxation rate 在摻雜銅元素後並無 明顯改變,表示摻雜銅元素對(Fe1-xCux)Se1-δ內的 spin dynamic 影響不
大 。對照 Williams 等人對摻雜銅(Fe1-xCux)Se1-δ的電阻量測實驗發現
有 metal-insulator phase transition,摻銅的效應對 FeSe 電子組態 比 spin dynamic 的影響大,因此我們認為電子組態的變化可能是超導
NMR study of Iron-based superconductor FeSe1-δ and Cu-doped (Fe1-xCux)Se1-δ
Department of Electrophysics National Chiao Tung University
Student: Chia-Chin Wu,Jack Advisors: Ben-Li Young
Abstract
The roles of Se deficiency and Fe atoms, for the superconductivity of FeSe, have been respectively investigated in FeSe1-δ and (Fe1-xCux)Se1-δ, by our NMR experiments. The data, for nuclear spin-lattice relaxation rate (1/T1), show that the spin fluctuations are weakened at a larger δ, and are correlated with the superconductivity in FeSe. The superconducting volume fraction, estimated by our ac susceptibility experiments, is found to vary inversely with d. Our findings suggest that the Se-deficient FeSe has an inhomogeneous phase, where the superconductivity is associated with the regions having few or no Se vacancies. As for (Fe1-xCux)Se1-δ, Tc is rapidly suppressed by Cu doping and vanishes around x=0.03. The 77Se and 63Cu NMR linewidths suggest that a local moment is induced at the Fe sites, and not at the Cu sites. However, 1/T1 shows no obvious change with the Cu doping. We suspect that other effects, such as disorder or change in the density of states, have more influence on Tc suppression, since a metal-insulator transition, induced by Cu substitution, occurs in the resistivity measurements.
致謝
自從上了交大電子物理系,匆匆時光兩年已過,感謝母親的栽培, 我才能有有機會考上交大電子物理所,在這段時間感謝楊老師對我的栽 培與教導,也學到了核磁共振技術,雖然還是有許多不懂得地方,但對 於物理中的複雜卻又有著如此巧妙的規律,讓我感受到物理的奧妙,這 也是我當初會想考物理所的原因,之後即將要工作了,相信在電子物理 系學到在研究物理時所必須具有的邏輯思考與大膽假設小心求證的思 維,對我在思考事物有莫大的影響。 在就讀交大電物的期間,我認識了許多很棒的人,在韋儒身上學到 了很多物理的知識,很多東西常常都要請教他,培源學長人很好,很照 顧學弟,祝你的博士研究順利,也感謝宗佑給實驗室帶來的歡樂。另外 在隔壁實驗室也認識許多朋友,學儒、耀宗、雅菁、佑廣、還有學弟妹 們,不管在各方面,我在大家的身上也學了很多東西,也謝謝大家帶給 我歡樂。中正的朋友們,常常跟大家一起吃飯打球聊天,謝謝大家陪我 度過這段時光。還有宗穎,感謝你教我很多寫程式的知識,剛來交大的 期間,也多虧有你的照顧,還有教會的朋友人都很好,是我見過最純真 善良的人們。 在未來的日子裡,雖然大家都各奔前程,有的要從軍有的讀博班, 也有要工作的,希望大家都會順順利利的,下次再遇到的時候,也許有 的人都已經結婚生子,最後還是要感謝每一個我認識的人,沒有你們就 不會有現在的我,謝謝。Contents
Abstract (Chinese) Abstract (English) Acknowledgement Contents Chapter 1 Introduction 1.1 Iron-based superconductors 1.2 FeSe1- superconductorChapter 2 Principles of nuclear magnetic resonance 2.1 Hamiltonian and spectra
2.2 Bloch equations
2.3 Frequency shift and linewidth 2.4 Spin-lattice relaxation
Chapter 3 NMR experimental methods and instruments 3.1 Fourier transformation in NMR
3.2 Hahn spin echo
3.3 T1 measurement (Inversion recovery method) 3.4 AC susceptibility measurement
3.5 Our instruments for NMR experiment
Chapter 4 Experimental Process and Results 4.0 Brief description
4.1 Structure& Resistivity measurement& Phase diagram 4.1.1 X-ray different patterns of FeSe1-δ and (Fe1-xCux)Se1-δ 4.1.2 Resistivity measurements of FeSe1-δ and (Fe1-xCux)Se1-δ 4.1.3 Phase diagram of FeSe1-δ
4.1.4 Phase diagram of (Fe1-xCux)Se1-δ with different Cu doping i ii iii iv p.1 p.2 p.4 p.5 p.6 p.7 p.10 p.11 p.12 p.14 p.15 p.16 p.16 p.16 p.18 p.19
(Fe1-xCux)Se1-δ 4.3 NMR spectrum of FeSe1-δ 4.3.1 NMR spectrum of FeSe1-δ
4.3.2 Linewidth and frequency shift from NMR spectrum of FeSe1-δ
4.4 Spin-lattice relaxation rate (1/T1) of FeSe1-δ 4.4.1 Spin lattice relaxation curve of FeSe0.88
4.4.2 Behavior of distributed T1(T)in FeSe0.88 4.4.3 1/T1T in FeSe1-δ with different Se deficiency 4.4.4 1/T1T by two-T1 curve fitting of FeSe0.88 & FeSe0.92
4.5 NMR Spectra of Cu-doped (Fe1-xCux)Se1-δ 4.5.1 77Se NMR spectra of (Fe1-xCux)Se1-δ 4.5.2 63Cu NMR spectra of (Fe1-xCux)Se1-δ
4.5.3 Comparison of 77Se and 63Cu NMR spectra of (Fe1-xCux)Se1-δ
4.5.4 Linewidth and frequency shift of (Fe1-xCux)Se1-δ
4.5.5 Relation between Tc and disorder effect in (Fe1-xCux)Se1-δ 4.6 1/T1T of (Fe1-xCux)Se1-δ by stretched exponential fitting
4.7 Conclusion & Summary
Appendix: Personal designs of apparatus and programs References Publication p.21 p.23 p.23 p.25 p.26 p.26 p.28 p.29 p.31 p.34 p.34 p.35 p.36 p.37 p.38 p.39 p.40 p.43 p.60 p.62
Chapter 1 Introduction
1.1 Iron-based superconductors
The first member of iron-based superconductor LaFeOP, containing the Fe element, which was originally thought of against the formation of superconductivity, was first found by Hideo Hosono's research group at the Tokyo Institute of Technology in 2006[1]. Due to its low superconducting critical temperature, close to boiling point of liquid helium, LaFeOP, did not attract much attention. Until 2008, Hideo Hosono's research group found the second member of iron-based superconductor family, La(O1-xFx)FeAs,x=0.05~0.12[2]. This material has a relatively high superconducting critical temperature, Tc=26K. Then it has quickly drawn considerable attention. The emerge of iron-based superconductors did lead to a carnival-like atmosphere that scientists have tried synthesizing new members of iron-based superconductors and characterizing their properties.
After Japanese research group had successfully raised Tc up to 26K by replacing As with P, groups in china made similar compounds raised Tc to 56K. Although these Tc are not high enough to challenge the records set over the past twenty years by cuprate superconductors, scientists are still excited for several reasons. First, the critical temperature of Fe-based superconductors is much higher than conventional superconductors. Second, iron compounds have the potential for technological applications compared to copper oxides, which are too brittle to make wires for electric power transmission applications. Besides, superconducting iron is an unexpected element to make a superconductor because of magnetism is not compatible with superconductivity according to the conventional BCS theory. The Meissner effect also states that superconductors will expel magnetic fields. Why can the magnetism of the iron element coexist with the iron-based superconductors? There is no consensus on the answer yet.
There are four major kinds of Fe-based superconductors up to date. The first one is La(O1-xFx)FeAs, called the 1111 system. The second is (Ba1-xKx)Fe2As2 [3],
Institute of Physics in Academia Sinica, Taiwan. Though its superconducting temperature is not as high as the other Fe-based superconductors, it has quickly attracted much attention due to its structural simplicity and easier material handling. Recently the high pressure experiments have raised its Tc up to 36.7 K [6], comparable to the FeAs-based superconductors.
Like the cuprate superconductors, some Fe-base superconductors need electron or hole doping in order to show superconductivity. For example, LaOFeAs is not superconducting, but La(O1-xFx)FeAs is after F doping. By ultrafast laser experiment, pseudogap behavior is also found in some iron-based superconductors. Pseudogap behavior is considered as an important feature in cuprate superconductors.
1.2 FeSe
1-superconductor
FeSe resemble the FeAs-based superconductors in many ways. For example, both of them have layered structures, electronic states, and even the lattice instabilities [7-9]. However, whether FeSe is close to a spin-density wave (SDW) instability or magnetic order like the FeAs-based superconductors is still unclear[6,10].
FeSe1- has complex structure phases, as summarized in the original literature where the superconductivity was reported in Se-deficient tetragonal β-FeSe[5], i.e., FeSe0.82 and FeSe0.88. And then it was soon followed by a similar finding for a composition of less Se deficiency, FeSe0.92 [13]. However, recently McQueen’s group claimed that superconductivity actually exists only in the nearly stoichiometric FeSe. They further pointed out that very little Se deficiency (δ=0.03) is enough to destroy the Cooper pairing in this material [14]. Although they attributed this discrepancy to the oxygen contamination in those Se-deficient FeSe samples, we would like to know why o FeSe0.82 and FeSe0.88 are still superconducting. Clarifying the role of Se deficiency in FeSe is essential to any theoretical treatments of pairing mechanism of superconductivity because it determines whether it is essential to introduce charge carriers in the two dimensional FeSe layer or not, as compared to the cuprate superconductors.
Understanding the role of Fe2+ spin is another important issue, which has already been investigated by chemically substituting Fe for Cu, i.e., (Fe1-xCux)Se1-δ[15,16]. Superconductivity in FeSe is rapidly suppressed by only 1.5% copper substitution. The iron (Fe2+) ion and the copper (Cu2+) ion have the same
subs intro to c rela the spin stud supe FeS occu from in sp dras supp diso inte with mor show stitution is oduce disor heck what c We hav axation rates roles of Se n fluctuation dy reported erconductin Se has an in urs only in m previously pin fluctuat As to Co stically upo pression o order correl eresting phe h copper-do re significan wn in the re generally rder and mo causes supp e conducte s (1/T1) on F e deficiency ns are clos by Imai’s g ng volume f nhomogene the regions y reported N tion and sup
opper-dope on Cu dop
f supercon ated has als nomenon th oping effect ntly than th esistivity me expected to odify spin co pression of s ed the 77S FeSe0.88 and y and magne ely related group [11]. T fraction ana eous electro s with few o NMR exper perconductin d FeSe, we ping and t nducting cr so been inv hat the spin-t. So we sus he spin dyn easurement o alter the orrelation. I superconduc e NMR e d Cu-doped etic correla to the supe The nuclear alyses in ou onic state, w or no Se va riments [11, ng volume f e have foun then satura ritical temp vestigated. I -lattice rela spect that th namics bec ts [16]. This lattice and In this thesi ctivity in th xperiments d (Fe1-xCux)S ation in FeS erconductiv r spin-lattice ur study ind where the c cancy, expa ,12]. This is fraction at l nd that the ates rapidly perature ca In addition, axation rate he electroni ause a met s will be dis d electronic is, one of ou he Cu-doped and nucle Se1-δ in orde e. Our resu vity in FeSe e relaxation dicate that t cooper pair anding upon s supported larger Se de NMR linew y. The rea aused by , we found (1/T1) is ne ic band stru tal-insulator cussed later c structures ur works is d FeSe. ear spin-la er to investi ults suggest e, as the ea n rate (1/T1) the Se-defic ring mechan n similar re by the decr eficiency. width incre ason that r copper-indu that there i early unchan ucture is alt r transition r . s, to also attice igate that arlier ) and cient nism sults rease eases rapid uced is an nged tered was
Chapter 2
Principles of nuclear magnetic resonance
2.1 Hamiltonian and spectra
The general form of nuclear spin Hamiltonian can be written as the sum of four interactions:
,
The first term is the Zeeman Effect term of the nuclei, which can be written as: γ ∙ ,
where γ is called gyromagnetic ratio. With this equation we can determine the desired NMR frequency we want to observe by changing the applied magnetic field, because the magnitude of energy between the energy levels is γ ∙ . If we apply a electromagnetic wave to the sample with some appropriate conditions, the nuclei will be excited to the higher energy level, where the frequency ω is exactly equal to γ . Figure 2-1 is an illustration of the energy levels of the 1/2 nuclear spin in the magnetic field. If we excite the nucleus in the ground state to the excited by applying a EM wave energy exactly equal to the energy gap between the two energy level, then the excited nucleus will return back to the ground state and emit photons, which gives on the NMR spectrum.
Figu The This inte inte inte tran from rem inte occu non grad In a the N
2.2
ure 2-1. Illu e third term s interaction eraction, wh eraction, hap eraction, hap nsferred inte m outside, w maining term eraction betw urs in the co n-symmetric dient and qu another word NMR satellBloch e
ustration of is the intera n is also cal hich happens ppening bet ppening bet eraction. It h where the fie ms, and ween nuclea ondition of c crystalline uadrupolar e d, we can k lite frequenequations
spin 1/2 nuc action betw lled hyperfin s between n ween nucle ween nucle happens wh eld is transf d , are ar spins, res the probing e environme effect of nu know the symcy.
s
cleus in ma ween e- and n ne interacti nucleus and eus and non eus spin and hen the nucl ferred by ot e the quadru spectively, w g nuclear sp ent simultan uclear spin, t mmetry of t agnetic field nucleus, wh on. is c S-wave ele S-wave ele d orbital fiel eus feels th her conduct upolar intera where the qu in greater th neously. By the NMR sa the crystal s d. hich can be w call Fermi c ection . ection. d. i e magnetic tive electron action and d uadrupolar han 1/2 and the interact atellite lines structure of written as: contact is dipola is orbital is called field origin ns. As for th dipolar interaction d with tion of elect s will emerg the sample ar nated he tric ge. byThe whi sem we sam desi theo and T1 c corr desc exci ente dep Figu
2.3
loca of th the caus NM refle e Bloch equa ich is the mi-classical t apply an a mple for the ignated orie ory in conde T2, where t corresponds responds to cribing the ite the sam er a non-eq ends on the ure 2-2. SpiFreque
The NM al susceptib he peak. By local magn se the shift MR spectrum ects the lo ation is a se summatio theory, we appropriate e time we d entation. W ensed matte the T1 is spi s to a longit a transvers dynamic pr mple by app quilibrium s e spin-lattice in-lattice relency shift
MR frequenc bility in the y the equati netic field t. The inter m, we can ob ocal magnet emi-classica n of the can know h radio frequ determine, t With this we er. The total in-lattice re tudinal rela se relaxationrocess of th lying a righ tate and ret e relaxation laxation pro
and linew
cy shift is a sample. Fr ion of frequ information ractions we btain both t tization (or al way to de nuclear sp how to cont uency, tech then the tot e can easily l magnetizat elaxation tim axation of th n in the xy-he total mag ht radio fre turn to the n time const ocesswidth
a physical q rom the NM uency shift, n, from wh ere already the frequenc r susceptib , escribe the m pins in co trol the mac hnically call tal magnetiz y have a ph tion alters w me and T2 is he magnetiz -plane. Figu gnetization equency, the equilibrium ant. quantity to MR spectra, , 1 hich we wi described i cy shift and ility) and t macroscopic ondensed m croscopic m led pulse in zation will hysic pictur with two tim s spin-spin zation along ure 2-2 is an of the nucle e nuclear sp m state. Theget the info we can kno , we ll know wh in chapter d linewidth, the linewid c magnetiza matter. By magnetizatio n NMR, to be rotated re of the N me constant relaxation t g the z-axis n illustration ear spins. I pin system e spending ormation of ow the pos will further hat interact 2.1. Throug where the dth reflects ation the on. If o the to a NMR s, T1 time. s. T2 n for f we will time f the ition r get tions gh a shift s the
the condensed matter is bigger.
2.4 Spin-lattice relaxation
The spin-lattice relaxation rate, 1/T1 can provide information of dynamic process, such as spin fluctuation. In order to explain T1 briefly, we can introduce the Fermi golden rule, given by
P→ | i| |f | δ ω E +E ,
which represents the rate of transitions between two states. is the time-dependent Hamiltonian giving rise to the spin-lattice relaxation. We can infer that the process of spin-lattice relaxation is related to the fluctuation of hyperfine field, so the 1/T1 can be written as:
T 〈 t 0 〉e dt,
where 〈 t 0 〉is the autocorrelation function. If the t alters between , then 〈 t 0 〉 e / , where τ is the correlated time constant.
Through further calculation, we can get
T γ τ
1 ω τ
With the above equation, we can know that if the electrons are becoming more correlated with neighboring electrons in strong correlated electron system, such as entering magnetic order or quantum critical point. The correlated time constant τ will become longer, which means the itinerant electrons in the material become more correlated through certain exchange interaction. Figure 2‐3 is a simulated plot of 1/T1 versus 1/ωτ. We consider there is a magnetic phase transition at Tm, where τ is temperature dependence. For a consideration of second order phase transition, τ T is given by, τ T τ 1 T/T , for T Tm τ T τ T/T 1 , for T Tm In this picture, we can show that there is a peak of 1/T1, which occurs when the temperature is at Tm. From figure 2‐3 we connect the spin‐lattice relaxation with
figu Figu Tm. Figu For non The Mor ure 2‐4. ure 2‐3. 1/ ure 2‐4. 1/T simple m n‐interactin ere is very to get th riya rewrit /T1 versus 1 T1 versus T metal, we ng systems. few system he strengt ed the 1/T 1/ωτ, wher T/ Tm. can use t It is given T TK ms for whic th of quasi 1, which is re the peak the Korrin by K π γ ch iparticle in given by k is at phas nga relaxat /μ 1,and we nteractions se transitio tion, which can measu s. In anoth on tempera h is valid ure the rati her form, T ture for io of Toru
from which we can obtain the quantity of dynamic susceptibility. Usually the dynamic susceptibility is dominated by fluctuations, such as spin fluctuations in superconductivity. We can check that whether there are spin fluctuations in the high‐Tc superconductors or other quantum critical phenomenon. Furthermore, we can write 1/T1 by employing the superconducting density of states, given by T ∝ A C E, E N E f E N E 1 f E dE For a BCS superconductor, its density of state is given by N E E √E ∆ N E and the coherence factor is C E, E ∆
At E ∆ , N has a singularity and C E, E is non‐zero. Then the T has a singularity at T Tc. In a s‐wave superconductor, 1/T1 has a maximum value, called Hibel‐Slitcher coherence peak. For T Tc/3, this equation can be reduced to T ~exp /k T . This behavior is only valid for s‐wave. Different kinds of wave superconductor have different gap symmetry and we can get different power law relation of T by introducing the density function.
Ch
NM
3.1
tech mea mea amp ther so w spec obse tran Figu freq spechapter 3
MR exp
Fourie
Ernst R hnique in N asurement. asurement t plifiers and rmal noise f we have to ctrum. Now Figure 3 erve the in nsform the F ure 3-1. Ill quency dom ctrum direct3
perimen
r transfor
. R. and A NMR expe Generally, the noise at other elect from the coi o take any wadays, all t 3-1 is an ill nformation i FID spectrum lustration of main helpin tly.ntal met
rmation i
Anderson W eriment hav when we t the same tronics in th il used to de ways we c he NMR ex lustration o in the FID m by Fourie f Fourier tr ng us justifthods an
in NMR
W. A. firs ave greatly conduct th time. Som he spectrom etect the sig can to imp xperiments a of Fourier t time doma er transform ransformatio fy the majnd instr
st using th improved he NMR m me of the n meter, but th gnal. NMR i prove the si are F.T. NM ransformati ain spectrum mation. on in NMR jor frequenrument
he Fourier the sensit measurement oise is con he major co is not a sens ignal-to-noi MR. ion in NMR m directly, R, which let ncy contributs
transforma tivity in N t, we will ntributed by ontributor is sitive techn ise ratio in R. It is har so we nee t us observe ution of N ation NMR also y the s the nique, n the rd to ed to e the NMR3.2
disc met ther τ aft a tim illus phy One caus Figu echoHahn s
In 1950 covery or w thod provide refore be ran Hahn ma fter the initiame 2τ after stration of ysical basis e advantage sing a sprea ure 3-2. Ill o.
spin echo
, Erwin H we can also es an impor nked among ade the remal pulse, mi the initial p the sequen of the spin e of spin ec ad of spectru lustration o ahn burst say it’s an rtant way to g the most s arkable disc iraculously pulse. He n nce and the n echo meth cho is that t um can be g f the seque on the wo invention, o the develo significant c covery that there will a named the s time evolu hod can be the inhomo gotten out. ence and th orld of scie spin echo m opment of pu contribution if we apply appear anoth signal the “s ution diagra explained geneity of e time evol ence with method [1]. ulse method ns to magnet y a second π her free ind spin echo”. am of the from the B the applied lution diagr his remark . The spin e ds in NMR, etic resonanc π/2 pulse a duction sign Figure 3-2 spin echo. Bloch equati d magnetic ram of the kable echo , and ce. time nal at 2 is a The ions. field spin
3.3
inve sequ syst sign to p som state func reco then We sign and the spin FiguT
1mea
In order ersion reco uences for tem and mo nal size dep prepare the me waiting p e of the sp ction of the overy metho n we wait a will get a nal intensity will get a m curve is a n-lattice rela ure 3-3. Puasurement
to get the i overy metho measuring onitor its e pends on T1. nuclear sp period durin pins. The re e waiting tim od. First we series of tim series of da y of the spin magnetizatio exponentia axation. ulse sequent (Inversi
information od was de the spin-lat evolution or . The forme pins in som ng which the ecovery of me. Figure e give a gro me. Third, w ata as a func n system be on curve (re al function, ce of a T1 mon recove
n of the sam eveloped to ttice relaxa r achieve a er scheme in me non-equi e spins are f the nuclea 3-3 is a ty oup of sequ we give a sp ction of tim ecomes stro ed dot line) , M(t)=M(∞ measuremeery metho
mple’s spin-o get the T ation time T a steady sta nvolves a p librium con allowed to ar spin pop pical pulse uence, satur pin echo to me. Then we onger with as a functio ∞)[1-exp(-t/ entod)
-lattice relax T1 data. A T1 either ini ate conditio pulse (or a g nfiguration relax, a pul pulation is m sequence o rating the sp detect the s e plot it as the time. W on of time. /T1)], where xation time All pulse N itialize the on in which group of pu and then, lse monitors monitored of the inver pin system, signal inten figure 3-4. We fit the p The functio e the T1 is , the NMR spin h the lses) after s the as a rsion and nsity. The eaks on of s theFigu
ure 3-4. Ma
3.4
The
circ
of
sus
me
tran
sus
the
our
frac
Fig
circ
AC sus
e AC susc
cuits and t
our LC
ceptibility
asurement
nsition (s
ceptibility
data will
r sample. B
ction by A
gure 3-5. S
cuit.
sceptibilit
ceptibility
the networ
circuit in
y of samp
t. This da
supercond
y. For exa
have a tu
Besides, w
AC suscept
Scheme of
ty measur
experimen
rk analyze
n the NM
le. Figure
ata is a go
ductor, m
ample, if o
urning poi
we can als
tibility me
f AC susce
rement
ntal instru
er. By me
MR probe
e 3-5 is a s
ood tool t
magnetic,
our sample
int, which
so determ
easuremen
eptibility m
ument is u
easuring th
e, we ob
scheme of
to find wh
structure)
e enters an
tells us th
mine the su
nt.
measurem
utilized our
he resonan
tain a ro
f our AC
hether the
) reflecti
ntiferroma
he Neel te
upercondu
ment by NM
r NMR pr
nce freque
ough data
susceptibi
ere is a ph
ing to t
agnetic or
emperatur
ucting volu
MR LC
robe
ency
a of
ility
hase
heir
rder,
e of
ume
3.5
supe supe syst heli FiguOur inst
Our NM erconductin erconductin tem. All the ium recycle ure 3-6. Picruments f
MR system ng magnet ng magnet D e operation system so t cture of ourfor NMR
m composes power sup Dewer, PC, s can be co that we can NMR setupR experime
s of a sp pply, tempe pumping c ontrolled au n use the help
ent
pectrometer, rature cont cooling syst utomatically lium very ef , oscillosco troller, hom tem, and He y and remot fficiently. ope, magic me-made pr elium recyc tely. We ha c T, robe, cling ave aChapter 4 Experimental Process and Results
4.0 Brief description
Our experiments have several parts. The following experimental contents will
be introduced in two parts based on the samples of Se-deficient FeSe1-δ and Cu-doped (Fe1-xCux)Se1-δ, respectively. We have demonstrated our measurements of NMR, AC susceptibility, X-ray diffraction, and resistivity, where the NMR measurements include both of spectra and spin-lattice relaxation rate (1/T1).
4.1 Structure & Resistivity measurement & Phase diagram
Before the NMR measurement, we need to confirm that the Se-deficient FeSe1-δ and Cu-doped (Fe1-xCux)Se1-δ have the same tetragonal crystal phase where the superconductivity occurs. We also need to know the phase diagram of Se-deficient FeSe1-δ in different Se deficiency and Cu-doped (Fe1-xCux)Se1-δ in different doping level.
4.1.1 X-ray different patterns of FeSe
1-δand (Fe
1-xCu
x)Se
1-δThe samples of iron selenide (FeSe) are polycrystalline, provided by Maw-Kuen Wu’s research group in the Institute of Physics in Academia Sinica, Taiwan. The detailed methods of sample preparation are in reference 1. Polycrystalline samples of the Se-deficient FeSe0.88 and the Cu-substituted (Fe1-xCux)Se1-δ with (x,δ)=(0,0.12), (0.01,0.15), (0.02,0.12), (0.03,0.12), and (0.04,0.12) were used in our NMR and ac magnetic-susceptibility experiments. In order to prove that the sample of (Fe0.99Cu0.01)Se0.85 has similar features with other samples, (Fe0.98Cu0.02)Se0.88, (Fe0.97Cu0.03)Se0.88, (Fe0.96Cu0.04)Se0.88, FeSe0.88. Figure 4-1 is the powder x-ray diffraction patterns of these samples. Rietveld refinement was analyzed by using GSAS software, to confirm the sample stoichiometry and quality. The x-ray diffraction patterns reflect the detailed structures of our samples. Indeed, through the data on figure 4-1, the (Fe0.99Cu0.01)Se0.85 does have similar structure with other different composition of samples.
Figu (Fe0 axis ure 4-1. 0.98Cu0.02)Se s is the mom Po e0.88, (Fe0.97 ment transfe owder x-ra 7Cu0.03)Se0.8 er, M 4π ay diffracti 88, (Fe0.96C sin θ /λ . ion pattern Cu0.04)Se0.88, ns of (Fe FeSe0.8 . e0.99Cu0.01)Se The horizo e0.85, ontal
4.1
(Fe1 sam dop (~5K dest grea met Figu sam stru valu.2 Resisti
Figure 4 1-xCux)Se1-δ mples and A ping level as K). By the troy the sup ater than 0 tal-insulator ure 4-2. R mples, wher ucture with ues (R300K).vity meas
4-2 is the re . Note that A. J. Willia s an amount e way, we perconducti 0.03, resist r transition. Resistivity re there is other sam Inset showsurements
esistivity (n t a metal-i ams’s resear t of 0.01 ha noted that ivity in (Fe tivity is be (R) data f selenium c ples. All d s the Tc wits of FeSe
1 normalized insulator tr rch group [ ave changed Cu doping e1-xCux)Se1-δ ecoming bi for differen content of 0 data has be th different 1-δand (Fe
to 300K) o ansition is [2,3]. From d supercond g concentra δ. For more igger, whic nt copper c 0.85’s samp een normali doping levee
1-xCu
x)Se
of different observed i m figure 4-2 ducting criti tion at 0.03 e Cu doping ch may be content of ple proved ized to roo el.e
1-δ Cu content in both of 2, very few ical tempera 3 is enoug g concentra e thought a (Fe1-xCux) having sim om tempera ts of f our w Cu ature gh to ation as a Se1-δ milar ature4.1
we Tc. T add stru tetra Figu Stru.3 Phase d
Figure ignore the F The FeSe0.9 ed a quenc ucture order agonal phas ure 4-3. Tc uctural disordiagram o
4-3 gives th FeSe0.97 cas 97 anomaly i ch processi r, an undesi se). c onset for d rder has littof FeSe
1-δ he Tc onset se, we can f is due to the ng to the p ired hexago different Se le effect on δ t to the diff find that the e method of preparing m onal structu e-deficient F n Tc. ferent Se de e structural d f sample pre method and ure phase (s FeSe1-δ. Bes eficiency of disorder has eparation, w d caused an superconduc sides the Fe f the FeSe1 s little effec which Imai e n instabilit ctivity exist eSe0.97 case -δ. If ct on et al. y of ts in , the4.1
leve supp supe Figu.4 Phase d
Figure 4-el. We see pressed by erconductiv ure 4-4. Tcdiagram o
-4 shows th e that the y very fe vity vanishe onset for diof (Fe
1-xC
he phase dia supercond ew Cu do ed. ifferent CuCu
x)Se
1-δw
agram of (F ducting crit oping conc doping levewith differ
e1-xCux)Se1 tical tempe centration elrent Cu d
-δ with diffe erature Tc of 0.03,doping lev
erent Cu do was sudd and thenvel
ping denly the4.2 AC susceptibility measurements of FeSe
1-δand (Fe
1-xCu
x)Se
1-δ Experimental setup is described in chapter 3-4(p.14)4.2.1 Theory of AC susceptibility measurements
We want to know why FeSe0.99, FeSe0.92, FeSe0.88 have similar onset Tc? The superconducting volume fraction estimated from our ac susceptibility may provide a clue. Figure 4-5 shows our ac susceptibility measurements of Imai et al.’s FeSe0.99, our FeSe0.88, (Fe0.99Cu0.01)Se0.85, and (Fe0.98Cu0.02)Se0.88 . The method of measurement is using the LC resonant circuit, originally made for NMR’s measurements, to detect its relative frequency shift by using the Network analyzer [4]. This method utilizes the resonance frequency ω (~1/√LC) of the LC circuit changing with the inductance, which in turn depends on the sample susceptibility χ. That is, L=L0[1+4πχ(T)], L0: inductance of the NMR coil. The rising of the frequency-shift ratio [defined as relative size of change from the frequency at 15K, ω(T)/ω(15K)-1] in figure 4-5 represents the superconducting phase transition because the frequency ω increases as it enters the superconducting state, χ<0. The size of frequency-shift ratio gives a rough estimate of the superconducting volume fraction.
4.2.2 Superconducting volume fraction of FeSe
1-δ& (Fe
1-xCu
x)Se
1-δ We found that FeSe0.88 has a superconducting volume fraction significantly smaller than FeSe0.99 since a small frequency-shift ratio. The dc bulk susceptibilities, reported in reference 12, show the similar result of a weaker superconducting diamagnetic response in FeSe0.82, if the background sign from impurities is subtracted. Note that the pressure experiment on FeSe0.99 shows that Tc and superconducting volume fraction vary simultaneously with pressure [4], unlike in the Se-deficient case, where only superconducting volume fraction varies with Se deficiency. We also did the two-T1 analysis for our FeSe0.88 and found that the volume fraction, for the short T1 component, is about 50%, which is 10% less than that in FeSe0.92 [6].Figu (rep The freq ure 4-5. D produced fr e frequency quency at 15 Data from t om referen shift, on th 5K, ω(T)/ω( the AC ma nce 7), FeSe he vertical ax (15K)-1. agnetic susc e0.88, (Fe0.99 xis, is defin ceptibility 9Cu0.01)Se0. ned as relati measureme 85, and (Fe ive size of c ents of FeS e0.98Cu0.02)Se change from Se0.99 e0.88. m the
4.3 NMR spectrum of FeSe
1-δTo our knowledge, there are three papers of NMR measurements, to date, reporting on superconductivity in FeSe1-δ. Imai’s research group has measured the nearly stoichiometric FeSe0.99 and FeSe0.97, with the samples claimed to be free of oxygen contamination [4]. Kotegawa’s research group and Masaki’s research group have also measured the Se-deficient FeSe0.92 but didn’t say whether there was any oxygen contamination or not [5,6]. In order to resolve this discrepancy, concerning the stoichiometry of the superconductivity in FeSe, the following discussions compare to our FeSe0.88 data, with the data reproduced from the previous literature. The standard Hahn-echo pulse sequences and saturation pulses were, respectively, employed throughout our 77Se NMR spectra and 1/T1 experiments at 75 kilo Gauss (kG).
4.3.1 NMR spectrum of FeSe
1-δFigure 4-6a is the 77Se NMR spectra with different Se deficiency of FeSe1-δ, FeSe0.99, FeSe0.97, FeSe0.92, FeSe0.88, at 10 K. Note that the linewidth increases with the Se deficiency, as expected because NMR linewidth generally reflects the amount of lattice disorder in the sample. From the spectra of different Se deficiency of FeSe1-δ, we can indirectly confirm the correct stoichiometry of these samples. We compare the spectra of disordered FeSe0.88 and ordered FeSe0.99. Similar Tc≈8K suggests that Cooper pairing is not vulnerable to the lattice disorder induced by the Se vacancy. How can we be sure that the growing linewidth reflects the lattice structure disorder caused by Se vacancy? Figure 4-6b is a simulating diagram which is assumed that we consider different quantity of vacancy in a condensed matter. If the vacancy is bigger, then the linewidth is getting bigger, too. Notice that the frequency shift behavior is not so clear in our experimental data. We thought it is because of the experimental error problem.
Figu FeS Figu ure 4-6a. 7 Se0.97&0.99 an ure 4-6b. S 7Se NMR s nd FeSe0.92 a Simulating d spectra, at are reproduc diagram assu 10K, for di ced form re umed by str ifferent Se-eferences 7 a ructure diso deficient Fe and 13, resp order behavi eSe1-δ. Data pectively. ior a for
4.3
the chan susc the NM the from grou We resu the was FeS FeS ther cann indi.2 Linewi
Figure 4 NMR data nge much ceptibility χ spin susce MR is a tech material. T m the resul up [3], whe attribute th ulting from linewidth a s no or few Se0.88 is near Se0.92 in refe re are no im not exclude icated by Midth and f
-7 is the fre of FeSe1-δ with the χ does not ch eptibility (K hnique utiliz The results lts of bulk ere the bulk his discrepa the oxygen at low temp magnetic im rly tempera erence 5. Th mpurity phas e the possi McQueen’s gfrequency
equency sh in figure 4 Se deficie hange much K∝χ). Note zing the nucof local su susceptibil susceptibili ncy to the n contamina erature of o mpurities bo ture indepe herefore, ba ses entering ibility of o group [7]. W
y shift fro
hift and spre 4-6. We note ency (δ), w h either bec the local clei as a loc usceptibilitie lity measur ity increase impurity ph ations. We d our tempera onded to the endent, from ased on NM g the FeSe 1-oxygen con We will leave
om NMR s
ead of shift e that the fr which mea ause freque word with cal probe to es with diff rement, don es significan hases from didn’t observ ature-linewi e FeSe samp m 70K down MR frequenc -δ with diffe tamination e this to latespectrum
to the Se d frequency sh ans that th ency shift is quotation detect the ferent Se d ne by Willi ntly with Se excess iron ve magnetic dth data, so ples. The lin n to Tc, as w cy shift and erent Se def in FeSe1-δ er discussiom of FeSe
1-deficiency f hift (K) doe he “local” s proportion marks bec environmen deficiency d iams’s rese e deficiency n or iron ox c broadenin o we think t inewidth for was the case d linewidth d ficiency, bu for FeSe1 on. -δ from esn’t spin nal to ause nt of differ earch y (δ). xides ng of there r our e for data, ut we -δOy,4.4 Spin-lattice relaxation rate (1/T
1) of FeSe
1-δHere we report our spin-lattice relaxation data of FeSe1-δ and discuss what we have found in our sample. First, I will present a representative 1/T1 data of FeSe0.88 (at 16K) and explain why we use a stretched exponential curve fitting. Second, we discuss the behavior of the distributed T1 in our sample.
4.4.1 Spin lattice relaxation curve of FeSe
0.88Figure 4-8 represents a nuclear spin-lattice relaxation curve for our FeSe0.88 sample at 16K. Note that M(t) means the nuclear magnetization as a function of time. The function of typical single exponent spin lattice relaxation curve is given by,
1 M t
M ∞ e
Note that the dashed line in the log plot of figure 4-8. It means if the curve is single exponential, the curve will be a straight line following the trace of dashed line. If the curve deviate the dashed line, it can’t be classified into the type of single exponential curve, which means the curve is follow a single exponential behavior. So we should fit the curve with another kind of curve fitting, such as the following stretched exponential curve fitting.
Compare our FeSe0.88 data with the Imai’s group’s FeSe0.99 and FeSe0.97 data, there were two different behaviors. For the Imai’s group’s FeSe0.99 and FeSe0.97 data, is single exponential, as to ours, FeSe0.88, is stretched exponential. The observed stretched exponential behavior means that the spin-lattice relaxation rate, T1, is distributed in our FeSe0.88 sample. This behavior may be caused by two reasons, anisotropy or disorder in FeSe0.88 . To figure out what the real reason causing distributed behavior in FeSe0.88, we note that the single exponential behavior, observed in the nearly stoichiometric FeSe polycrystalline samples, implies that there is only a nearly isotropic T1, although it has a two-dimensional layered structure. So a stretched exponential behavior, caused by the anisotropic T1, is then ruled out. So the reason causing distributed behavior in FeSe0.88 is due to the disorder induced by Se-vacancy.
[M( Figure 4 (t):nuclear m 4-8. 77Se n magnetizatio nuclear spi on]. Dashed in-lattice re d line is the elaxation cu single expo urve for F onential curv FeSe0.88 at rve. 16K
4.4
curv beh spin spin spin is cl FeS due Figu Not.2 Behavi
Figure 4 ve fitting. avior imply n-lattice rela n-lattice re n-lattice rela lose to 0.6. Se0.92 [5]. To to the disor ure 4-9. Str te that differior of dist
-9 is the str From figu ying that theaxation rate elaxation ra axation rate Similar beh o summary, rder induce retched expo rent Se sites
tributed T
retched exp ure 4-9, we e different S e (1/T1). W ate at hig e (1/T1) at l havior was we found t d by Se vac onent from s have differT
1(T)
in F
ponent (α) o e observed Se sites hav We find that gh tempera low tempera also report that there a cancy in FeS the stretche rent tempereSe
0.88 obtained fro d a temper ve the differ all the Se ature, wher ature, wher ted by Kote are different Se1-δ. ed exponent rature-depen om a stretch rature-depen ent tempera nuclear sit reas there e the stretch gawa’s rese temperaturtial curve fit ndent T1.
hed expone ndent expo ature-depen tes have sim
is distrib hed expone earch group re dependen itting [e-(t/T1) ntial onent ndent milar buted ent α p, for nt T1 )α].
4.4.3 1/T
1T in FeSe
1-δwith different Se deficiency
Figure 4-10 shows the relaxation rate curve, with different Se deficiency, from the stretched fit. Note that T1 value is not directly obtained from the stretched exponential curve fitting. The T1 value of the stretched exponential curve fitting is the most majority of T1 in the sample. In order to catch the intrinsic feature from the distributed T1, we calculated the average 1/T1, directly from the initial slope of the relaxation curve[8], instead of two-T1 fit. The equation of average 1/T1 in stretched exponent curve fitting is given by
〈1 T 〉 1 T ∞ P 1 T d 1 T ln10 initial slope of log 1 M t M ∞
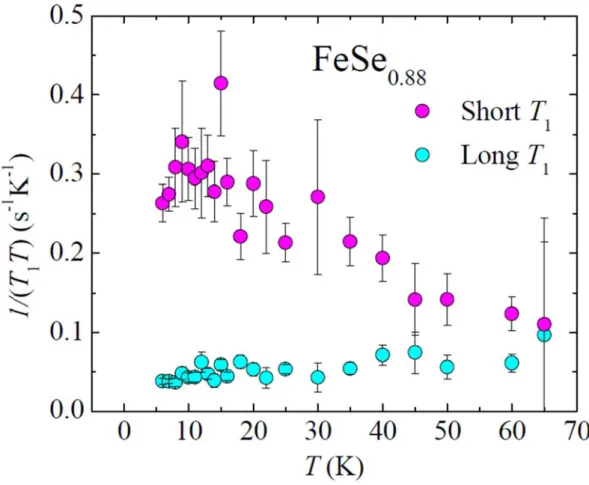
The pink circles are our 1/T1T curve. From this curve, we saw the turning point reflecting the Tc. The Korringa-type behavior (T1T=constant), for temperatures between superconducting temperature (Tc) and 50 K, in FeSe0.88 and FeSe0.92, is actually misleading because both 1/T1 values of FeSe0.88 and FeSe0.92 are obtained from the stretched exponential fit. These stretched data cannot reflect the real situation of the average behavior for 1/(T1T) because the stretched exponent is proved to be temperature dependent (see figure 4-9). Above 100 K, T1 is uniquely determined, and 1/(T1T) increases with increasing temperature. The behavior is common to some Fe-Based superconductors, and likely originated from the effect of the band structure in electron-doped system. The increasing 1/(T1T) with increasing temperature above 100K may be caused by pseudogap behavior in electron-doped system of Fe-Based superconductors.
and mag Figure 4 FeSe0.97 ar gnetic fluctu 4-10. Plot of re single-T1 uations in d f 77Se 1/(T1 1, where 1/( ifferent Se-T) as a func (T1Tc) decre -deficient Fe ction of tem eases with eSe1-δ. mperature. D . The pict
Data for FeS ture reflects
Se0.99 s the
4.4
FeS com The of s for f is M exp From whe The agre supe mea T1 c supe alth supe supe tem supe.4 1/T
1T b
Compare Se0.92 relaxa mponent disp e upward 1/( spin fluctuat fittng our T Masaki et onential fun m the two-ere our volu e short T1 is eement wit erconductin asurements. There is curve origin erconductiv hough the erconductiv erconductin mperature, lo erconductinby two-T
1 e with the ation curve plays an enh ( T1T), just tions to sup T1 data. Figu al.’s plottin nctions, resp M -T1 fitting w ume fraction s considered th that the ng volume a problem nally thoug vity. So the long T1 cu vity. One p ng electrons ong T1 cur ng electrons 1curve fit
stretched e es, using tw hanced 1/ T above Tc, h perconductiv ure 4-11b is ng of 1/( pectively. T M t ∝ Ae we obtained n A is 0.5 fo d as the con level of fraction in with the tw ght of non-s e two-T1 is urve of ou ossible reas s, conventi rve still hatting of Fe
eponential wo-T1 func T1 similar to has been convity in FeSe our plottin T1T) of Fe The function , 1 d the volum for FeSe0.88 ntributor to Se deficien n FeSe1-δ, o wo- T1 fittin superconduc s not a go ur plotting son is that ional and u as a turning
eSe
0.88&
fitting, Ma ction, and o the nearly nsiderd as e e [4]. We al g of 1/( T1T eSe0.92, fit n of two T1 f A e , me fraction and Masaki the superco ncy is prop obtained fro ng. In Masak cting part s ood fitting seems hav maybe the unconventio g point cauFeSe
0.92 asaki et al. found that stoichiome evidence for so used the T) of FeSe0.8 by two-T1 fitting is giv parameter i et al.’s is 0 onductivity. portional to om our AC ki et al’s pl still has a tu method for ving no tu ere are both onal, in Fe used by th . have fit t at the shor etric FeSe0.9 r the connec e two T1 me 88. Figure 4 1 and stretc ven by of short T1 0.6 for FeSe . This is a g o disorder C susceptib lotting, the turning poin or the FeSe urning poin h two kind eSe. So in he conventi their t T1 99 [6]. ction thod 4-11c ched 1(A), e0.92. good and bility long nt of e1-δ , nt of ds of low ionalFigu fittin indi tem plot ure 4-11b.M ng and two icating the mperature-ind tted [6]. Masaki et o-T1 fitting, e develop dependent. al. used d to their Fe ment of For compa different fitt eSe0.92. Note spin fluc arison, 1/T1 ting functio e that 1/T1S ctuations. 1T deduced ons, stretch ST increases In contras by fixing hed expone s below 10 st, 1/T1LT α = 0.6 is ntial 0 K, T is also
4.5
betw4.5
at 1 This broa Judg not Figu 60.9NMR Sp
We have ween differe.1
77Se NM
Figure 4 15 K, where s implies t adening is ging by the correlate w ure 4-12. 7 99 MHz.pectra of C
measured t ent Cu dopiMR spect
-12 shows t e the linew that Cu su dominated rapid incre with the rapid7Se NMR s
Cu-doped
the 77Se and ng level ofra of
Cu-the 77Se NM width increa ubstitution by magne ease in 77Se d suppressio spectra, in td (Fe
1-xCu
d 63Cu NMR (Fe1-xCux)S-doped (F
MR spectra ases rapidly induces a etic disorde NMR linew on of Tc by the normalu
x)Se
1-δR spectra an Se1-δ.
Fe
1-xCu
x)S
in the norm y upon Cu d magnetic r, rather th width, the d Cu doping. state of (Fe nd comparede
1-δmal state of doping and moment so han by stru isorder effe . e1-xCux)Se 1-d the 1-differe f (Fe1-xCux) d then satur o that the uctural diso ects may or -δ , at 15 K ence Se1-δ ates. line rder. may K and
4.5
spec the but cent tran (Fe1 stru line Figu K a The line line.2
63Cu N
Figure 4 ctra of (Fe1 content of C at Fe sites. From 63C tral peak o nsferred hyp 1-xCux)Se1-δ Figure 4 uctural disor ewidths both ure 4-13a& and 60.99 M e right (4-1 ewidth varia ewidth in TiFNMR spect
4-13a is the -xCux)Se1-δ, Cu doping Cu NMR s of spectra s perfine fiel . This data c 4-13b is a rder in TiFe h gradually &b. a is 63Cu MHz. Dashe 13b) is dif ation in the Fe1-xCox. [1tra of (Fe
e plot of 63C the 63Cu li suggesting spectra, we harpened a ld caused b can be exam different e1-xCox. Com growing big u NMR spe ed Line is th fferent dop e left (4-13a 12]e
1-xCu
x)Se
Cu NMR sp inewidth in that the ind e found tha at higher Cu by the cha mined the re case where mpare the tw gger, the me ectra, in the he reference ping in TiF a), the struce
1-δ pectra. Com n figure 4-13 duced mom at an impor u doping le ange in ele esistivity me e the grow wo different echanisms b e normal sta e field for t Fe1-xCox. U ctural disor mpare with 3 gradually ents are not rtant inform evel due to ectric densi easurement wing linewi t examples. behind are q ate of (Fe1-x he unshifte Unlike the rder effect c the 77Se N y decreases t at the Cu mation that o the weake ity of state t. idth caused . Although t quiet differe xCux)Se1-δ ,a ed 63Cu nucl reason cau causes diffe NMR with sites t the ened es in d by their ent. at 15 leus. using erent4.5.3 Comparison of
77Se and
63Cu NMR spectra of (Fe
1-xCu
x)Se
1-δWhy do 63Cu and 77Se linewidths behave so differently? Normally the NMR spectrum becomes wider and more asymmetric when the increase in doping level is begun [9, 10]. But here, the 63Cu linewidth can come from both the doping-induced magnetic shift distribution, and the powder pattern due to the anisotropic shifts and quadrupolar effects. The broad shoulders, on both sides of the central peak, are caused by the quadrupolar broadening. Because these broad shoulders stay nearly unchanged, unlike the central peak sharpening at higher Cu doping, the quadrupolar effects probably do not cause the narrowing of the central peak. Note that the centroid of the spectrum moves closer to the unshifted reference line at higher Cu doping, implying that the Cu nuclei do not much feel the hyperfine fields, from the neighboring Fe/Cu spins, at a higher doping levels. Since there is no direct chemical bonding between the Cu and Fe atoms, part of the 63Cu frequency shift at low Cu doping comes from the transferred hyperfine coupling, mediated by the conduction electrons. For higher Cu doping, we suspect that the metal-insulator transition reduces the number of conductions so that the transferred hyperfine coupling becomes weaker. Therefore, both the magnetic shift and linewidth decrease at higher Cu doping. This is different from the 77Se spectra, where there is direct wave-function overlap between the 4p and Fe 3d electrons so that the 77Se nucleus can always effectively probe the Fe spins, to show a broader linewidth at higher doping.
4.5
Figu shif freq incr mag that broa little Figu.4 Linewi
ure 4-14 is ft of 77Se NM quency shif reasing Cu gnetic disor t the linewid adening in t e effect on t ure 4-14. Lidth and f
the phase d MR spectra ft (pink ci doping lev rder induced dth (blue cir the Cu-dop the suppres Linewidth anfrequency
diagram of a. If we negl ircles) jum vel. This in d by Cu do rcles) is nea ed samples sion of Tc. nd frequency shift of (
Cu doping lecting the z mps suddenl nfers that t oping, inste arly unchang that show cy shift of th(Fe
1-xCu
x)
g level to th zero doping ly and the the line bro ad of struct ged with Cu different Tc he 77Se NMR)Se
1-δ he linewidth g point, we en slowly oadening is tural disord u doping lev c suggests th R spectra. h and freque can see thaincreases s dominated der. We can vel. Similar hat disorder ency at the with d by n see r line r has
4.5
Figu supe conn sam supp Figu line.5 Relatio
ure 4-15 is erconductin nection to t mples that pression of ure 4-15. S ewidth, as aon betwee
the Cu dop ng phase d the supercon show diffe Tc. uperconduc function ofen T
cand
ping level t diagram. W nducting tra erent Tc su cting phase f Cu dopingdisorder
to the supe We can see ansition. Sim uggests tha diagram of g, at 15 K.effect in
erconducting linewidth milar line b at disorder f the Cu-dop(Fe
1-xCu
x)
g transition has no ob roadening i has little ped FeSe. In)Se
1-δ n temperatur bviously d in the Cu-do effect on nset: 77Se N re, a direct oped the NMR4.6
Inde cont 1/(T out refe Figu (~751/T
1T o
Figure 4 eed, simila trast to the T1T) below due to the b erence 8. ure 4-16. T 5 kG). Noteof (Fe
1-xC
4-16 (blue ar uprising flat behavio Tc , expecte broad 1/T1 d The average e that a simiu
x)Se
1-δb
circles) giv behavior, a or in the non ed from the distribution (T1T)-1, of ilar uprisingby stretche
ves the ave at low tem n-supercond e opening o n. The theory 77Se in (Fe 1 g behavior d
ed expone
erage 1/(T1 mperature, i ducting FeS f the superc y of calcula 1-xCux)Se1-δ, due to spin fential fitti
1T) data fo s seen in Se0.97. Note conducting ating the ave, measured fluctuations
ing
or our FeSe our sample that the dro gap, is sme erage T1 is f at 60.99 MH s is observe e0.88. e, in op of eared from Hz d.
4.7 Conclusion & Summary
Combining the reduced superconducting volume fraction in the Se-deficient FeSe with the findings from the previous discussions, i.e., the different temperature-dependent 1/T1 at different Se sites and the reduced spin fluctuations at a larger δ, we infer that the Se-deficient FeSe has an inhomogeneous phase, where the superconductivity comes from regions with few or no Se vacancies. The Se-vacancy-free region has much stronger magnetic fluctuations than the Se-vacant region. When greater vacancy is introduced in FeSe, both the overall spin fluctuations and superconducting volume fraction will decrease. However, this picture cannot explain why the superconductivity disappears in FeSe0.97 [7]. Is this really due to the oxygen contamination in those Se-deficient samples so that the superconductivity is actually from FeSe1-δOy, instead of FeSe1-δ? An oxygen-free FeSe0.82 has been reported by Williams et al., with magnetic susceptibility clearly showing a superconducting diamagnetic response, if the background signal from the impurities is subtracted [3]. Therefore, we think it unlikely that occurrence of any oxygen contamination is the cause. While preparing this paper, we noticed that a different result was recently reported, where the superconductivity was claimed to exist in a narrow range of δ=0.03, i.e., FeSe0.974±0.005 [11]. These recent experiments, together with our own, indicate that the superconductivity emerges from the nearly stoichiometric FeSe. Figure 4-17 is the neutron diffraction data of different Se vacancy. From this, we know that the quantity of Se vacancy will only effect the composition phase content. Why do Imai et al. have a different result with M. K. Wu et al.? E. Pomjakushina says that Imai has an unnecessary quenching processing, which makes the structure is unstable. And this result an non-superconducting FeSe.
the curv sim Inte poss frac Se-d sign (Fe0 the Figure 4 As for C spin-lattice ves are plot
ilar average erestingly, C sesses a sp ction and T deficient s nificantly. 0.99Cu0.01)Se different va 4-17. Neutro Cu-doped (F relaxation tted in figur e (T1T)-1 be Cu substitut pin differen Tc rapidly samples, w The sim e0.85 and (Fe alues of x an on diffractio Fe1-xCux)Se1 curves for a re 4-16. Wi ehavior, wh tion does no nt from Fe2 decreases, where only milar supe e0.98Cu0.02)S nd δ. Recen on of differe 1-δ, stretched all Cu-dope ithin experim here the val
ot alter spin 2+. We note upon Cu y supercon erconductin Se0.88 could nt transport ent Se vacan d exponenti ed (Fe1-xCux mental erro lues increas n fluctuatio e that both doping. T nducting v ng volum be an effec experiment ncy of FeSe ial behavior x)Se1-δ. The or, all of our
sing at low n in FeSe0. h supercond his is diffe volume fra me fraction ct of compe ts, on (Fe1-x e1-x r is observe average (T r samples s wer tempera 88, though C ducting vol ferent from action red on found ensation, du xCux)Se1-δ, h ed in 1T)-1 show ture. Cu2+ lume the duces in ue to have
In summary, we conducted comprehensive studies of the 77Se NMR in the Se-deficient and Cu-substituted FeSe. By comparing our data with previous literatures, we infer that FeSe1-δ has inhomogeneous phases, where the superconductivity emerges from regions with little or no Se vacancy. As for the Tc suppression in (Fe1-xCux)Se1-δ, magnetic fluctuations are not directly relevant. We suspect that it is the electronic states changing by Cu substitution so that a metal-insulator transition arises and soon Tc is suppressed.
Ap
Pe
In t auto auto seve exp exp recy for o App Hom The con a m com Wid to te past PW cont just Inst sign corr instrppendix
ersonal
the days of omation. Ou omatic. As eral progra erimental erimental d ycling, etc. our NMR e paratus memade 5-A e 5-Axis D sists of a po motor drive mposed of 5 dth Modulat echnical dif t, so the PW WM is a we trol system two ports trument’s d nal to 24 d responding ruments, sux:
designs
graduate st ur ultimate a matter o ams and ap research a data acquisi The follow experiments Axis DC mo DC motor d ower modul IC, to cont LB1640N tion) techni fficulties, it WM techniqu ell-develope . LB1640N . By TTL digital inpu digital high program w uch as the nes of app
tudy, my pr goal is to of fact, we pparatus for and the e ition, liquid ing is the li . otor drive drive is com le and a mo trol our DC ICs, so it ca ique, we ca ’s hard to c ue emerges ed engineer N is an H-br signal, it c ut/output co h/low outpu written with eedle valve,paratus
rimary wor make all th already hav r my maste experiment d helium co ist of appara mputer-con otor control C motors. T an drive 5 D an even dec control the m and solves ring techno ridge circuit can move ontroller, U ut, we can h Labview. , variable caand pro
rk is dedica he NMR ex ve some ac er study. A al equipm ompression, atus and reltrolled by module. I u The motor c DC motors. cide the mot
motor’s driv this problem ology and w t IC, and we and stop r USB-6501, control ou The motor apacitors, v
ograms
ating to dev xperimental chievements All of them ment operat , helium ga lated progra our Labvie utilize SANY control mod By the bas tor’s rotatio ving voltage m successfu widely use e can direct ight away. which con ur motor d drive contr acuum Regs
velop labora l measurem s. I have m m are for N ation, such as recovery ams that I m ew program YO’s LB16 dule is a cir sic PWM (P onal speed. e directly in ully. Nowad ed in autom tly control i With Nati nverts the U drive throug rols lots of gulator, etc. atory ments made NMR h as and made m. It 640N, rcuit Pulse Due n the days, matic it by ional USB gh a f ourHel We recy volu The Nat inte
ium gas bag use a wate ycle system ume detecto en we contr ional Instru ernet). g volume de er level swit m is compo or. When th rol the inle ument’s La etector tch as the h sed of seve he gas bag et and outle abview prog helium gas eral parts. is full, the et of the ga gram on P bag volume One of the detector wi as bag. All C, and it c e detector. T em is the h
ill close the the operat controllable The helium helium gas e electric va tion is done e remotely m gas bag alve. e by (via
NQR The com and four tech deri (con used betw min kno How tune para whi coo coo prog R temperatu e temperatu mposed of th a linear m r temperatu hnique, whi ivative cont ntroller) wid d feedback ween a mea nimize the owledge of wever, for b ed accordin ameters dep ich can con
ling rate, an ling rate d grams. ure control ure control s hree parts, w motion stage ure sensor p ich can ac troller (PID dely used in controller. A asured proce error by a the under best perform ng to the n pend on the ntrol the NQ nd Lakesho determines system system of t which are a e. The temp ports and tw curately co D controller) n industrial A PID contr ess variable adjusting th rlying proc mance, the nature of t e specific sy QR probe’s re 336 cont the final te the nuclear a liquid nitro perature co wo heater ou ontrol the t ) is a gener l control sy roller calcul and a desir the process cess, PID c PID param the system ystem. The position. T trols the hea emperature quadrupole ogen Dewa ontroller is utput. Lake temperature ric control stems – a P lates an "err red setpoint. s control in controllers meters used – while t length of t The position ating rate. T . Both of e resonance r, a tempera Lakeshore shore 336 u e. A propo loop feedba PID is the m ror" value a . The contro nputs. In t are the b in the calcu he design the motion n of the pro The balance them have e experimen ature contro 336 contai utilizes the ortional inte ack mechan most comm as the differ oller attemp the absence best control ulation mus is generic, stage is 70 obe decides e of heating e correspon nt is oller, ning PID egral nism monly ence pts to e of llers. st be the cm, s the g and nding
Rem The desi can exp liqu Eva be u liqu 329 tem we DC rem motely contr e evaporativ igning a DC control it eriments. T uid continuo aporative co used to mak uid also falls 9, vacuum r mperature of can change motor, whi motely. rol Evapora ve cooling s C motor an t remotely. The vapor ab ously evapo ooling of or ke cryocool s, and cooli regulator, as f our NMR e the temper ich is contr ative cooling system is se nd a connec . Evaporati bove a reser orates as lo rdinary heliu ers. As the ing become s our pump experiment rature throu olled by the g system et up by Pr cting device ive cooling rvoir of cryo ong as the l um can coo temperatur s less effect ping rate co . With the t ugh changin e PC progra rofessor Ben e on the vac g is comm ogenic liqui liquid's vap ol to at least re decreases tive. We uti ontroller so temperature ng the vacuu am. So we n-Li Young cuum regul monly used id is pumpe por pressure t 1.2K. This s, the vapor ilize LJ-eng that we ca e controller um regulato can do all t g. What I d lator so tha d in cryog ed away, and e is signific s technique r pressure o gineering m an dominate Lakeshore or rotated by the experim did is t we genic d the cant. e can f the model e the 332, y the ments
Lab DC The of t reco Inst bview Progr motor cont e DC motor the motor. ord its pos trument’s La rams troller controller u The progra sition at t abview, a vi utilizes the am can mak the same t isual progra PWM techn ke the mot time. The amming lan nique, whic tor move fo program nguage. ch controls t orward and is written the rotary sp d backward with Nati peed and ional
Hew The A n netw of exp LC rate reso Inst wlett-Packar e HP 8752c network ana works, espe electrical s eriment, the circuit in th e of LC circu onance frequ trument’s La rd 8752C & network an alyzer is a ecially those signals kno e network a he NMR pr uit in the pr uency can b abview, a vi & 8712ET R nalyzer can an instrume e properties own as sc analyzer is robe is right robe. With a be any valu isual progra RF Network show the r ent used to s associated cattering p used to con t. I write a another tuni ue we want. amming lan analyzer esonance fr analyze th d with the r arameters nfirm that th program de ing and mat
The progra nguage. requency of he propertie reflection an (S-paramet he resonanc emonstratin tching progr am is written f the LC cir es of elect nd transmis ters). In N ce frequenc ng the reflec ram I wrote n with Nati rcuit. trical ssion NMR cy of ction e, the ional
CS4 The NM the mag coil field by Lab 4 Supercond e CS4 contr MR experime operation e gnetic and th l. The CS4 d. It’s conne the official bview, a visu ducting Mag roller is a p ent. The pro error. If we he power su controller c ected to the l command ual program gnet Power power supp ogram is ha e turn on th upply, it wil can safely tu computer w d list. The mming langu Supply ply controlli as several se the heater w ll cause dam une the pow with the GP
program is uage.
ing the app ecurity mec with an une mage to the wer supply t PIB interface s written w plied magne chanism pre equal curre supercondu to the desig e. All the op with Nation etic field of eventing it f ent between ucting magn gnated magn peration is d nal Instrume f the from n the netic netic done ent’s
Liqu Our mag prog mon is d Inst data heli uid helium r NMR lab gnetic Dewa gram so tha nitor LM50 done by th trument’s L a and plottin ium. level monit has two Li ar, Janis, an at I can read 0 is connec he official Labview, a v ng the liquid tor-LM500 iquid helium nd the other d the level o cted to the c command visual progr d helium le m level mo r is for the of liquid hel computer w d list. The ramming la evel showing onitor, one Liquid Heli lium remote ith RS232 i program anguage. It g the trend is for the s ium contain ely. The liqu interface. A is written has the fun of the consu
superconduc ner. I wrote uid helium l All the opera with Nati nction of sa uming of li cting e this level ation ional aving quid
Liqu The heli com statu Add or s visu uid helium e NMR exp ium gas wi mpress the g us. By app ditionally, it stops compr ual program compressor eriment con ill be recyc gaseous hel propriate pa t also has th ressing. The mming langu r, LHeP12 nsumes a la cled to the lium into li arameters, t he saving da e program i uage. arge amoun e recycling iquid state. the compre ata function is written w t of liquid h gas bag. T This progr essor will w n, and it can with Nationa helium, so t Then the c ram monito work in the n record the al Instrume the evapora compressor ors the mac e optimal w e time that s ent’s Labvie ating will chine way. starts ew, a
Tem The heat chan chan Lak spen can Just tem This lang mperature co e temperatu ter output. nnel, which nnels, we st keshore 336 nd less time also use th t like other mperature-tim s program guage. ontroller-La ure controll The progra h are the nec till need to 6 can be use e tuning you he manual m rs, the pro me diagram is written w akeshore 33 er, Lakesho am can cho cessary para choose the ed to autom ur controlle mode, whet ogram has m showing th with Nation 6 ore 336, is oose the con ameters for PID mode. matically col er and more ther manua the functio he trend of nal Instrume available ntrol input temperature The intelli llect PID pa time condu al PID mod on of savin the changin ent’s Labvi with four i channel an e. While sel gent auto-tu arameters, w ucting exper e or purely ng data an ng rate of th ew, a visua inputs and nd heater ou lecting the r uning featur which make riments. Bu y manual m nd drawing the tempera al programm two utput right re of es us ut we mode. the ture. ming