行政院國家科學委員會專題研究計畫 成果報告
胰島素抗阻、糖尿病與肥胖相關基因之研究
計畫類別: 個別型計畫 計畫編號: NSC91-3112-B-002-019- 執行期間: 91 年 05 月 01 日至 92 年 04 月 30 日 執行單位: 國立臺灣大學醫學院內科 計畫主持人: 莊立民 共同主持人: 唐存愷 報告類型: 完整報告 處理方式: 本計畫可公開查詢中 華 民 國 92 年 6 月 3 日
行政院國家科學委員會補助專題研究計畫 □ 成 果 報 告 □期中進度報告
(計畫名稱)
胰島素抗阻、糖尿病與肥胖相關基因之研究
Study on the genes related to insulin resistance, type 2 diabetes and obesity
計畫類別:■ 個別型計畫 □ 整合型計畫 計畫編號:NSC 91-3112-B-002-019 執行期間:91 年 5 月 1 日至 92 年 4 月 30 日 計畫主持人:莊立民 共同主持人: 計畫參與人員:楊偉勛、唐存凱 成果報告類型(依經費核定清單規定繳交):□精簡報告 ■完整報告 本成果報告包括以下應繳交之附件: □赴國外出差或研習心得報告一份 □赴大陸地區出差或研習心得報告一份 □出席國際學術會議心得報告及發表之論文各一份 □國際合作研究計畫國外研究報告書一份 處理方式:除產學合作研究計畫、提升產業技術及人才培育研究計畫、列管計畫 及下列情形者外,得立即公開查詢 □涉及專利或其他智慧財產權,□一年□二年後可公開查詢 執行單位:台大醫學院、內科 中 華 民 國 92 年 5 月 30 日
中文摘要 糖尿病是一種常見的新陳代謝失調,估計至少佔世界人口的 5%。在台灣糖尿病 的盛行率約為 4%,其中 95%以上之患者為第二型糖尿病;第二型糖尿病經常與 肥胖、高血壓、血脂不良症及動脈硬化症同時存在,據世界衛生組織估計,下 個十年 75%的醫療花費將用在非傳染性之慢性疾病上。這些異常含有第二型糖 尿病、肥胖、高血壓、血脂不良症、冠狀動脈疾病,以上全部統稱為代謝症候 群,今年我們計畫分析引發這些疾病的致病路徑主要缺陷,即胰島素阻抗性, 經過修正著重目標在: 在此提案第一年的具體的研究: 尋找候補基因之 SNPs,並確定其與胰島素阻抗性及相關臨床第二型糖尿病、肥 胖及冠狀動脈疾病之關係。 我們在臨床結合基因學之研究,顯示與 APM1 基因的 SNP 與胰島素阻抗性有關 連,並與 PPAR基因型產生交互作用,影響肥胖與胰島素阻抗性(APM1 與肥 胖關係之研究,已被 JMM 接受刊登,而 APM1 與 PPAR基因之交互作用, 也已被 Diabetologia 接受刊登)。 更重要的是,我們研究 APM1 基因之對偶基因之表達,和 SORBS1 基因在脂肪 組織的表達,與肥胖或胰島素阻抗性有密切之關連(前者在 JMM 中刊登,而後 者則在 Ob Res 刊登)。 經由本年的研究發現有更多的有興趣的基因標記,並與臨床複雜的疾病有關,如 代謝症候群。此經驗可提供未來大規模的基因型分析,得出更多的數據資料,以 達到對糖尿病與代謝症候群更深入之瞭解。
英文摘要
Type 2 diabetes is one of the most common metabolic disorders affecting at least 5% of the whole population in the world. In Taiwan, the prevalence of diabetes mellitus was about 4% and more than 95% of the cases were type 2 diabetes mellitus. Since type 2 diabetes is frequently associated with obesity, hypertension, dyslipidemia and atherosclerosis, it has been projected by the WHO that more than 75% of the health cost will be consumed for the non-communicable disease (NCD) in the next decade. The underlying cause of these abnormalities including type 2 diabetes, obesity, hypertension, dyslipidemia and coronary artery disease, collectively termed metabolic syndrome, is not well understood. However, it has been clearly shown that both environmental and genetic factors are important in the pathogenesis of metabolic syndrome.
In this year (of the originally proposed 3-year project), we planed to dissect pathogenic pathways leading to the major defect underlying the metabolic syndrome, i.e. insulin resistance. With the revision, we focus only on some the targets:
Specific research of this proposal in the first year granted:
Isolation of the SNPs of the candidate genes and confirm the association with insulin resistance and the related clinical disorders such as type 2 diabetes, obesity and coronary artery disease in Chinese population. We have confirmed by clinical association studies to show a positive correlation of SNP of the APM1 gene and its interaction with PPAR gene in subjects with obesity and insulin resistance (A study on APM1 locus with obesity and different allelic expressions in the adipose tissue has been accepted by JMM; A study on gene-to-gene interaction between APM1 and PPAR has been accepted by Diabetologia). More importantly, we showed the allele-specific expression of APM1 gene and expression of SORBS1 gene in the adipose tissue to correlate clinical obesity and insulin sensitivity (A study on tissue expression of SORBS1 gene correlated with clinical phenotype has been accepted by Ob Res; A study on APM1 locus with obesity and different allelic expressions in the adipose tissue has been accepted by JMM).
Currently, we have identified more interesting genetic markers that might be related to clinical complex disorder such as the metabolic syndrome. Future large-scale genotyping might yield more remarkable data via high throughput genome center.
keywords: metabolic syndrome, mRNA expression, SNP, APM1, SORBS1, PPAR
Progress Report Background.
Type 2 diabetes is a multifactorial disorder involving both genetic and environmental factors (7). Detailed studies reveal two interacting basic defects are established in pathophysiology for human type 2 diabetes, i.e., cell dysfunction (8,9), and insulin resistance (10-12). Understanding the mechanisms of insulin resistance and cell defect is the key to elucidating the pathogenesis of type 2 diabetes and obesity. However, the genetic susceptibility factors for this disorder remains to be identified, due to a limited success in gene finding for the multifactorial diseases in general (14,15).
From our and others’ observations, obesity is the major determinant for the development of type 2 diabetes (13). In addition to the environmental contribution to the development of obesity, obesity is now can also be considered as a genetic disease of adipose tissue (16). The molecular mechanisms of programming of adipocytes differentiation have been extensively studied and theses studies also provide a basic understanding of obesity in animals and humans (for review, see 17). It is therefore possible to isolate the genes involved in syndrome of obesity and diabetes from the understanding of adipocyte gene expression (18). Interestingly, the induction of adipocyte differentiation is associated with an increase in insulin sensitivity (19).
Aims of the study.
1. To isolate and characterize the genes related to insulin resistance, obesity and type 2 diabetes.
2. Study of the functions of the candidate genes relating to insulin resistance Literature review.
Current studies using differential display and other techniques to isolate genes differentially expressed during adipogenesis have advance our understanding of the genetic factors involved in obesity/type 2 diabetes. Others and we have isolated several of the candidate genes for obesity and type 2 diabetes that were isolated during adipocytes differentiation. Others and we have isolated several of the candidate genes for obesity and type 2 diabetes that were isolated during adipocytes differentiation. For examples, adipoQ and HMGIc have been found in our differential display study (Chuang, unpublished). These two genes have been also found by others and found to be important in obesity and type 2 diabetes (20-22). We have been able to show the association between genetic variants of the adiponectin, human
homologue of adipoQ, and subjects with obesity and coronary artery disease (Chuang, in submission). In addition, we have focused on a signaling molecule, SORBS1/CAP, in insulin signaling pathway. We have cloned the human gene for SORBS1, identified 14 SNP on this gene, and demonstrated a positive association of a variant, T228A, with a reduced risk to obesity and type 2 diabetes in our laboratory (23,24). Thus, isolating a candidate with differential expression during a disease pathway or the changes in insulin sensitivity might be a good way for gene hunting.
Study design and methods.
1. Differential display, subtraction cloning, and microarray to isolate the candidate genes that involve insulin signaling/insulin action and adipocytes differentiation. In the first year, we focused on 3 genes isolated from adipogenesis: i.e. PPAR, APM1, SORBS1.
2. SNP typing and association studies.
a. Nucleotide G/T polymorphism of APM1 gene. Total genomic DNA was purified from peripheral blood leukocytes using a DNA extraction kit (Puregene, Minneapolis, MN). Exon 2 of human adiponectin gene was amplified using primers, 5’-TAG AAG TAG ACT CTG CTG AGA TG-3’ and 5’-CTC CCT GTG TCT AGG CCT TAG–3’, with the annealing temperatures at 68 to 60oC stepping down 2oC for every 5 cycles. The amplified DNA was digested with BspHI enzyme (New England BioLabs, Inc., Beverly, MA) prior to electrophoresis on a 2% agarose gel. The resulting fragment of PCR was 422 base pairs (bp). Because the T94G substitution abolished a BspHI restriction site, two fragments of 265 and 157 bp after digestion indicate the presence of T allele.
b. Pro12Ala polymorphism of the PPAR2 gene. Genotyping was performed on genomic DNA. A 270 base-pair (bp) region encompassing the site of the Pro12Ala polymorphism in the PPAR2 gene was detected by PCR-based restriction fragment length polymorphism (PCR/RFLP) analysis. PCR amplification was performed using upstream primer (5’ GCC AAT TCA AGC CCA GTC 3’) and mutagenic downstream primer (5’ GAT ATG TTT GCA GAC AGT GTA TCA GTG AAG GAA TCG CTT TCC G 3’). The mutagenic primer introduces a Bst UI restriction site only when the CG substitution at nucleotide 34 is present. PCR conditions were: denaturation at 94 C for 5 minutes, followed by 30 cycles of denaturation at 94 C for 30
seconds, annealing at 65 C for 45 seconds, and extension at 72 C for 1 minute with a final extension at 72 C for 10 minutes.
3. Tissue mRNA expression studies.
a. Quantitation of relative mRNA levels of G and T alleles of the APM1 gene. The adipose tissues were extracted for RNA by Trizol reagent and 1 g of the total RNA was reverse transcribed into cDNA following manufacturer’s recommendation (Life technologies, Rockville, MD). PCR with primers: 5’-ATG CTG TTG CTG GGA GCT GT-3’ and 5’-CCA TCC AAC CTG TGC AGG C-3’) was performed with an initial denaturation at 95oC for 10 min., followed by denaturing at 95oC for 10 sec, annealing at 60oC for 1 min for a total of 31-37 cycles; then by a final extension at 72oC for 10 min. The PCR productswere digested with SmaI followed by electrophoresis on 2% agarose gels stained with ethidium bromide. Because the T→G change creates a SmaI site, the uncut 134-bp band was the T allele, whereas the presence of 79- and 55-bp bands was indicative of the G allele. The band intensity was determined by densitometric analyses (1-D Gel Analysis Software, One–Dscan, Scanalytics Inc., Fairfax, VA). Because the T/G alleles were amplified in the same reaction, and the relative levels between them were used in the analysis, a control gene such as -actin or GAPDH in the ordinary quantitative PCR was not required.
b. Quantitation of mRNA of SOBBS1 by real-time PCR. Two µl of diluted cDNA was added to a 12.5 l 2x SYBR Green PCR Master Mix (Perkin-Elmer Applied Biosystems, Foster City, CA, USA), and variable amounts of the respective primers for the human SORBS1 and β-actin, and water to a final volume of 25µl. The primers were: SORBS1-F493: 5’-TAG CCT TTC AGA TCC TGT CTC AGA-3’, SORBS1-R602: 5’-CGC CTA CTG TCA TCC TTT GCT-3’, -actin-F: 5’-CCT CAT GAA GAT CCT CAC CGA GC-3’ and -actin-R: 5’-GCC AAT GGT GAT GAC CTG GC-3’, The PCR conditions were: 10 minutes at 95℃ and 40 cycles of 15 seconds at 95℃ plus 1 minute at 60℃. Briefly, the fluorescent signal from each PCR reaction is collected as the peak-normalized values plotted versus the cycle numbers. Reactions are characterized by comparing the threshold cycle (Ct) values. The Ct is a unit-less value defined as the fractional cycle number at which the normalized sample fluorescence signal passes a fixed threshold above baseline, when it is always located within the linear phase of amplification. Samples with a high starting copy number of cDNA show an increase in fluorescence earlier in the PCR process, therefore resulting in a low Ct number. The comparative Ct method, which eliminates the need for
standard curves, was used. The Ct number of β-actin minus that of SORBS1 (△Ct) represents as a log2 transform of the SORBS1 mRNA expression
corrected with β-actin mRNA expression.
4. Cloning of human adiponectin gene and transfection of 3T3-L1.
A PCR reaction using human adipose tissue cDNA as template and primers (5’-ATG CTG TTG CTG GGA GCT GT-3’ and 5’-TCA GTT GGT GTC ATG GTA GAG-3’) was performed to generate the coding sequences of human adiponectin gene. The PCR product was cloned into pGEM-Teasy (Promega, Madison, WI), subsequently subcloned into the EcoRI site of pCDNA3.1+ (Invitrogen BV, Gronigen, The Netherlands) in either sense or anti-sense orientation driven by a CMV promoter. Two g of each plasmid was transfected into 3T3-L1 cells by lipofectamine method (Life Technologies, Rockville, MD). Transfected cells were selected 2 days after transfection in a medium containing 500 g/mL G418 for two weeks, thereafter maintained in 200 g/mL G418 as pools. Each pool had at least 200 colonies from each stable transfection. Because the differentiated 3T3-L1 adipocytes are quite heterogeneous in phenotypes, the experimental results from a few selected clones could be misleading. Therefore we decided to use the pools from a large number of colonies to avoid the bias from selection.
5. Glucose transport assays.
3T3-L1 cells stably transfected with the plasmids containing vector-alone, sense, or anti-sense of adiponectin gene were induced to differentiation. Glucose transport assayed by the uptake of 2-deoxy-D-[3H]-glucose, was performed in triplicate as described in the differentiated adipocytes after 24-hour incubation in serum-free medium. The count of uptake in the presence of 10 M cytochalasin-B was used as the background, therefore subtracted from all the raw values for subsequent analysis. A final insulin concentration of 100 nM was used to stimulate glucose uptake. The data on basal and insulin–stimulated glucose uptake for the cells with sense or anti-sense adiponectin gene were adjusted using the basal glucose uptake of the cells harboring vector-alone as 100%.
Results and Discussion.
a. T/G polymorphism of the APM1 gene is correlated with BMI. We found that BMI were inversely correlated with the dose of G allele (p=0.023, = -0.15). Multivariate linear regression analyses showed that the adiponectin genotypes were significantly related to BMI (p=0.022, =-0.05+0.02), while adjusting for age and gender. The dose of the G allele was associated with a reduction of approximately 1.12 kg/m2 in BMI. (See appendix 1).
b. Interaction of the T/G polymorphism of the APM1 gene with PPAR Pro12Ala polymorphism is correlated with insulin sensitivity. We found that the T allele of adiponectin gene was associated with a higher insulin level at 1-hour (Ins60) in oral glucose tolerance tests (OGTT) utilizing sib pairs discordant for the adiponectin genotypes; and with a higher Ins60 and higher area under curve of insulin (AUCi) in OGTT utilizing all subjects in a mixed model that corrected for family effects. Significant interactions between adiponectin and PPAR2 genotypes were found in fasting insulin levels (Ins0), insulin levels at 2-hour (Ins120) in OGTT and insulin resistance index (HOMAIR). The subjects
carrying the adiponectin G allele and the PPAR2 Ala12 allele appeared to be more insulin sensitive. Our results showed that adiponectin is a genetic factor associated with insulin sensitivity. Interactions with PPAR2 genotypes significantly modified this association. (See appendix 2).
c. Differential expression of the T- or G- alleles of the APM1 Gene might explain the biological consequence of the silent SNP. The T94G polymorphism in exon 2 of the human adiponectin gene is a synonymous mutation (GGT→GGG, Gly→Gly), which has no biological effects on its own. It is plausible that the polymorphism is in linkage disequilibrium with some other functional genetic alterations. Omental adipose tissue from 21 subjects was assayed by semi-quantitative PCR (Fig. 1A). The mean level of G allele was significantly higher than that of T allele (p<10-10, Fig. 1B). We concluded that the biological effects of the T94G polymorphism might be at least in part attributable to the difference in allele-specific expression levels. (See appendix 1).
d. Adipose tissue mRNA expression of the SORBS1 correlates with clinical obesity. The relative SORBS1 mRNA levels from the omental depots correlated with BMI (=-0.41, p=0.0008) and total cholesterol (=-0.30, p=0.017). With adjustment for age, only the correlation with BMI remained significant (=-0.30, p=0.017). Using multivariate linear regression analysis, the relative SORBS1 mRNA levels from the omental depots were only related to BMI significantly (=-0.20+0.09, p=0.031), but not to the other variables. From the linear regression model, every 5 kg/m2 change in BMI would be associated with approximately 2-fold difference (=25x-0.2) in the omental SORBS1 mRNA levels. (See appendix 3).
In this year’s approach, we demonstrated the possibility of finding genes, from the differentially expressed genes during a pathway of adipogenesis, which are involved in pathogenesis of clinical disorders such as obesity, type 2 diabetes and insulin resistance. This would provide us a better understanding of pathogenesis of insulin
sensitivity and the clinical related diseases.
Papers published:
1. W-S Yang, P-L Tsou, W-J Lee, D-L Tseng, C-L Chen, C-CPeng, K-C Lee, M-J Chen, C-J Huang, T-Y Tai, LM Chuang (2003) Allele-specific Differential Expression of a Common Adiponectin Gene Polymorphism Related to Obesity. JMM (in press)
2. WS Yang, CA Hsiung, LT Ho, YT Chen, CT He, JD Curb, J Grove, T Quertermous,YDI Chen, SS Kuo, LM Chuang, for the SAPPHIRe Study Group (2003) Genetic Epistasis of Adiponectin and PPARγ2 Genotypes in Modulation of Insulin Sensitivity: a Family-based Association Study. Diabetologia (in press). 3. W-S Yang, W-J Lee, K-C Huang, K-C Lee, C-L Chao, C-L Chen, T-Y Tai, LM
Chuang (2003) mRNA Levels of the Insulin-Signaling Molecule SORBS1 in the Adipose Depots of Nondiabetic Women. Ob Res 11:586-90.
Self evaluation. Based on the first year’s experience, we demonstrated the feasibility of finding genes from the differentially expressed genes during a pathway, which is involved in pathogenesis of clinical disorders for a complex disorder. This would provide us a ground base for a plan in the next two years for a larger set of the genes that are isolated during adipogenesis for better understanding of the pathogenetic mechanism of insulin resistance and the related clinical disorders. In addition, we have 3 papers accepted for publications in the prestigious journals.
附件 1
Journal of Molecular Medicine © Springer-Verlag 2003 10.1007/s00109-002-0409-4
Original Article
Allele-specific differential expression of a
common adiponectin gene polymorphism
related to obesity
Wei-Shiung Yang1, 3, Pei-Ling Tsou2, Wei-Jei Lee5, Da-Lun Tseng3, Chi-Ling Chen4, Chi-Chung Peng1, Kuan-Ching Lee1, Mei-Ju Chen1, Chang-Jen Huang6,
Tong-Yuan Tai1 and Lee-Ming Chuang1, 3
(1) Division of Endocrinology and Metabolism, Departments of Internal Medicine, National Taiwan University Hospital, 7 Chung-Shan South Road, Taipei, Taiwan (2) Department of Clinical Pathology, National Taiwan University Hospital, 7
Chung-Shan South Road, Taipei, Taiwan
(3) Graduate Institute of Clinical Medicine, National Taiwan University Medical College, Taipei, Taiwan
(4) Institute of Epidemiology, National Taiwan University, Taipei, Taiwan (5) Department of Surgery, En-Chu-Kong Hospital, Taipei Hsien, Taiwan (6) Institute of Biological Chemistry, Academia Sinica, Taipei, Taiwan
Lee-Ming Chuang
Email: [email protected] Phone: +886-2-23123456 ext 5038 Fax: +886-2-23938859
Received: 19 December 2002 Accepted: 28 March 2003 Published online: 16 May 2003
WEI-SHIUNG YANG
received his M.D. degree from the National Taiwan University College of Medicine, Taipei, Taiwan, and his Ph.D. degree in genetics from the University of Washington, Seattle, USA. He is presently Assistant Professor at the National Taiwan University Graduate Institute of Clinical Medicine. His research interests are the clinical, genetic, and molecular aspects of the human metabolic syndrome.
LEE-MING CHUANG
received his M.D. and Ph.D. degrees from the National Taiwan University College of Medicine, Taipei, Taiwan. He has served as research fellow at the Joslin Diabetes Center and as
research fellow in medicine, Harvard Medical School. He continued his clinical service and basic research and became Professor of Medicine, National Taiwan University College of Medicine. His present research interests include the molecular genetics of diabetes mellitus and the molecular mechanisms of insulin action.
Abstract Adiponectin gene polymorphisms have recently been reported to be associated with obesity, insulin sensitivity, and the risk of type 2 diabetes. We examined a T94G polymorphism of the adiponectin gene in 245 ostensibly normal nondiabetic subjects. The G allele frequency was lower among subjects with higher BMI (≧27) than in those with lower BMI. BMI was inversely correlated with the dose of G allele. Multivariate linear regression analyses showed that the adiponectin genotypes were significantly related to BMI after adjusting for age and gender. The dose of the G allele was associated with a reduction of approximately 1.12 kg/m2 in BMI. We further found that the relative mRNA levels of G allele were consistently
higher than those of T allele in the omental adipose tissue from 21 heterozygous subjects. Finally, we observed that the expression levels of adiponectin affected insulin-stimulated glucose uptake in differentiated 3T3-L1 adipocytes. In conclusion, the allele-specific differential expression of this common polymorphism could be responsible for its biological effects observed in this and the other studies. Keywords Obesity - Insulin resistance - Adiponectin - Polymorphism - mRNA Abbreviations
BMI Body mass index
SNP Single nucleotide polymorphism
Introduction
Adipose tissue secretes many adipocytokines to modulate a wide array of biological functions [1]. Along with the well-known examples, such as leptin and resistin [2, 3], a relatively novel adipocytokine, adiponectin has been identified in mouse (adipoQ or ACRP30) [4, 5] as well as in human (apM1 or GBP-28) [6, 7]. Recombinant
adiponectin proteins were recently shown to decrease tumor necrosis factor α induced monocyte adhesion, nuclear transcription factor κB signaling, and the expression of adhesion molecules in endothelial cells in vitro [8, 9, 10]. They also attenuated cholesterol ester accumulation and the expression of class A scavenger receptor in human monocyte-derived macrophages [11]. Lower plasma adiponectin levels are reported in patients with coronary heart disease [8]. Furthermore,
immunoreactive adiponectin is detectable in the walls of catheter-injured vessels but not in the intact vascular walls [11, 12]. Taken together these reports indicate that adiponectin could be a protective adipocytokine against atherosclerosis.
A longitudinal observation of rhesus monkeys found a progressive decline in adiponectin paralleled the decrease in insulin sensitivity during the development of diabetes [13]. In mice injection of the recombinant adiponectin decreased plasma glucose and fatty acid levels and improved insulin sensitivity [14, 15, 16]. Long-term injection of adiponectin in mice led to significant weight reduction [14].
An inverse correlation between plasma adiponectin levels and body mass index (BMI), fasting insulin, and glucose and triglyceride levels but a positive relationship with
high-density lipoprotein cholesterol and measurement of insulin sensitivity in clamp studies has been reported [17, 18, 19]. These findings suggest a role of adiponectin in the pathophysiology of insulin resistance syndrome.
Genetic variations in the human adiponectin gene have recently been reported to be associated with the risk of obesity, insulin resistance, type 2 diabetes, and high levels of low-density lipoprotein cholesterol [20, 21, 22, 23, 24, 25]. In contrast, others have found no association with obesity or type 2 diabetes [25, 26, 27]. Almost all of the studies used a T/G polymorphism in the exon 2 of the human adiponectin gene as the sole genetic marker. One study performed extensive SNP genotyping, ending up with 14 single nucleotide polymorphisms (SNPs) across the whole gene [20]. However, only the T/G polymorphism in exon 2 along with an SNP276 was strongly associated with the risk of type 2 diabetes [21]. Since the T/G polymorphism at exon 2 is a synonymous mutation (GGT→GGG, Gly15Gly) and SNP276 is in intron 2, the exact molecular mechanisms responsible for the biological effects of these variations are not known at present. On the other hand, it was recently reported that SNPs in the adiponectin promoter region are associated with the risk of type 2 diabetes in the French population [24].
In this study we surveyed the frequency of the T94G polymorphism in the exon 2 among 245 ostensibly normal nondiabetic subjects with a wide range of BMI. We also estimated the relative mRNA levels of T/G alleles in the adipose tissue of
heterozygous subjects. Moreover, we measured insulin-stimulated glucose uptake in 3T3-L1 adipocytes stably transfected with either sense or antisense gene of
adiponectin. Our data suggest that adiponectin may be a genetic contributor to body weight and the risk of obesity. The allele-specific differential expression of
adiponectin is at least one of the causes responsible for the biological effects associated with this polymorphism.
Materials and methods
Subjects
We recruited 245 ostensibly normal nondiabetic subjects (WHO criteria) aged 30 years or over and with a BMI less than 45 (Table 1) during a routine health examination at National Taiwan University Hospital (NTUH). Adipose tissue
specimens were obtained from 10 severely obese heterozygous subjects (seven women, three men; aged 32.2±9.6 years; BMI 41.76±4.00) during gastric partition surgery [28] and from 11 lean heterozygous women (age 48.4±4.8 years; BMI
21.56±2.22) during uterine myomectomy. BMI of at lease 27.0 was defined as obesity according to the guideline for obesity management issued by the Ministry of Health of Taiwan. Informed consent was obtained. The study was approved by the Medical Ethics Committee of National Taiwan University Hospital.
Table 1. Characteristics of 245 ostensibly normal nondiabetic subjects in this study Age (years) 47.7±10.9
Body mass index 26.87±6.59 Gender: F/M 124/121 Hypertension 76 (31%) Hyperlipidemia 47 (19%) Diabetes mellitus 0 (0%)
Laboratory and phenotypic characterization of the
subjects
A 75 g oral glucose tolerance test was given to all subjects in health examination. Determination of the concentrations of plasma glucose, total cholesterol, triglyceride, and serum insulin levels and the estimation of insulin resistance index and beta cell function by homeostasis model assessment (HOMA) were carried out as previously reported [28].
Extraction of genomic DNA and genotyping
Total genomic DNA was purified from peripheral blood leukocytes using a DNA extraction kit (Puregene, Minneapolis, Minn., USA). Exon 2 of the human adiponectin gene was amplified using primers, 5
-TAGAAGTAGACTCTGCTGAGATG-3 and 5
-CTCCCTGTGTCTAGGCCTTAG-3 , with the annealing temperatures at 68–60°C stepping down 2°C for every five cycles. The amplified DNA was digested with BspHI enzyme (New England BioLabs, Beverly, Mass., USA) prior to electrophoresis on a 2% agarose gel. The resulting fragment of PCR was 422 bp. Because the T94G substitution abolished a BspHI restriction site, two fragments of 265 and 157 bp after
digestion indicate the presence of T allele.
RNA extraction and quantitation of relative mRNA
levels of G and T alleles
The adipose tissues were extracted for RNA by Trizol reagent and 1 g of the total RNA was reverse transcribed into cDNA following manufacturer's recommendation (Life Technologies, Rockville, Md., USA). PCR (primers: 5
-ATGCTGTTGCTGGGAGCTGT-3 and 5 -CCATCCAACCTGTGCAGGC-3 ) was performed with an initial denaturation at 95°C for 10 min, followed by denaturing at 95°C for 10 s, annealing at 60°C for 1 min for a total of 31–37 cycles, then by a final extension at 72°C for 10 min. The amplification of 33 cycles was chosen because the amount of PCR product was located within the linear range of amplification (data not shown). The PCR products were digested with SmaI followed by electrophoresis on 2% agarose gels stained with ethidium bromide. Because the T→G change creates a SmaI site, the uncut 134-bp band was the T allele, whereas the presence of 79- and 55-bp bands was indicative of the G allele. The band intensity was determined by densitometric analyses (1-D Gel Analysis Software, One-Dscan, Scanalytics, Fairfax, Va., USA). Because the T/G alleles were amplified in the same reaction, and the relative levels between them were used in the analysis, a control gene such asβ-actin or GAPDH in the ordinary quantitative PCR was not required.
Cloning of human adiponectin gene and transfection
of 3T3-L1
A PCR reaction using human adipose tissue cDNA as template and primers (5 -ATG CTG TTG CTG GGA GCT GT-3 and 5 -TCA GTT GGT GTC ATG GTA GAG-3 ) was performed to generate the coding sequences of human adiponectin gene. The PCR product was cloned into pGEM-Teasy (Promega, Madison, Wis., USA), subsequently subcloned into the EcoRI site of pCDNA3.1+ (Invitrogen, Groningen, The Netherlands) in either sense or antisense orientation driven by a cytomegalovirus promoter. Of each plasmid 2 µg was transfected into 3T3-L1 cells by lipofectamine method (Life Technologies). Transfected cells were selected 2 days after transfection in a medium containing 500 µg/ml G418 for 2 weeks, thereafter maintained in 200 µg/ml G418 as pools. Each pool had at least 200 colonies from each stable
transfection. Because the differentiated 3T3-L1 adipocytes are quite heterogeneous in phenotypes, the experimental results from a few selected clones could be misleading. Therefore we decided to use the pools from a large number of colonies to avoid the bias from selection.
Generation of antibody against adiponectin and
western blot analysis
A polyclonal antibody against peptide residues 15–29 (GHDQETTTQGPGVLL) of adiponectin was produced in rabbits. Crude cellular extracts of stably transfected cells were resolved by sodium dodecyl sulfate polyacrylamide gel electrophoresis followed by western blot analyses with the antiadiponectin antibody. Mouse β-actin
monoclonal antibody (Chemicon International, Calif., USA) was used as a standard control antibody. The protein of interest was detected by enhanced
chemiluminescence (Amersham Pharmacia, Piscataway, N.J., USA).
Glucose transport assays
3T3-L1 cells stably transfected with the plasmids containing vector-alone, sense, or antisense of adiponectin gene were induced to differentiation as previously described [29]. Glucose transport assayed by the uptake of 2-deoxy-D-[3H]glucose, was
performed in triplicate as described in the differentiated adipocytes after 24-h
incubation in serum-free medium [29]. The count of uptake in the presence of 10 µM cytochalasin-B was used as the background, therefore subtracted from all the raw values for subsequent analysis. A final insulin concentration of 100 nM was used to stimulate glucose uptake. The data on basal and insulin-stimulated glucose uptake for the cells with sense or antisense adiponectin gene were adjusted using the basal glucose uptake of the cells harboring vector-alone as 100%.
Statistical analyses
Data are presented as mean ±SD. Statistical analyses by analysis of variance, χ2 tests, Mann-Whitney rank sum test, and univariate and multivariate linear regression analyses were performed by using the PC version of the Statistical Analysis System (SAS, 6.12 edition, SAS Institute, Cary, N.C., USA) where appropriate. Logistic regression analyses were performed with Stata (College Station, Tex., USA). The
original data were log transformed before used for statistical analyses. A P value less than 0.05 was considered significant statistically.
Results
We sequenced the protein-coding regions in exons 2 and 3 of the human adiponectin gene using the genomic DNA from 20 unrelated randomly selected Taiwanese subjects. Only one T/G polymorphism at nucleotide 94 in exon 2 was identified. Although it does not alter the amino acid (Gly15Gly), it seemed to be quite common in our population and therefore could be useful as a marker for genetic association studies. We genotyped 245 ostensibly normal nondiabetic subjects. The frequencies of T and G alleles were 0.637 and 0.363, respectively. Comparison of selected
characteristics of these subjects categorized by genotypes revealed that only the BMI differed between them, with a borderline significance (Table 2). Further, we found that only BMI was inversely correlated with the dose of G allele (P=0.023, γ=–0.15). Multivariate linear regression analyses showed that the adiponectin genotypes were significantly related to BMI (P=0.022, β=–0.05±0.02), while adjusting for age and gender. The dose of the G allele was associated with a reduction of approximately 1.12 in BMI.
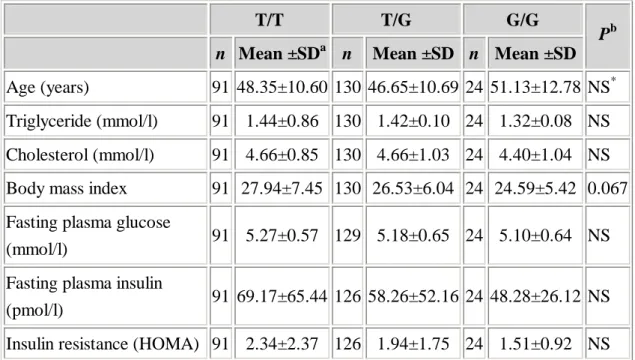
Table 2. Means ±SD of selected characteristics among 245 normal subjects by adiponectin genotypes (HOMA homeostasis model assessment)
T/T T/G G/G
n Mean ±SDa n Mean ±SD n Mean ±SD Pb
Age (years) 91 48.35±10.60 130 46.65±10.69 24 51.13±12.78 NS* Triglyceride (mmol/l) 91 1.44±0.86 130 1.42±0.10 24 1.32±0.08 NS Cholesterol (mmol/l) 91 4.66±0.85 130 4.66±1.03 24 4.40±1.04 NS Body mass index 91 27.94±7.45 130 26.53±6.04 24 24.59±5.42 0.067 Fasting plasma glucose
(mmol/l) 91 5.27±0.57 129 5.18±0.65 24 5.10±0.64 NS Fasting plasma insulin
(pmol/l) 91 69.17±65.44 126 58.26±52.16 24 48.28±26.12 NS Insulin resistance (HOMA) 91 2.34±2.37 126 1.94±1.75 24 1.51±0.92 NS
a
The original mean ±SD is presented without transformation
b
Analysis of variance after log transformation
*
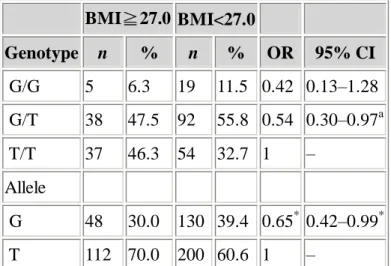
To further illustrate the effect of the adiponectin genotypes on BMI, BMI values of 27 or higher (based on the guideline issued by the Ministry of Health of Taiwan) was used to categorize subjects (Table 3). Significantly lower frequency of G allele was found in the higher BMI group (P=0.043). The odds ratio of higher BMI for the G allele relative to the T allele was 0.65. In multivariate logistic regression analyses the odds ratio of higher BMI for the subjects carrying G/T genotype relative to the subjects carrying T/T genotype was 0.54, adjusting for age and gender (P=0.028 for linear trend, Table 3). Using 30 as the cutoff point instead of 27 produced similar results. The G allele frequency in subjects with BMI of 30 or higher was less than that with BMI less than 30 (28% vs. 39%; P=0.044, χ2). The odds ratio for obesity for G/T genotype relative to T/T genotype was 0.48 (95% CI 0.24–0.95, P for linear trend=0.019) with adjustment for age and gender in logistic regression. Therefore the G allele of the adiponectin gene may be associated with lower BMI and the reduced risk to obesity, defined by BMI value of either 27 or more or one of 30 or more. Table 3. Adiponectin genotype and allele frequencies according to BMI of the total among 245 normal subjects and odds ratios (OR) of obesity by adiponectin genotypes and alleles BMI≧27.0 BMI<27.0 Genotype n % n % OR 95% CI G/G 5 6.3 19 11.5 0.42 0.13–1.28 G/T 38 47.5 92 55.8 0.54 0.30–0.97a T/T 37 46.3 54 32.7 1 – Allele G 48 30.0 130 39.4 0.65* 0.42–0.99* T 112 70.0 200 60.6 1 – a
Odds ratios after adjusting for age and gender and treating BMI≧27.0 as 1 and BMI<27 as 0.
P for trend=0.028 for genotypes using T/T as reference in multiple logistic regression model
*χ2
, P=0.043
The T94G polymorphism in exon 2 of the human adiponectin gene is a synonymous mutation (GGT→GGG, Gly→Gly), which has no biological effects on its own. It is plausible that the polymorphism is in linkage disequilibrium with some other
functional genetic alterations, resulting in the difference in mRNA expression levels of the T/G alleles. Therefore we assayed the relative T/G allele-specific expression within the same heterozygous individuals. The relative mRNA levels of T/G alleles should faithfully reflect the effects caused by the genomic changes linked with the T94G polymorphism, since both alleles were in exactly the same "environmental"
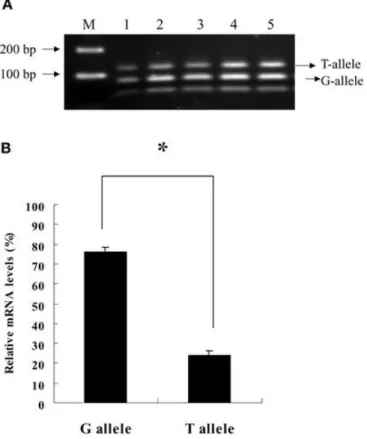
conditions. Omental adipose tissue from 21 subjects was assayed by semiquantitative PCR (Fig. 1A). The mean level of G allele was significantly higher than that of T allele (P<10–10, Fig. 1B). We conclude that the biological effects of the T94G polymorphism might be at least in part attributable to the difference in allele-specific expression levels.
Fig. 1. The allele-specific mRNA expression of adiponectin gene in the omental adipose tissue from 21 subjects with heterozygous T/G genotype assayed by PCR. A A representative agarose gel showing the PCR products from five subjects (lanes 1–5) at the 33rd cycle digested with SmaI; M 100-bp marker; T allele 134 bp; G allele 79 and 55 bp; The higher intensity of the G allele bands relative to that of the T allele bands indicates higher expression levels. B The relative mRNA levels of adiponectin G and T alleles in the omental adipose tissue from 21 heterozygous subjects estimated from the assays shown in A. In each individual the total intensity of G/T alleles
calculated from densitometric analyses was set to 100% to adjust the relative amount of G/T alleles. Bars means ±SEM of the data; *P<1×10⁻¹⁰
We then examined whether the difference in adiponectin gene expression has a direct biological effect on insulin sensitivity in adipocytes themselves. The plasmids
containing sense, antisense, or no adiponectin gene were stably introduced into 3T3-L1 cells. Pools of more than 200 colonies of the stable transfectants were differentiated into adipocytes and assayed for glucose uptake. The basal glucose
uptake of the sense-expressing pools was increased by 40%, whereas the basal
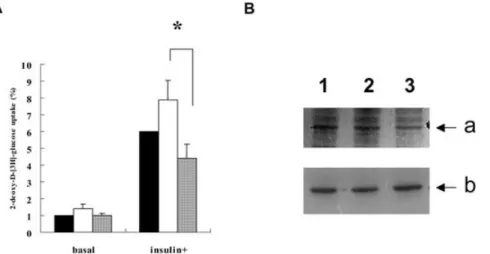
glucose uptake from the pools expressing antisense was exactly the same as that from the pools with vector-alone. However, they did not differ statistically (Fig. 2A). Insulin-stimulated glucose uptake in the pools with vector alone by an average of sixfold. The insulin-stimulated glucose uptake in the pools expressing sense gene was 135% of that from the insulin-stimulated vector alone. In contrast, the
insulin-stimulated glucose uptake in the pools expressing antisense gene was
decreased to 75% of that from the insulin-stimulated vector-alone. The difference in mean insulin-stimulated glucose uptake between the sense- and antisense-expressing pools was significant (P=0.035, Fig. 2A). The difference in adiponectin gene
expression in the differentiated 3T3-L1 adipocytes (Fig. 2B) might be the cause of the difference in insulin-stimulated glucose uptake.
Fig. 2. A The basal and insulin-stimulated glucose uptake and adiponectin protein levels in the differentiated 3T3-L1 adipocyte pools harboring sense, antisense adiponectin gene, or vector alone, The basal glucose uptake of the cells transfected with vector alone (black bar in basal group) was set to 1 to adjust the values from the others. The insulin stimulated glucose uptake for the vector-alone (black bar in insulin+) was enhanced by approximately sixfold. White bars results using sense adiponectin-expression clones; shaded bars results using antisense
adiponectin-expression clones (mean and SEM. of seven separate experiments); *P=0.035. B Western blot gel showing the relative amount of adiponectin (a) andβ -actin (b) proteins in the differentiated 3T3-L1 cells harboring the plasmids with vector alone (lane 1), sense (lane 2), or antisense adiponectin gene (lane 3). The adiponectin protein level of the antisense pool was lower adjusted for the level of the control geneβ-actin
This study provides the genetic evidence that adiponectin influences BMI, which is consistent with the findings in several very recent genetic reports [20, 21, 22, 23]. Most importantly, we found the differential expression of the alleles associated with the polymorphism. We also demonstrate that the difference in expression levels of adiponectin can lead to different glucose uptake in differentiated 3T3-L1 adipocytes. Since the T94G polymorphism is a synonymous mutation without a biological effect on its own, all these genetic association studies in a sense led to the same conclusions that the adiponectin gene is a genetic contributor to insulin sensitivity, BMI, and risk of type 2 diabetes [20, 21, 22, 23, 24]. Exactly what genetic alterations are in linkage disequilibrium with this polymorphism is not clear at present. A difference in the allele-specific expression of an SNP of the gene has been suggested recently to correlate functionally with disease phenotype [30]. Our study showed for the first time that the steady-state mRNA levels transcribed by the G allele are higher than those by the T allele in the adipose tissue of heterozygous subjects, suggesting that the promoter, the introns, and/or the other potential regulatory elements such as upstream enhancers or locus control regions of the adiponectin gene should be carefully
examined. Recently the SNPs in the adiponectin promoter region were shown to be associated with type 2 diabetes [24]. Whether these SNPs are functional and are responsible for the allele-specific expression observed in our study has not been explored. Alternatively, this synonymous mutation may affect steady-state mRNA levels by altering RNA splicing or stability. The T/G or linked polymorphism nearby may affect mRNA splicing or stability [31]. The allele-specific differential expression of adiponectin in the adipose tissue is also consistent with the observations that higher plasma adiponectin was associated with reduced risk of obesity, diabetes, insulin resistance and coronary heart disease in humans [8, 17, 18]. Our data provide an explanation for the indirect genetic association studies at the molecular levels. However, the exact genetic mechanisms responsible for the allele-specific expression await further exploration.
Our transfection experiments further demonstrated that the expression level of adiponectin affects insulin-stimulated glucose uptake in adipocytes. Previous studies have shown the insulin-sensitizing effects of adiponectin in liver and skeletal muscle [15, 16]. This is the first to show that adiponectin also affects insulin sensitivity on adipocytes themselves. Therefore adiponectin may act in the adipose tissue via an autocrine or paracrine manner. However, our experiments were too preliminary to address the exact mechanism of actions. In conclusion, our study suggests that the human adiponectin gene is an important genetic factor linking insulin resistance syndrome and related disorders such as obesity. The allele-specific differential
expression of adiponectin at least partially explains the biological effects observed in many genetic association studies.
Acknowledgements This work was supported by the Program for Promoting
Academic excellence of Universities (89-B-FA01-1-4) from the Ministry of Education and a grant from the National Research Program for Genomic Medicine, National Science Council (NSC 91-3112-B-002-019) of the Republic of China.
References
1. Funahashi T, Nakamura T, Shimomura I, Maeda K, Kuriyama H, Takahashi M, Arita Y, Kihara S, Matsuzawa Y (1999) Role of adipocytokines on the
pathogenesis of atherosclerosis in visceral obesity. Intern Med 3:202–206 2. Friedman JM, Halaas JL (1998) Leptin and the regulation of body weight in
mammals. Nature 395:763–770
3. Steppan CM, Bailey ST, Bhat S, Brown EJ, Banerjee RR, Wright CM, Patel HR, Ahima RS, Laza, MA (2001) The hormone resistin links diabetes to obesity. Nature 409:307–312
4. Hu E, Liang P, Spiegelman BM (1996) AdipoQ is a novel adipocyte-specific gene dysregulated in obesity. J Biol Chem 271:10697–10703
5. Scherer PE, Williams S, Fogliano M, Baldini G, Lodish HF (1995) A novel serum protein similar to C1q, produced exclusively in adipocytes. J Biol Chem
270:26746–26749
6. Maeda K, Okubo K, Shimomura I, Funahashi T, Matsuzawa Y, Matsubara K (1996) cDNA cloning and expression of a novel adipose specific collagen-like factor, apM1. Biochem Biophys Res Commun 221:286–289
7. Nakano Y, Tobe T, Choi-Miura NH, Mazda T, Tomita M (1996) Isolation and characterization of GBP28, a novel gelatin-binding protein purified from human plasma. J Biochem (Tokyo) 120:803–812
8. Ouchi N, Kihara S, Arita Y, Maeda K, Kuriyama H, Okamoto Y, Hotta K, Nishida M, Takahashi M, Nakamura T, Yamashita S, Funahashi T, Matsuzawa Y (1999) Novel modulator for endothelial adhesion molecules: adipocyte-derived plasma protein adiponectin. Circulation 100:2473–2476
9. Yokota T, Oritani K, Takahashi I, Ishikawa J, Matsuyama A, Ouchi N, Kihara S, Funahashi T, Tenner AJ, Tomiyama Y, Matsuzawa Y (2000) Adiponectin, a new member of the family of soluble defense collagens, negatively regulates the growth of myelomonocytic progenitors and the functions of macrophages. Blood
96:1723–1732
10. Ouchi N, Kihara S, Arita Y, Okamoto Y, Maeda K, Kuriyama H, Hotta K, Nishida M, Takahashi M, Muraguchi M, Ohmoto Y, Nakamura T, Yamashita S, Funahashi T, Matsuzawa Y (2000) Adiponectin, an adipocyte-derived plasma protein, inhibits endothelial NF-kappaB signaling through a cAMP-dependent pathway. Circulation 12:1296–1301
11. Ouchi N, Kihara S, Arita Y, Nishida M, Matsuyama A, Okamoto Y, Ishigami M, Kuriyama H, Kishida K, Nishizawa H, Hotta K, Muraguchi M, Ohmoto Y, Yamashita S, Funahashi T, Matsuzawa Y (2001) Adipocyte-derived plasma protein, adiponectin, suppresses lipid accumulation and class A scavenger receptor expression in human monocyte-derived macrophages. Circulation 103:1057–1063
12. Okamoto Y, Arita Y, Nishida M, Muraguchi M, Ouchi N, Takahashi M, Igura T, Inui Y, Kihara S, Nakamura T, Yamashita S, Miyagawa J, Funahashi T,
Matsuzawa Y (2000) An adipocyte-derived plasma protein, adiponectin, adheres to injured vascular walls. Horm Metab Res 32:47–50
13. Hotta K, Funahashi T, Bodkin NL, Ortmeyer HK, Arita Y, Hansen BC, Matsuzawa Y (2001) Circulating concentrations of the adipocyte protein adiponectin are decreased in parallel with reduced insulin sensitivity during the progression to type 2 diabetes in rhesus monkeys. Diabetes 50:1126–1133 14. Fruebis J, Tsao TS, Javorschi S, Ebbets-Reed D, Erickson MR, Yen FT, Bihain
BE, Lodish HF (2001) Proteolytic cleavage product of 30-kDa adipocyte complement-related protein increases fatty acid oxidation in muscle and causes weight loss in mice. Proc Natl Acad Sci U S A 98:2005–2010
15. Yamauchi T, Kamon J, Waki H, Terauchi Y, Kubota N, Hara K, Mori Y, Ide T, Murakami K, Tsuboyama-Kasaoka N, Ezaki O, Akanuma Y, Gavrilova O, Vinson C, Reitman ML, Kagechika H, Shudo K, Yoda M, Nakano Y, Tobe K, Nagai R, Kimura S, Tomita M, Froguel P, Kadowaki T (2001) The fat-derived hormone adiponectin reverses insulin resistance associated with both lipoatrophy and obesity. Nat Med 7:941–746
16. Berg AH, Combs TP, Du X, Brownlee M, Scherer PE (2001) The
adipocyte-secreted protein Acrp30 enhances hepatic insulin action. Nat Med 7:947–953
17. Arita Y, Kihara S, Ouchi N, Takahashi M, Maeda K, Miyagawa J, Hotta K, Shimomura I, Nakamura T, Miyaoka K, Kuriyama H, Nishida M, Yamashita S, Okubo K, Matsubara K, Muraguchi M, Ohmoto Y, Funahashi T, Matsuzawa Y
(1999) Paradoxical decrease of an adipose-specific protein, adiponectin, in obesity. Biochem Biophys Res Commun 257:79–83
18. Hotta K, Funahashi T, Arita Y, Takahashi M, Matsuda M, Okamoto Y, Iwahashi H, Kuriyama H, Ouchi N, Maeda K, Nishida M, Kihara S, Sakai N, Nakajima T, Hasegawa K, Muraguchi M, Ohmoto Y, Nakamura T, Yamashita S, Hanafusa T, Matsuzawa Y (2000) Plasma concentrations of a novel, adipose-specific protein, adiponectin, in type 2 diabetic patients. Arterioscler Thromb Vasc Biol
20:1595–1599
19. Weyer C, Funahashi T, Tanaka S, Hotta K, Matsuzawa Y, Pratley RE, Tataranni PA (2001) Hypoadiponectinemia in obesity and type 2 diabetes: close association with insulin resistance and hyperinsulinemia. J Clin Endocrinol Metab
86:1930–1935
20. Hara K, Boutin P, Mori Y, Tobe K, Dina C, Yasuda K, Yamauchi T, Otabe S, Okada T, Eto K, Kadowaki H, Hagura R, Akanuma Y, Yazaki Y, Nagai R, Taniyama M, Matsubara K, Yoda M, Nakano Y, Kimura S, Tomita M, Kimura S, Ito C, Froguel P, Kadowaki T (2002) Genetic variation in the gene encoding adiponectin is associated with an increased risk of type 2 diabetes in the Japanese population. Diabetes 51:536–540
21. Stumvoll M, Tschritter O, Fritsche A, Staiger H, Renn W, Weisser M, Machicao F, Haring H (2002) Association of the T-G polymorphism in adiponectin (exon 2) with obesity and insulin sensitivity: interaction with family history of type 2 diabetes. Diabetes 51:37–41
22. Kondo H, Shimomura I, Matsukawa Y, Kumada M, Takahashi M, Matsuda M, Ouchi N, Kihara S, Kawamoto T, Sumitsuji S, Funahashi T, Matsuzawa Y (2002) Association of adiponectin mutation with type 2 diabetes: a candidate gene for the insulin resistance syndrome. Diabetes 51:2325–2328
23. Menzaghi C, Ercolino T, Di Paola R, Berg AH, Warram JH, Scherer PE, Trischitta V, Doria A (2002) A haplotype at the adiponectin locus is associated with obesity and other features of the insulin resistance syndrome. Diabetes 51:2306–2312 24. Vasseur F, Helbecque N, Dina C, Lobbens S, Delannoy V, Gaget S, Boutin P,
Vaxillaire M, Lepretre F, Dupont S, Hara K, Clement K, Bihain B, Kadowaki T, Froguel P (2002) Single-nucleotide polymorphism haplotypes in the both proximal promoter and exon 3 of the APM1 gene modulate adipocyte-secreted adiponectin hormone levels and contribute to the genetic risk for type 2 diabetes in French Caucasians. Hum Mol Genet 11:2607–2614
polymorphism within the human adipocyte-specific apM-1gene but not Tyr111His polymorphism is associated with higher levels of cholesterol and LDL-cholesterol in caucasian patients with type 2 diabetes. Exp Clin Endocrinol Diabetes
109:320–325
26. Takahashi M, Arita Y, Yamagata K, Matsukawa Y, Okutomi K, Horie M, Shimomura I, Hotta K, Kuriyama H, Kihara S, Nakamura T, Yamashita S, Funahashi T, Matsuzawa Y (2000) Genomic structure and mutations in
adipose-specific gene, adiponectin. Int J Obes Relat Metab Disord 24:861–868 27. Schaffler A, Barth N, Palitzsch KD, Drobnik W, Scholmerich J, Schmitz G (2000)
Mutation analysis of the human adipocyte-specific apM-1 gene. Eur J Clin Invest 30:879–887
28. Yang WS, Lee WJ, Funahashi T, Tanaka S, Matsuzawa Y, Chao CL, Chen CL, Tai TY, Chuang LM (2001) Weight reduction increases plasma levels of an
adipose-derived anti-inflammatory protein, adiponectin. J Clin Endocrinol Metab 86:3815–3819
29. Fingar DC, Birnbaum MJ (1994) Characterization of the mitogen-activated protein kinase/90-kilodalton ribosomal protein S6 kinase signaling pathway in 3T3–L1 adipocytes and its role in insulin-stimulated glucose transport.
Endocrinology 134:728–735
30. Yan H, Yuan W, Velculescu VE, Vogelstein B, Kinzler KW (2002) Allelic variation in human gene expression. Science 297:1143
31. Mendell JT, Dietz HC (2001) When the message goes awry: disease-producing mutations that influence mRNA content and performance. Cell 107:411–414
附件 2
Genetic Epistasis of Adiponectin and PPARγ2 Genotypes in Modulation of Insulin Sensitivity: a Family-based Association Study
W-S. YANG, 1, 2 C. A. HSIUNG, 3 L-T. HO,4 Y-T. CHEN, 5 C-T. HE,6 J. D. CURB,7 J. GROVE,7 T. QUERTERMOUS, 8 Y-D. I. CHEN,9 S-S. KUO, 1 L-M. CHUANG, 1, 2 for the SAPPHIRe Study Group
1
Department of Internal Medicine , National Taiwan University Hospital, Taipei, Tiaiwan
2
Graduate Institute of Clinical Medicine, National Taiwan University, Taipei, Taiwan
3
Division of Biostatistics and Bioinformatics, National Health Research Institutes, Taipei, Taiwan
4
Department of Medical Research and Education, Taipei Veterans General Hospital; and Faculty of Medicine, School of Medicine, National Yang-Ming University, Taipei, Taiwan
5
Department of Endocrinology and Metabolism, Taichung Veterans General Hospital, Taichung, Taiwan
6
Department of Endocrinology and Metabolism, Tri-Service General Hospital, Taipei, Taiwan;
7
the University of Hawaii, Honolulu, Hawaii, USA
8
Stanford University School of Medicine, Stanford, CA, USA
9
Cedars-Sinai Medical Center, Los Angeles, CA, USA Word count: abstract: 245; text: 2631
Corresponding author:
Lee-Ming Chuang, M.D., Ph.D. Department of Internal Medicine, National Taiwan University Hospital, 7 Chung-Shan South Road, Taipei, Taiwan. Phone: +886-2-23123456 ext. 5038; Fax: +886-2-23938859
Key words: adiponectin, PPARγ, polymorphisms, gene interaction, insulin sensitivity Abstract.
Aims/hypothesis. Genetic interactions in modulating the phenotypes of a complex trait, such as insulin sensitivity, were usually taken for granted. However, this has not been commonly demonstrated. Previous studies have suggested that both PPAR2 and adiponectin genes may influence insulin sensitivity. Therefore it is likely that they could modulate insulin sensitivity through gene-gene interactions.
Methods. We genotyped 1793 subjects of Chinese and Japanese descendents from 601 hypertensive families recruited in SAPPHIRe study for a T94G in the adiponectin gene exon 2 and the PPAR2 Pro12Ala polymorphisms. Serum insulin levels and insulin resistance index (HOMAIR) were used as the markers of insulin sensitivity.
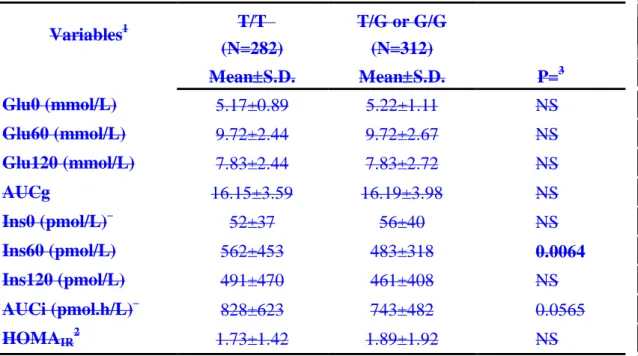
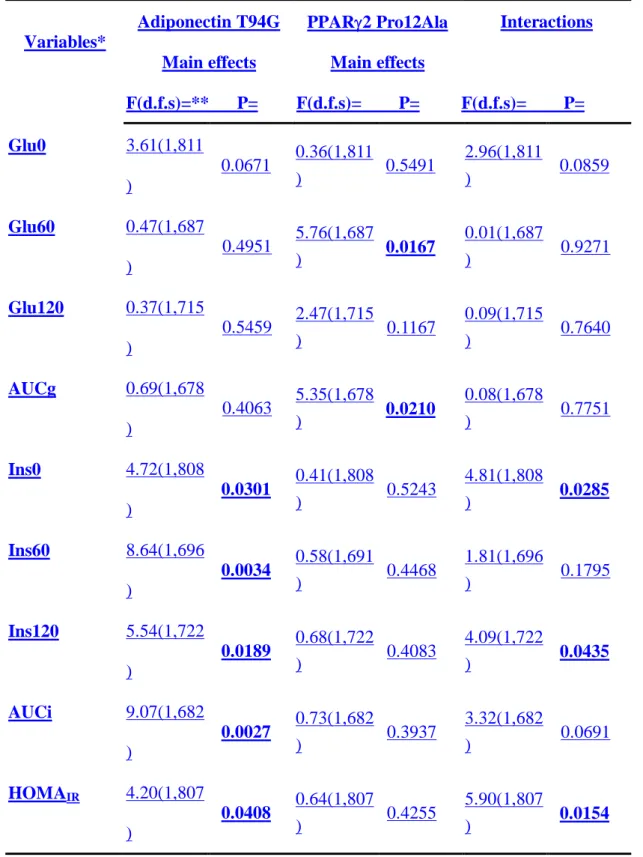
Results. We found that the T allele of adiponectin gene was associated with a higher Ins60 and higher area under curve of insulin (AUCi) in oral glucose tolerance tests (OGTT) utilizing all subjects in a mixed model that corrected for family effects. Significant interactions between adiponectin and PPAR2 genotypes were found in fasting insulin levels (Ins0), insulin levels at 2-hour (Ins120) in OGTT and insulin resistance index (HOMAIR). The main effects of the PPAR2 genotypes were in the
plasma glucose levels in OGTT. In contrast, the main effects of adiponectin genotypes were in every insulin variables, including Ins0, Ins60, Ins120, AUCi and HOMAIR.
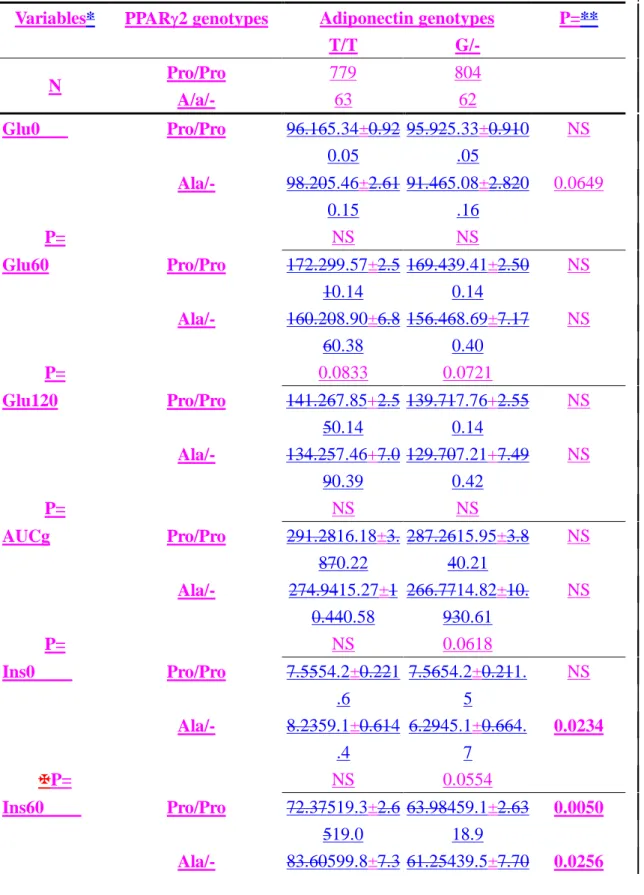
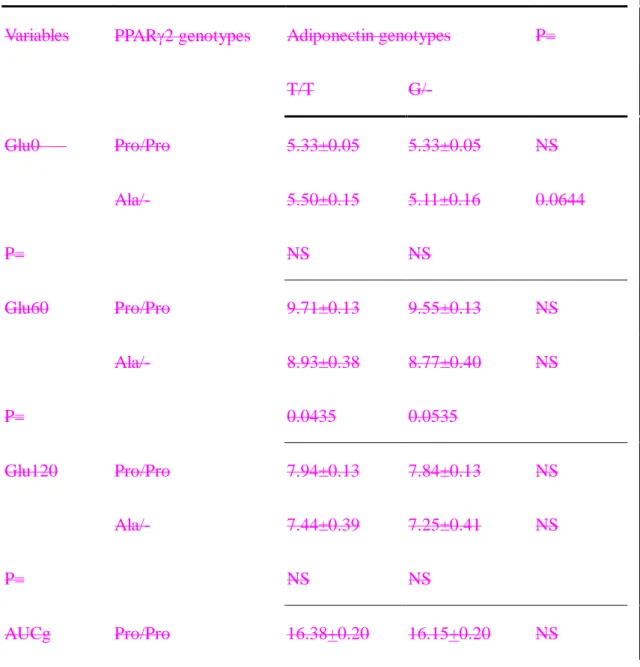
The subjects carrying the adiponectin G allele and the PPAR2 Ala12 allele appeared to be more insulin sensitive.
Conclusion/interpretation. These results showed that adiponectin is a genetic factor
regulating associated with insulin sensitivity. Interactions with PPAR2 genotypes
INTRODUCTION
Type 2 diabetes mellitus (T2DM) has daunted many countries in the developed or developing world [1]. Insensitivity to insulin stimulation is generally accepted to be the fundamental pathophysiology of T2DM [2]. As a classical example of poly-genic (also called multi-factorial or complex) diseases, the pathogenesis of T2DM is attributed to the collective actions of many genetic and environmental factors and the complex interactions among them [3]. The contribution of gene-gene interactions in shaping the phenotypes of T2DM, such as insulin sensitivity, is usually taken for granted. However, it is only occasionally demonstrated [4, 5].
Among many potential thrifty genes, the Pro12Ala variants of the human PPAR2 gene have been quietly extensively surveyed in many genetic association studies by other investigators [6-8]. Previously we have also reported the association of PPAR2 Ala12 variant with better glucose tolerance and insulin sensitivity among subjects from Japanese and Chinese hypertension families in Stanford Asia Pacific Program in Hypertension and Insulin Resistance (SAPPHIRe) study [9]. Because of its family-based study design utilizing the comparisons between siblings, the genetic association study in SAPPHIRe is expected to have better control in early childhood environmental factors and genetic background than a population-based genetic association study [9-11].
The other sensible genetic candidates for T2DM are adipose-derived secreted molecules regulated by PPAR2, such as leptin, resistin and adiponectin. Among them, the recombinant adiponectin protein has been recently demonstrated in mice to be capable of lowering plasma glucose and fatty acids, improving insulin sensitivity and reducing body weight [12-14]. It has also been reported that adiponectin genotypes in humans influenced insulin sensitivity and the risk for T2DM [15-19]. Recent studies using knockout mice in general confirmed these biological functions of adiponectin [20, 21].
We have recently demonstrated that treating T2DM patients with rosiglitazone, a PPAR2 agonist raised their plasma adiponectin levels by more than 2-fold [22]. The other investigators have also shown that the administration of glitazones increased the expression of adiponectin in humans as well in animals and in cultured adipocytes [23-26]. These results, all together, suggest a possibility of genetic interactions between PPAR2 and adiponectin, and its attribution to insulin sensitivity.
In this study, we investigated the association of adiponectin T94G polymorphism with metabolic phenotypes and the effects of its interaction with PPAR2 Pro12Ala polymorphism on these phenotypes among the large cohort from the SAPPHIRe [9, 10]. We found that the T allele of adiponectin was associated with post-glucose load
hyperinsulinemia. The main effects of the adiponectin and PPAR2 genotypes and the genetic interactions between them on the metabolic variables were revealed in further analyses. The subjects having both the G allele of adiponectin and the Ala12 allele of PPAR2 appeared to be more insulin sensitive.
RESEARCH DESIGNS AND METHODS Subjects and Phenotypic Characterization
The characteristics of study population, the inclusion and exclusion criteria of SAPPHIRe study were detailed in several previous publications [9, 10]. Notably, diabetic subjects diagnosed based on the WHO criteria were excluded [27]. This study incorporated both the concordant (both hypertension) and the discordant sib-pairs (one hypertension, the other hypotension) in design. A total of 2525 subjects of Japanese or Chinese descendents were recruited from 6 centers at San Francisco, Hawaii and Taiwan. In this report, 1793 subjects including parents and sibs from 601 families were genotyped. Written informed consent was obtained form all participants. The study was approved by the ethics board of each participating institute. Characterization of the subjects by fasting plasma glucose, insulin, triglyceride, total cholesterol, lipoprotein profiles, OGTT and anthropometric measurements, including height, weight, waist and hip circumferences were previously described in details previously [9, 10]. A 75-g oral glucose tolerance test (OGTT) was performed and plasma glucose and insulin levels at 1- hour and 2 hour2-hour post-glucose load wereas measured [9, 10]. The fasting plasma sample was obtained right before the OGTT was conducted.
Extraction of genomic DNA and genotyping
Total genomic DNA was purified from peripheral blood leukocytes using DNA extraction kit of Puregene (Minneapolis, MN, USA), following the manufacturer’s protocol. The primers used for PCR amplification for the exon 2 of human adiponectin gene were: 5’-TAG AAG TAG ACT CTG CTG AGA TG-3’ and 5’-CTC CCT GTG TCT AGG CCT TAG–3’. The PCR reactions were performed in a total volume of 15 l containing 20 ng of genomic DNA with an initial denaturation at 94oC for 5 min, followed by denaturing at 94oC for 30 sec, annealing at 68 to 60oC for 1 min with the annealing temperature stepping down 2oC for every 5 cycles, and polymerization at 72oC for 40 sec; then by a final extension at 72oC for 10 min. Four l of the amplified DNA was digested with BspHI enzyme (New England BioLabs, Inc., Beverly, MA, USA), and then electrophoresed on a 2% agarose gel. The resulting fragment of PCR was 422 base pairs (bp). Because the T94G substitution abolished a BspHI restriction site, two fragments of 265 and 157 bp after digestion indicate the presence of T allele. This polymorphism is equivalent to the SNP45 described by Hara et al. [16]. The genotyping of PPAR2 Pro12Ala was published previously [9].
Statistical Analyses
Association analysis for adiponectin genotypes- All variables were in S.I. units except
that in HOMA-IR. The data were given in means and S.E. In order to compare each
outcome variable between the G variant-carrying individuals (including the genotypes T/G and G/G) and their sibs with the genotype T/T, only the siblings with discordant genotypes in T94G polymorphism of the adiponectin gene were included in the analysis. Paired analysis was used to test whether there was difference in variables of interest between the sibs discordant for genotypes after adjustment for age, gender,
BMI, ethnicity and area of enrollment BMI by employing analysis of covariance with these variables as covariates. The residuals were then used to test the null hypothesis that there is no difference in the adjusted variables between genotype-discordant sibs among all families (Table 2). The analyses were performed using the SAS version 8.0 PROC GLM. We also performed analysis of covariance using a mixed model to assess whether the adiponectin genotypes affect the outcome variables controlling for covariates age, gender, BMI, ethnicity and area of enrollment BMI as fixed effects, and controlling for clustering among families as a random effect (Ttable 23). The analyses were performed using the SAS 8.0 PROC MIXED. All statistical tests were two-tailed. The p-values less than 0.05 were considered statistically significant. These statistical analyses were previously described [9, 10].
Analyses on adiponectin gene and PPAR2 gene interactions- In order to assess the interactions between the adiponectin and PPAR2 genotypes, we performed analysis of covariance using a mixed model to evaluate the contribution of the main effects of adiponectin T49G, PPAR2 Pro12Ala respectively, and their interactions for each variable of interest in the same model controlling for covariates age, gender, BMI
ethnicity and BMI area of enrollment as fixed effects and entering family as a random effect (Ttable 34). The analyses were performed using the SAS 8.0 PROC MIXED.
The differences of several variables between the subjects with different adiponectin genotypes within fixed PPAR2 genotypes after adjusting for age, gender, ethnicity, BMI, area of enrollment and family effects were compared (Ttable 45,
Ffigure 1).The values/bars reported are the least square means for each subgroup. The p values were obtained using the SAS PROC MIXED.
RESULTS
The genotype and allele frequencies of adiponectin T94G polymorphism in Japanese and Chinese subjects were comparable (Table 1A). The genotype and allele frequencies in the hypertensive probands were similar and did not deviate from Hardy-Weinberg equilibrium (Table 1B). The genotype and allele frequencies, and the basic characteristics of these subjects categorized by the PPAR2 genotypes were reported previously [9]. Using a sibling-based comparison for phenotypic variables, we found that the subjects with the T/T genotype (n=282) had significantly higher mean plasma insulin level at 1 hour (Ins60) during oral glucose tolerance tests (OGTT) than that of the sibs with the discordant genotypes (T/G and G/G, n=312) after adjustment for age, gender, BMI, ethnicity and the area of enrollment BMI ((562±27 vs. 483±18 pmol/L, p=Table 20.0067). The differences in three other variables including in the mean area under curve of plasma insulin (AUCi) in OGTT, total cholesterol and LDL cholesterol wasere of borderline statistical significance (Table 2828±37 vs. 743±27 pmol.h/L, p=0.0578). The differences between dis-cocordant adiponectin genotypes in the other variables did not reach statistical significance (data not shown).
To confirm the above findings, we also used a mixed model to correct for familial effects. This method enabled us to include more subjects for analyses. The basic characteristics of the subjects included in this analysis were shown in Table 1(C).
After adjusting for age, gender, BMI, ethnicity and area of enrollment BMI, only the means in Ins60 and AUCi in OGTT were significantly different between subjects with the T/T genotype and those otherwise (Table 32). Post-glucose load hyperinsulinemia among subjects with the T/T genotypes in order to normalize plasma glucose levels shown in these two analyses suggests that they may be more insulin resistant. We also performed the analyses by categorize the subjects into three adiponectin genotypes (n=844 of T/T, n=701 of T/G and n=168 of G/G). The results were quite similar. Only
the mean Ins60 (525±18 vs. 455±20 vs. 461±35 pmol/L, p=0.0035) and AUCi (785±26 vs. 702±28 vs. 719±50 pmol.h/L, p=0.0204) were significantly different among the three genotypes. The differences were primarily between the T/T and the other two genotypes, suggesting a dominant effect of the G allele in association with insulin sensitivity. Thus this allowed us to pool G/T and G/G genotypes together in all the analyses.No significant difference among the three genotypes was observed in the other variables (data not shown).
Next we investigated the effects of genetic interactions between the adiponectin T94G and the PPARγ2 Pro12Ala polymorphisms. Previously, we found in the same study population that the PPARγ2 Ala12 variant was significantly associated with better glucose tolerance at 0 (Glu0) and 1 hour (Glu60) in OGTT and with lower
insulin resistant index by HOMA (HOMAIR) [9]. Using two-way ANOVA analysis,
we found that there were significant interactions between the adiponectin and PPAR2 genotypes in insulin levels at 0 (Ins0) and 2-hour (Ins120) in OGTT and HOMAIR,
with adjustment for age, gender, BMI, ethnicity and area of enrollment BMI, whereas their interactions in Glu0 and AUCi were lessof borderline significantnce (tTable 43). Interestingly, the main effects of adiponectin genotypes were all significant on every parameter (Ins0, Ins60, Ins120 and AUCi) of insulin in OGTT and HOMAIR. The
main effect of the adiponectin genotypes on Glu0 was of borderline significance (Ttable 3). In contrast, the main effects of PPAR2 genotypes were only significant on Glu0 Glu60 and area under curve of glucose (AUCg) in OGTT (Ttable 43).
To more clearly illustrate the effects of interactions, these subjects were grouped by their genotypes. It was apparent that the subjects carrying both the adiponectin G and PPAR2 Ala12 alleles were more insulin sensitive. They tended to have lower fasting plasma glucose and insulin, plasma insulin levels in OGTT, and HOMAIR
(Table 54, Figure 1). Subjects with the adiponectin G allele even when coupled with PPAR2 Pro/Pro still had lower insulin levels at 1-hour and AUCi in OGTT than subjects with the T/T genotype (Table 5 4 and Figure 1A).