國
立
交
通
大
學
生物資訊研究所
碩
士
論
文
以功能基團計分矩陣
預測蛋白質與去氧核醣核酸交互作用之結合模式
Modeling Protein-DNA Interactions
using Functional group Score matrices
研 究 生:陳彥修
指導教授:楊進木 教授
以功能基團計分矩陣
預測蛋白質與去氧核醣核酸交互作用之結合模式
Modeling Protein-DNA Interactions
using Functional group Score matrices
研 究 生:陳彥修 Student:Yen-Hsiu Chen
指導教授:楊進木 Advisor:Jinn-Moon Yang
國 立 交 通 大 學
生物資訊研究所
碩 士 論 文
A Thesis Submitted to Institute of Bioinformatics National Chiao Tung University
in partial Fulfillment of the Requirements for the Degree of Master in Bioinformatics
July 2009
Hsinchu, Taiwan, Republic of China
以功能基團計分矩陣
預測蛋白質與去氧核醣核酸交互作用之結合模式
學生: 陳彥修 指導教授: 楊進木博士
國立交通大學 生物資訊研究所碩士班
摘
要
蛋白質與去氧核醣核酸(DNA)的交互作用出現在細胞的許多重要機制中,這些機制 包括:基因的轉錄、複製、重組、以及轉譯等。探究基因轉錄調控機制中的蛋白質是以 何種結合模式與DNA 進行交互作用是重要的研究課題。然而,使用傳統的生物實驗方 法通常較為昂貴且耗時;在現階段,不斷增加的蛋白質與去氧核醣核酸之共結晶結構即 提供了一個研究胺基酸及核苷酸之間如何進行交互作用的豐富資料來源,根據這些資料, 我們有機會針對此問題進行更深入的研究。 我們提出了一個計算方法,是以蛋白質與去氧核醣核酸其中所產生的空間位向以及 各類化學鍵結,來建立這兩者之間交互作用的模型。此方法不但可以提供交互作用之模 型,矩陣預測更可以呈現各類胺基酸及核苷酸之間鍵結的偏好程度。由ProNIT 的 70 筆 點突變資料來看,我們發現考慮氫鍵以及靜電吸引力之計分矩陣,較過去研究更能反映 出胺基酸在點突變之後與核苷酸結合的自由能變化。接著我們以環磷酸腺苷(cAMP)受質蛋白(cAMP receptor protein, CRP)做為建立模型 的研究之實例,掃描其轉錄結合區(TFBS)的核酸序列。最後嘗試以提出的計分矩陣解釋 環磷酸腺苷受質蛋白做為不同的調控轉錄因子與去氧核醣核酸結合之間的機制。我們發
現位在轉錄結合區GTG motif 上的鳥嘌呤胞嘧啶配對(GC pair),其保留程度可能與環磷
Modeling protein-DNA interactions
using functional group score matrices
Student: Yen-Hsiu Chen Advisor: Dr. Jinn-Moon Yang
Institute of Bioinformatics
National Chiao Tung University
ABSTRACT
Protein–DNA interactions are involved in many important cellular processes, such as transcription, replication, recombination and translation. Understanding the binding model of protein–DNA complexes is essential to investigate many cellular regulations, including transcriptional regulation. However, it is usually expensive and time-consuming to clarify the binding model of proteins and DNA by using experimental approaches. Currently, because of the increasing number of solved protein–DNA complex structures, from which potentials of residue–nucleotide interaction could be derived, we have chance to address this issue.
We proposed computational approach to modeling protein–DNA interactions by considering the contact information of the steric and specific energies. Such binding model and scoring matrices not only provided the binding model, but also indicated the preference of the pairs of interacting amino acids and nucleotides. By 70 mutated residues from ProNIT, we found that the scoring matrices considering hydrogen bonds and electrostatic interaction could reflect the change of free energy better than that without considering these interactions.
We then started to scan on each transcription factor binding site (TFBS) sequences according to the template model of cAMP receptor protein (CRP). Finally, we tried to use our scoring matrices to explain the different regulation mechanisms while CRP served as activator, repressor, or dual. We found that the conservation of GC pairs in GTG motif have relations with gene regulations mediated by CRP.
致 謝
離開高雄到北部唸書,已經有七個寒暑了。而來交大唸碩士的最後這兩年,是一段 非常特別的日子:接觸到很多不同的人、摸索陌生的新竹、學習一塊嶄新的領域。在交 大生資所的這段時間裡,要非常感謝楊進木老師的教導。反應不那麼快的我,總要仔細 思考後才能稍稍了解老師想法以及論點。而這樣不停給予的老師,實在讓我非常的感動, 不管是在生物資訊領域或是其他人生的思考,都有著非常正面的幫助而且讓我一再回味; 另外特別感謝曾慶平老師對於 CRP 研究上的支持以及盧錦隆老師在百忙之中能夠抽空 來擔任我的口試委員。 在 BioXGEM 裡做研究是一段十分有趣且富挑戰性的經驗。多虧了耀霖學長做為先 鋒的開疆闢土,這本論文才可以順利完成。還要謝謝宇書,邏輯清楚且反應快,在研究 以及程式上給我的幫助實在太多了,除此之外還是個跟我在 DOTA 上默契絕佳的好夥伴。 講到 DOTA 就不得不提到神手 PIKI(這麼稱呼會讓他非常得意)以及電腦總是爛線的 小強:跟我一起坐在實驗室中央分隔島的 PIKI 雖然總有用不完的自信,可是人在藥物 組的他,對於研究上的合理性以及方面感總是令我佩服;即便我與小強相處的時間不多, 但在簡短的談話中常常都能給予精準而且很棒的建議。而康康跟章大常常督促我在研究 上要多加油,讓常在神遊四海的我能加緊腳步。也要特別感謝章大,尤其在後面的這段 時間(雖然他已經在我後面很長一段時間)願意抽出時間幫我看我的研究。跟小黑一起 窩在後面小會議室玩 Sybyl 也讓我學到很多;曾老師家的冀冬學長也在 CRP 實驗上給 予我很多幫助。生活上則是要謝謝怡馨對大家有著許多的細心與體貼,帶給 BioXGEM 的我們這群阿宅不一樣光譜的溫暖。在實驗室裡最常跟我一起出去瘋的董花,是個好揪 出遊散心的咖;當壓力很大的時候,他給我的連結總是讓我振奮不已。阿甫總是個美食 的好夥伴,愛攝影的他,也常常帶一些好玩的小東西來實驗室給我們嘗鮮。而我也在跟 俊辰學長聊天中得到很多的歡笑以及不同次元的知識。這邊也要感謝實驗室裡其他的成 員:努力的志達、愛狗的敬立、既認真又宅氣沖天的峻宇、local 又搞笑的超哥、陽光 帥氣的力仁、揪團達人的韋帆、GGI 的御哲,讓我在實驗室裡的生活更加充實。 謝謝 G 團的光 se、牛妹、崧鳥、阿鮑對我如此的情義相挺;BB、金毛、家蔚,還 有其他輔大生科以及高中麻吉們的加油打氣。謝謝惠涵,這段日子裡的點點滴滴,妳都 是我每天最美麗的期待。 最後要謝謝我的家人,在我離開家裡的七年,儘管回家的時間不多,但總是給我滿 滿的溫暖以及關懷。謝謝爸爸的支持讓我在生活上沒有後顧之憂,選擇自己想走的路; 謝謝媽媽在電話中的耳提面命,讓我覺得備受呵護;謝謝老姊照顧我的愛犬熊熊;謝謝 像死黨一般的老弟能常常聽我吐苦水。 我想,人的一生中,很難得能有機會把這麼多想感謝的人寫下來。感謝在這段時間 陪伴我走過的每一個人。對我來說,這段時間所帶給我無論是快樂的、失落的,都將是 我永遠深刻的回憶。由衷謝謝你們! 陳彥修 謹誌CONTENTS
摘要
... I
ABSTRACT ... II
致謝
... III
CONTENTS ... IV
List of Tables ... VII
List of Figures ... VIII
Chapter 1
Introduction ... 1
1.1 Background ... 1
1.2 Related works ... 3
1.3 Motivation ... 6
1.4 Organization of this thesis ... 6
Chapter 2
Method and Materials ... 8
2.1 Overview ... 8
2.2 Data sets preparation ... 8
2.2.1 Preparation of protein–DNA complex ... 8
2.2.3 Data set of CRP ... 9
2.3 Performance criteria ... 10
2.3.1 Pearson's correlation coefficient ... 10
2.3.2 Student’s t-distribution (t-test) ... 11
2.4 Scoring matrices ... 11
2.4.1 Aligned ratio of contact residue ... 14
2.4.2 Knowledge-based scoring matrices ... 15
2.4.3 Scoring method ... 15
2.5 Evaluation of scoring matrices ... 16
2.5.1 Correlation between predicting energy (score) and ∆∆G ... 16
2.6 Scanning CRP binding sites with CRP crystal structure ... 17
Chapter 3
Results and Discussions ... 18
3.1 Overview ... 18
3.2 Different significance of interacting forces in protein–DNA interactions ... 18
3.3 Scoring matrices ... 20
3.3.1 Protein side chain with DNA backbone (Vsb & Ssb) ... 20
3.3.2 Protein side chain with DNA base edge (Vss & Sss) ... 21
3.3.3 Protein main chain with DNA backbone (Vmb & Smb) ... 22
3.3.5 Verification with experiment free energy ... 23
3.4 Detection of transcription factor binding sites ... 26
3.4.1 Distribution of CRP binding sites ... 26
3.4.2 Conservation of CRP binding sequences ... 28
3.4.3 Scanning CRP TFBSs with structural template binding model ... 28
3.4.4 The relationship between CRP binding sequences and gene regulation ... 31
Chapter 4
Conclusions ... 33
4.1 Summary ... 33
4.2 Future works ... 34
List of Tables
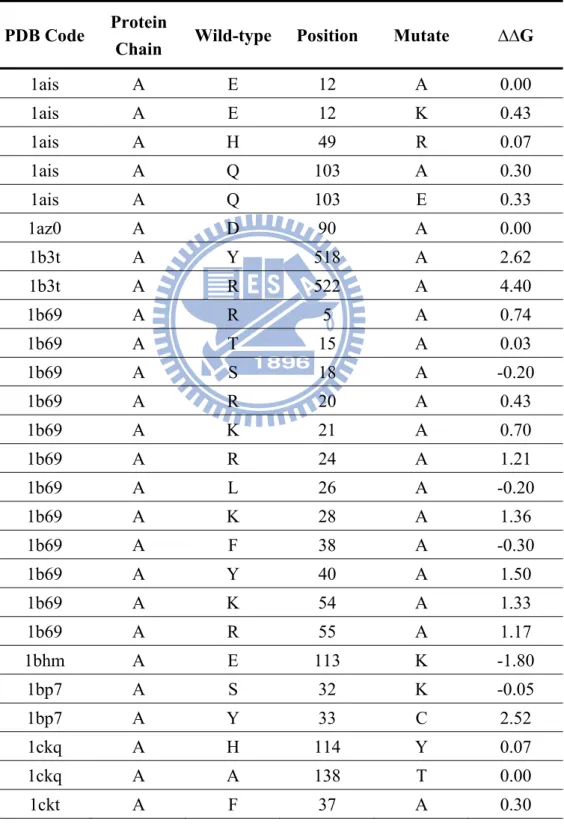
Table 1. List of the representative protein-DNA complex structure set. ... 37 Table 2. Thermodynamic data of single residue mutations. ... 48
List of Figures
Figure 1. An example of residue–nucleotide interaction pair in 1zrc. ... 51
Figure 2. An example of constructing contact profile. ... 52
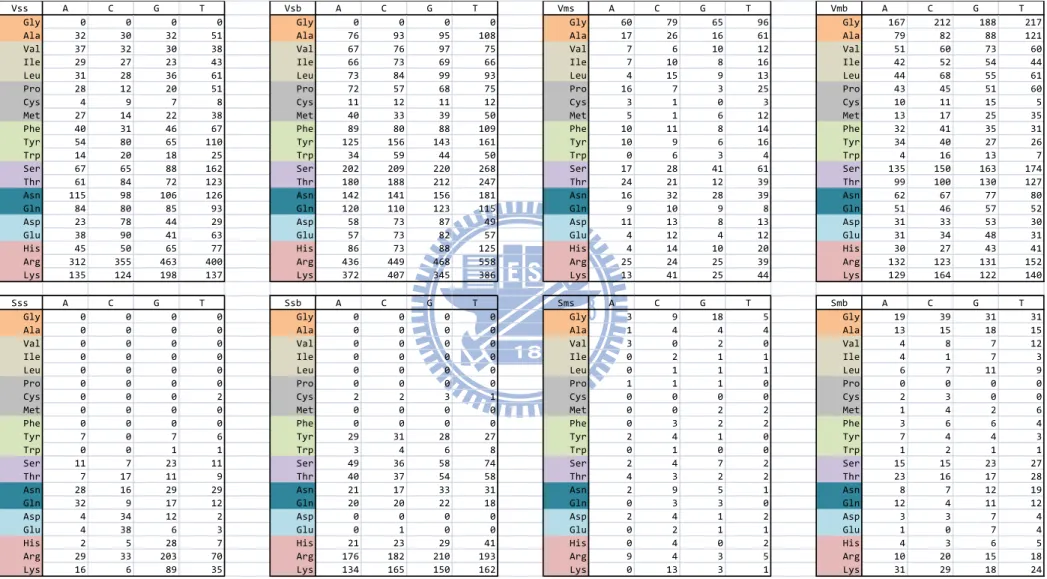
Figure 3. Frequency tables of eight interaction types. ... 53
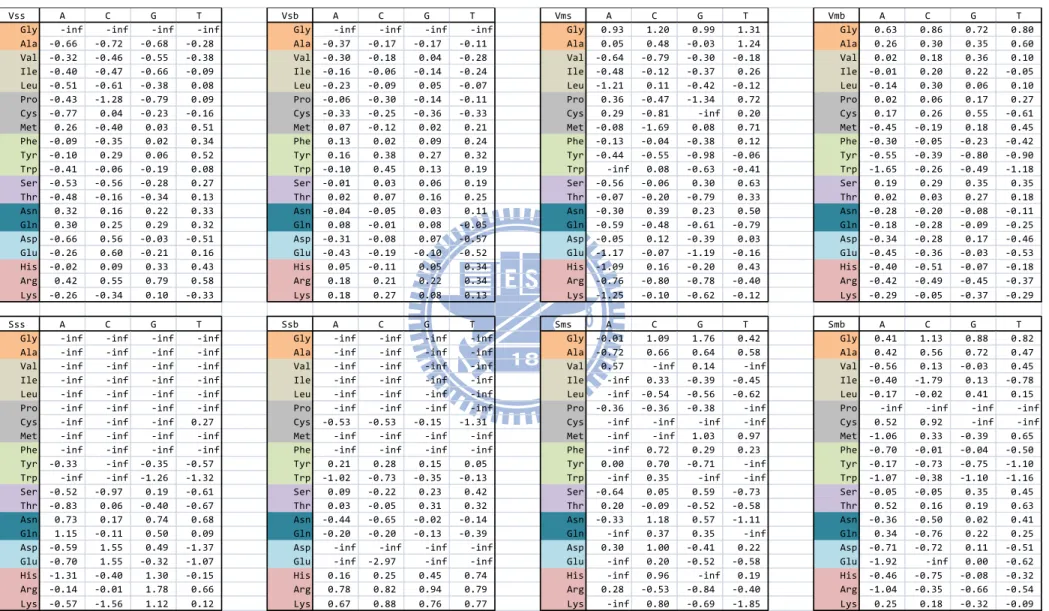
Figure 4. Log-odds score translated from frequency tables. ... 54
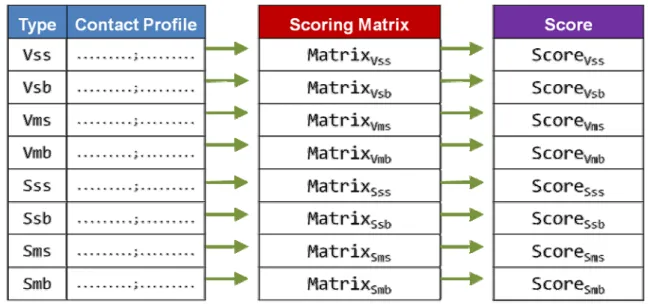
Figure 5. A flowchart of calculating the score of protein-DNA complex. ... 55
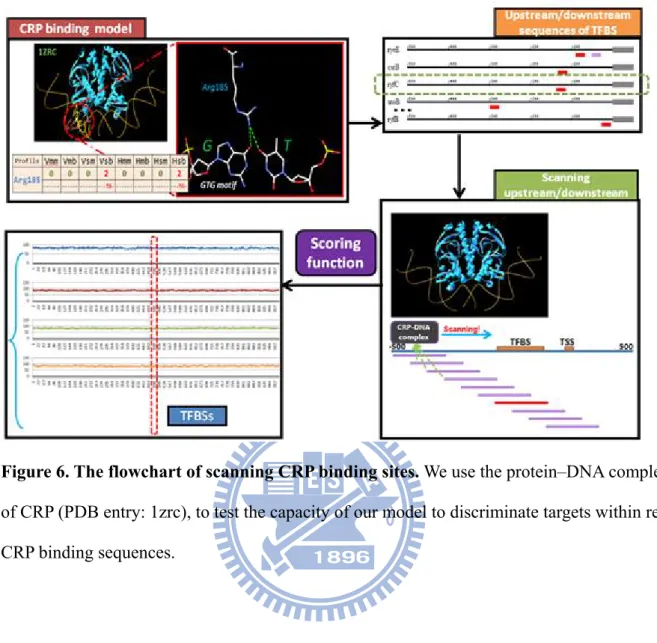
Figure 6. The flowchart of scanning CRP binding sites. ... 56
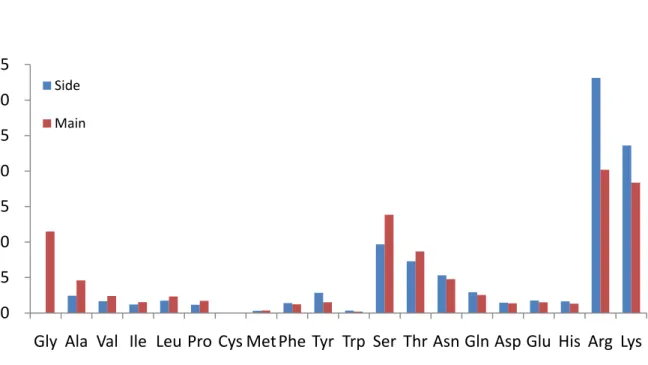
Figure 7. The propensity of 20 amino acids in protein-DNA interaction. ... 57
Figure 8. Distribution of interaction types of protein-DNA interactions. ... 58
Figure 9. Evaluation of the scoring function in binding affinities prediction. ... 59
Figure 10. The distribution of distance from TFBSs to transcription start site ... 60
Figure 11. Sequences logo of three kinds CRP regulator. ... 61
Figure 12. The interaction profile of 1zrc. ... 62
Chapter 1 Introduction
1.1 Background
Protein–DNA interactions participate in many biological processes within organisms, such as transcription, rearrangement, replication, and packaging. Some kinds of DNA-binding proteins were called transcription binding factors (TFs) that can mediate the regulation of various genes. Such regulations play a key role in biological pathway and reconstructing the network of pathways is the primary goal of post-genomic era. There have been many studies focus on protein–DNA interactions in different directions. For example, discovering novel transcription binding factors[1-3] and transcription factor binding sites (TFBSs) [4-7] can provide more information to study these problems. Another trend is to find the rules of binding mechanism between proteins and DNAs that can possibly help us to understanding the protein–DNA interactions [8-11].
Deoxyribonucleic acid (DNA) is a nucleic acid that contains the genetic instructions used in the development and functioning of all known living organisms and some viruses. The blueprint of cell processes like growth, cell division, and apoptosis are coded in the DNA. To obtain such information of those cell processes from DNA, cells use various proteins to bind DNA and mediate the decoding process. Such protein–DNA interactions play a central role
and participate in many biological processes within a cell, such as transcription, DNA replication, and recombination.
The transcription is the process of RNA synthesis based on the gene sequence of DNA duplex [12]. In bacteria, the RNA polymerase which is an enzyme of making RNA copies from DNA templates is used to bind promoter region directly for starting transcription. However, the transcription is more complicated in eukaryotes. A collection of proteins which is called transcription factors are required to attach the promoter region initially. The RNA polymerase in eukaryotes binds to the promoter only after the binding processes of transcription factors [13]. Transcription can be divided into three stages: in the initiation stage, the RNA polymerase synthesizes a very short nucleotide chains (~9bp) and release the short sequence. Such process is also called abortive initiation. In the elongation stage, the enzyme moves along the DNA and producing RNA sequence. As the enzyme proceeds, it unwinds the DNA helix and uses base paring complementary of the DNA template to create an RNA copy. The last stage is called terminal stage. When the enzyme recognizes the last base which should be add to the RNA chain, the transcription process will be terminated. To terminate the process, the transcription bubble collapses and the DNA reforms in double helix. Then both the enzyme and the RNA are released.
DNA replication has great important in biological inheritance. The replication is a process which generates two double-strand DNA molecules by copying a double-strand DNA
molecule. In a cell, the replication of DNA is happened only when the cell division occurs. In replication process, the double strand DNA first separate into two single strand at a specific point called origins. RNA primers then bind to the single-strand DNA template and the DNA polymerase extends such primers to create another strand of the template by adding complementary nucleotides. Such replication mechanism can also be done artificially by a technology called polymerase chain reaction (PCR). The PCR uses DNA polymerase and artificial DNA primers to synthesis DNA sequences in a template molecule. The technology is widely used because it can rapidly and specifically amplify a target DNA segment.
Genetic recombination is important for evolution because the recombination mechanism makes it possible to exchange the material between homologous chromosomes [14]. The recombination will break a strand of DNA and then join to a different DNA molecule. This process usually occurs during the protracted prophase of meiosis. By the recombination, offspring will have different combination of genes from their parents and produce a new chimeric allele. Such gene shuffling has many advantages in evolution.
1.2 Related works
The interactions between transcription factors (TFs) and their DNA binding sites are an integral part of the regulatory networks within cells. These interactions control critical steps in
development and responses to environmental stresses, and in humans their dysfunction can contribute to the progression of various diseases. Much progress has been mad recently in the accumulation and analysis of mRNA transcript profiles and genome-wide location profiles. DNA microarray-based readout of chromatin immunoprecipitation, also known as “ChIP-chip” or “genome-wide location analysis”, is currently the most widely used method for identifying
in vivo genomic binding sites for TFs in high-throughput manner [15]. However, ChIP has
some inherent caveats that can make determinations of a TF’s DNA binding specificity difficult [16].
Crystal structures of protein–DNA complexes had provided an excellent platform for studying protein–DNA interactions. These structures offer the geometric information as well as the interacting model of proteins and their binding DNAs. Some important features such as electrostatic interactions and hydrogen bonds formation between protein and DNA can also be identified through crystal structures.
The first group that used the structure of protein–DNA complex as templates to predict novel interaction pairs of proteins and DNAs is Sarai’s group [17]. Since the template is trivially a protein–DNA binding partner, it can help to find other binding partners that have the same binding model as the template. To this end, they introduced a “threading” concept that DNA sequences were threaded to the template DNA. To see the reliability of interaction between template protein and threaded DNA sequences, they developed a knowledge-based
scoring function for evaluation the interaction between amino acids and DNA. Such knowledge-based scoring function will calculate a statistic potential for each protein–DNA pairs and identify possible candidates with statistical significant potential. By this approach, they successfully predict the DNA binding sites of regulatory proteins. They also model the base preference of the three zinc-finger positions of a designed zinc finger protein (PDB code: 1MEY).
Not only Sarai’s group used the template-based approach, but also Baker’s group used this approach to model protein–DNA interactions in different way to obtaining the potential of the complexes [18]. They calculated the free energy from all atoms of the complex by using a nine-term function. These terms are briefly described as follow. The attractive and van der Waals atomic forces were modeled by Lennard-Jones potential. The modeling of solvation is based on the model developed by Lazaridis and Karplus. The orientation-dependent hydrogen bonding term was obtained from analyzing protein structures. The pair interaction term models the electrostatic interactions between amino acids. The backbone torsional term describes the differences in the local structure propensities of the amino acids. They also used 20 reference energies to control the overall amino acid composition.
To predict novel protein–DNA binding partners, they used following steps. First, a suitable protein–DNA complex is selected for computational modeling. Second, each novel DNA sequence is threaded to the template DNA with fixed DNA torsion angles. Finally, the
binding free energy of each threaded sequence is obtained by the energy function. They have shown the capability of such model for designing novel protein–DNA interactions.
1.3 Motivation
Recently, the rapidly increasing crystal data on the protein–DNA complex provide a rich source of information about the interactions between amino acids and DNA base pairs [19]. Furthermore, the growing bioinformatics can help researchers to handle the vast amount of data generated by various approaches. Many easy-to-use databases which record important interaction information of protein and DNA are available on the internet. There are also many computational tools that can help us to predict novel DNA-binding proteins, the target sites of DNA-binding proteins, and possible interactions between proteins and DNAs. These resources offer a good basis for researchers to study this topic and to develop more efficient and accuracy methods for protein–DNA interactions.
1.4 Organization of this thesis
This thesis is organized as follows. In Chapter 2, we introduced several data bases such as ProNIT and RegulonDB, then we described the statistics method using in this study. Here,
we also define some criteria of choosing our representative protein for constructed our scoring matrices. Chapter 3 is results and discussion, we will fist describe the importance of separate interacting forces, and then we proposed our knowledge-based scoring matrix to model the binding affinity of a protein–DNA partner. The major novelty of the scoring function is that four interaction types between residues and nucleotides are taken into consideration, and try to explain the biological meaning of our scoring matrices. Then test these matrices on thermodynamic free energy data sets and use the model to scan the cAMP receptor protein (CRP) binding sites. The Chapter 4 presents the conclusion and the future perspectives.
Chapter 2 Method and Materials
2.1 Overview
In this chapter, we will introduce several data bases such as ProNIT and RegulonDB, then described the statistics method using in this study. Here, we also define some criteria of choosing our representative protein for constructed our scoring matrices. This chapter is organized as follow. In section 2.2, we describe data sets and several performance criteria at section 2.3. In section 2.4, we introduce the detail of the scoring function. From section 2.5 to 2.6, we evaluate our scoring matrices as point mutation data set of DNA-binding proteins, and simulating DNA-recognizing scheme of cAMP receptor protein (CRP) complex in
Escherichia coli
2.2 Data sets preparation
2.2.1
Preparation of protein–DNA complex
The Protein Data Bank (PDB, http://www.rcsb.org/pdb/home/home.do) is a repository for the 3-D structural data of large biological molecules, such as proteins and nucleic acids [19]. The data typically obtained by X-ray crystallography or NMR spectroscopy and
submitted by biologists and biochemists from around the world. To April 24th 2009, there are 57013 PDB files have been recorded, with 1572 protein–DNA complexes.
2.2.2
Data set of thermodynamic point mutation
ProNIT database (http://gibk26.bse.kyutech.ac.jp/jouhou/pronit/pronit.html) [20] provides experimentally determined thermodynamic interaction data between proteins and nucleic acids. It contains the properties of the interacting protein and nucleic acid, bibliographic information and several thermodynamic parameters such as the binding constants, changes in free energy, enthalpy and heat capacity. To determine the contribution of a residue to protein–DNA binding affinity, point mutation is frequently used as an experimental method. Single amino acid mutations, with full structural and thermodynamic information have been considered at first. The data consist of 511 entries.
2.2.3
Data set of CRP
Since CRP isolation in the early 1970s, it has been studied in considerable detail, by many biochemical and biophysical probes. In particular, comprehensive understanding of the protein structure by X-ray crystallography has critically contributed to an insight into the CRP allostery. Up to now, more than ten 3-dimensional structure coordinates of CRP have been deposited in the Protein Data Bank (PDB), including the three different functional states of
complexes, such as CRP–cAMP (1G6N, 1I5Z, and 2GZW), CRP–cAMP–DNA (1CGP, 2CGP, 1RUN, 1J59, and 1zrc), and CRP–cAMP–DNA–RNAP (1LB2) and some mutants that are constitutively active even in the absence of cAMP.
CRP binding sequences is collect from RegulonDB [21], a model of the complex regulation of transcription initiation or regulatory network of the cell, also a model of the organization of the genes in transcription units, operons and simple and complex regulons.
2.3 Performance criteria
2.3.1
Pearson's correlation coefficient
Pearson's correlation reflects the degree of linear relationship between two numeric data. It ranges from +1 to -1. A correlation of +1 means there is a perfect positive linear relationship between those data, -1 means a perfect negative linear relationship between those data. If a correlation of 0, means there is no linear relationship between those data. If the data come from a sample, then
n i X SY Y Yi S X Xi n r 1 1 12.3.2
Student’s t-distribution (t-test)
A t-test is any statistical hypothesis test in which the test statistic has a Student's t-distribution if the null hypothesis is true. It is applied when sample sizes are small enough that using an assumption of normality and the associated t-test leads to incorrect inference. In this study, we use t-test to show that the interacting forces are significance different between van der Waals and hydrogen bonding at ∆∆G. The sample t-test statistics:
2 1 2 1 X X s X X T 2 2 2 1 2 1 2 1 n S n S sX X where 2
S is the unbiased estimator of the variance of the two samples, 1 = group one, 2 =
group two, n= number of participants.
2.4 Scoring matrices
In this section, we first introduce the residue-based binding model of a protein–DNA complex. According to the binding model, we construct eight knowledge-based scoring matrices by using crystal protein–DNA complexes.
The residue-based binding model takes the interacting amino acid-nucleotide pairs of a protein–DNA complex into consideration. For a given protein–DNA complex, the model is
usually represented as a contact profile which consists of all interaction amino acid-nucleotide pairs. To model the binding affinity of such a contact profile, Mandel-Gutfreund and Margalit proposed a knowledge-based scoring matrix where all possible amino acid-nucleotide pairs (80 pairs) and successfully modeling the binding free energy of zinc finger proteins [22].
We proposed a residue-based binding model by incorporated with two features. First, we model the interaction between side chain (and main chain) of amino acids and base (or backbone) of nucleotides, instead of just considering only side chain-base interaction. Second, we model van der Waals forces, hydrogen bonds, and electrostatic interactions between interaction pairs.
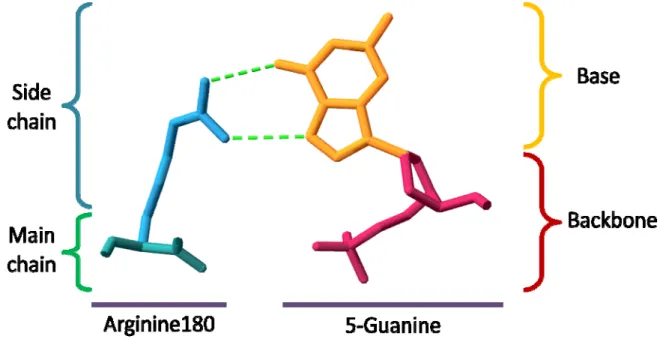
Fugure 1 shows an example of interacting residue–nucleotide pair. A guanine base is making hydrogen bonds to an arginine side chain. There are two contacts of hydrogen atoms on the arginine with oxygen or nitrogen atoms on the major groove edge of the guanine ring.
For an amino acid, the main chain atoms are the same among 20 amino acids and side chain atoms are variable. Similarly, the backbone atoms of a nucleotide (including phosphate backbone and deoxyribose sugar) are the same among four nucleic acids and base atoms are variable. In an amino acid–nucleotide pair, there are four types of interaction considering in our model, including interactions of side chain to base (SS), side chain to backbone (SB), main chain to base (MS), and main chain to backbone (MB).0
check the van der Waals force, hydrogen bond, and electrostatic interaction in each interaction by satisfying following criteria:
1. van der Waals force: If any heavy atom of X is within a distance (distance 4.5Å) of any heavy atom of Y, where X (main chain atoms, side chain atoms) and Y (base atoms, backbone atoms).
2. Hydrogen bond & electrostatic interaction: If any atom of X is formed a hydrogen bond to any atom of Y, where X (main chain atoms, side chain atoms) and Y (base atoms, backbone atoms) or formed electrostatic interaction. The hydrogen bond and electrostatic interactions were determined by using an open software HBPLUS [23].
Figure 2A shows the protein–DNA complex, CRP, a TF of E. coli (PDB code: 1zrc, helix-turn-helix motif of chain A) [24] and we take it for example to describe our residue-based binding model. For all residues of the protein (chain A) and for all nucleotides of DNA chains (chain W and chain X), we first divide the atoms of the residues into main chain groups and side chain groups (the atoms of the nucleotides are divided into base groups and backbone groups). Based on (a) and (b), we obtain van der Waals pairs of four amino acid-nucleotide interaction types (Vss, Vsb, Vms, and Vmb) and special-force (hydrogen bonding and electrostatic interaction) pairs of four amino acid-nucleotide interaction types (Sss, Ssb, Sms, and Smb). The final contact profile of the protein is shown in Figure 2B.
We select the co-crystallized protein–DNA complexes to be our matrices constructing materials as several criteria list below:
1. Resolution of crystal structures must smaller than 3.0 Å 2. DNA crystallized in complex must be double strand DNA
3. The chain of DNA-binding proteins should comprised more than 50 amino acids 4. The number of interacting residues must contact more than 5
5. We use BLASTCLUST to cluster two protein–DNA complexes as same group when their 70% amino acid sequences coverage share more than 30% sequence identity 6. Select representative proteins as aligned ratio of contact ratio
Finally, we get 349 protein-DNA complexes (listed in Table 1) to be the material for constructing our scoring matrices.
2.4.1
Aligned ratio of contact residue
In order to select representative proteins from each groups clustered by BLASTCLUST, we need to measure the protein which mostly represent of the group. We use an index, aligned ratio of contact residue (CR), for calculate the ratio between the aligned contact residues and total contact residues.
NC NAC CR sidue Conatct Re of tio aligned ra ( )
aligned in PSI-BLAST alignment.
2.4.2
Knowledge-based scoring matrices
To obtain the scoring matrices, we first generate the frequency tables of eight interaction types (shown in Figure 3). We calculate the log odds (log likelihood ratio) for each amino acid-nucleotide pair to quantitatively measure the interaction. For a amino acid(i)-nucleotide(j) pair of the tables, we obtain a score Sij by
j i ij ij p p f S ln
where fij is the frequency of the ij pair, pi is the background probability of residue i, and pj is
the background probability of nucleotide j. We use the probability of 20 amino acids occurring on protein–DNA interface to be the background probability of 20 amino acids. Same as amino acids, the background probability of 4 nucleotides also uses the probability of 4 nucleotides occurring on protein–DNA interface. Figure 4 shows the final score of eight matrices.
2.4.3
Scoring method
Our knowledge-based scoring method is used to calculate the binding affinity of a protein–DNA complex by following steps. First, we obtain the contact profile of this complex (the detail was described in section 2.4). Second, for all contact pairs in each interaction types,
were obtain the scores of all pairs from the corresponding scoring matrix of each interaction type. Finally, we use the linear combination of the eight interaction scores to show the binding affinity of the protein–DNA pair. The score of binding affinity is defined as follows:
Smb Sms Ssb Sss Vmb Vms Vsb Vss
w
S
w
S
w
S
w
S
w
S
w
S
w
S
S
w
S
1
2
3
4
5
6
7
8where w1~w8 denote the weights of each interaction scores. Figure 5 shows a flowchart of
calculating the score of protein-DNA complex.
2.5 Evaluation of scoring matrices
2.5.1
Correlation between predicting energy (score) and ∆∆G
To determine the contribution of a residue to protein–DNA binding affinity, point mutation is frequently used as an experimental method. We first collect 511 mutation data from ProNIT, a database of experimentally known observations of free-energy values of binding between DNA and wild type and mutant proteins. Only single amino-acid mutations, with full structural, thermodynamic information, and also contact with DNA have been considered in the current work. The final data consist of 70 entries. The free-energy change upon mutation has been calculated as
G(wild)
-G(mutant)
=
G
2.6 Scanning CRP binding sites with CRP crystal structure
Our model provides another view of TFBSs finding. When threading DNA sequences onto a template of TF–DNA complex, we suggest that the high-affinity DNA sequences can possibly be the TFBS of the TF. We try to identify possible TFBSs by applying our scoring function to evaluate the score of the threaded DNA sequence and TF.
We use CRP protein of E. coli, to test the capacity of our model to discriminate targets within real CRP binding sequences. We use the protein–DNA complex of CRP (PDB code: 1zrc) as a template to test our model, the flowchart of scanning CRP binding sites is present at Figure 6. We scan each CRP binding sites’ 500 base of upstream and downstream sequences by using the template and calculate the score by our model.
Chapter 3 Results and Discussions
3.1 Overview
In this chapter, we first explain the statistics difference (P-value = 0.0007) of binding energy variation between van der Waals forces and special-forces in protein–DNA interaction, then we will introduce our scoring matrices as their different interaction type, we propose a knowledge-based scoring function to describe protein–DNA interaction in biological function, which considering the contact information of the steric and specific energies. The major novelty of our scoring function is that four interaction types between residues and nucleotides (side chain to backbone, side chain to base, main chain to base, and main chain to backbone) and difference interacting force (van der Waals, hydrogen bond, and electrostatic interaction) are taken into consideration. We also test our scoring model in change of thermodynamic free energy data set, and compare our scoring matrices to the others researchers. At least, we collect 273 CRP binding sites and try to scan according to template.
3.2 Different significance of interacting forces in protein–DNA interactions
Waals interaction (usually lower than 5 kJ/mole), but weaker than covalent, or ionic bonds. This type of bond occurs in both inorganic molecules such as water and organic molecules such as DNA.
To measure binding types in protein–DNA interactions were significantly different in interacting energy or not, we try to determine contribution of the contact residues to the binding affinity. We selected 70 point mutated data from ProNIT database with known 3-D structures were listed in Table 2 which point mutation is a frequently method used as an experimental probe. Those mutated residues should position at protein–DNA interfaces and be the contact with DNA.
ProNIT gives the corresponding ΔG value representing the change in free energy of binding upon mutation to alanine or the others amino acids for each experimentally mutated residue. Generally, residues that contribute a large amount of binding energy are often labeled as hot spots of binding energy. Based on the interacting characteristics, these 70 mutated residues can be divided into two types, one including the amino acids forming hydrogen bonds or electrostatic interactions at wild-type amino acids and disappear when been mutated; the other type contact with van der Waals forces and the amino acids without missing special-forces.
The average and standard deviation of experimental ΔΔG values are 1.25 and 1.11 for 16 special-force missing residues, respectively. For 54 without special-force missing residues, the
average and standard deviation of ΔΔG values are 0.15 and 0.56, respectively. Standard two-sample t-test shows that the mean of ΔΔG values for special-force residues is significantly higher (P-value = 0.0007) than that of non-special-force residues. This result suggest that special-forces change should be more effective than the other contact residues in the interacting binding energy, and the scoring matrix could be divided according to this phenomenon, separate binding energy into van der Waals force and special-forces (hydrogen bond and electrostatic interaction ).
3.3 Scoring matrices
We constructed a residue-based binding model by incorporated with two features: first, the interaction model between side chain (and main chain) of amino acids and base edge (or backbone) of nucleotides. Second, the energy type of van der Waals force, hydrogen bond, and electrostatic interaction between interaction pairs [11]. The propensity of 20 amino acids in protein-DNA interaction is shows in Figure 7, classify as interaction types and interaction forces.
3.3.1
Protein side chain with DNA backbone (Vsb & Ssb)
proteins interact to DNA mostly using their side chain to phosphate backbone in DNA, either van der Waals force or hydrogen bonds and electrostatic interactions. This kind of interaction usually could afford nonspecific binding stabilization energy in protein–DNA interaction. Protein–DNA binding often has strong electrostatic component mediated by positively charged groups (such as Arg and Lys) on proteins and the negatively charged phosphate backbones of DNA. This interaction is predominantly nonspecific since the phosphate backbones are largely invariant along the DNA. The electrostatic interactions also help to steer the protein into the correct binding position to seek out specific interaction in the DNA grooves [25]. This matrix also shows that the different amino acids do not distinguish between the phosphate backbones atoms of the four bases.
3.3.2
Protein side chain with DNA base edge (Vss & Sss)
Specific base pair sequences in DNA can confer different structures to the backbone and there may be a specific component in this binding as well. Protein side chain with DNA base edge interactions are believed to play a key role in recognition. As for the exact nature of the Arg–base interactions, atomic studies performed on protein–DNA complex structures have shown that Arg strongly favors interaction with guanine via either hydrogen bonds, van der Waals contacts, or water-mediated hydrogen bonds [26]. Guanine contains two acceptors in its major groove that can form a pair of hydrogen bonds with the two donors of Arg and one
hydrogen bond with Lys, and indeed these interactions are very frequent. The preference for guanine over adenine and thymidine by the positively charged amino acids may be due to the relatively negative environment of this base, caused by the two acceptors. The Lys–G and Arg–G interactions are found in different families and seem to be two of the major interactions that determine specific recognition [27].
3.3.3
Protein main chain with DNA backbone (Vmb & Smb)
Overall, in main chain interactions the pyrimidines (3293) are somewhat more frequent than the purines (3037), even though not statistically significant. Comparison of the amino acid totals in this table with their distribution in all other interaction types shows that Gly, Ala, and Val participate predominantly in backbone-backbone interactions. The ‘‘preference’’ of these amino acids for protein main chain with DNA backbone interactions is obvious from their chemical nature. They lack side chain atoms with hydrogen donors or acceptors, and therefore can participate in hydrogen bonds only through their backbone atoms. Their preference over other hydrophobic amino acids may be due to their smaller size. Arginine and lysine also occur frequently, but not as frequent as in interactions that involve their positively charged side chains. The participation of Arg in this type of interaction is significantly lower than in the other types of interactions. Methionine and phenylalanine those are rare in protein–DNA interactions. Interestingly, in this type of interaction serine always makes
bifurcated hydrogen bonds with only one phosphodiester oxygen, while glutamine makes bridging contacts with two consecutive phosphodiester oxygens on the same strand of the DNA.
3.3.4
Protein main chain with DNA base edge (Vms & Sms)
Only about 6% such interactions are present in our protein–DNA complexes dataset (Figure 8). These interactions are found frequent in the small amino acids Ala and Gly. This kind of interaction only occurred in several specific DNA-binding proteins, either van der Waals forces or hydrogen bonds and electrostatic interactions.
3.3.5
Verification with experiment free energy
In order to test our scoring model on detecting binding affinity difference when amino acids change, we use the same 70 mutated data from ProNIT database with known 3-D structures as we describe in section 3.1.
These entire 70 mutated data points can separate as the character of binding energy into two groups: 48 data amino acid contact with DNA only by van der Waals force; 22 data contact DNA according to special-force, with keeping and disappearance of hydrogen bonds or electrostatic interactions. The average and standard deviation of experimental ΔΔG values are 0.91 and 1.11 for 22 special-force residues, respectively. For 48 non-special-force residues,
the average and standard deviation of ΔΔG values are 0.17 and 0.58, respectively.
We then apply our scoring matrices to these 70 data points, according to each of their crystal structure and calculate binding score difference at wild-type amino acid and after mutated. Here we show the eight single matrixes (Vss, Vsb, Vms, Vmb, Sss, Ssb, Sms, and Smb) score and the sum matrix of these eight matrices (Vss + Vsb + Vms + Vmb + Sss + Ssb + Sms + Smb) score. The correlation between scoring matrices and ΔΔG is illustrates at Figure 9. The more ΔΔG (mutated ΔG minus wild-type ΔG) positive means the mutated amino acids were more contributive to binding energy. In our scoring model, the value (mutated score minus wild-type score) would be negative if these amino acids very effect and strong bonding to DNA. According to this, the more negative of correlation means the more linear relationship between those data.
Total matrices score correlation with experiment free energy is -0.498. Among these eight scoring matrices, the side chain-backbone scoring matrixes are the best two in van der Waals and special-force (-0.473 & -0.402). These two results point out that protein side chains interacted with DNA backbones can mostly reflect the energy modification when amino acids or DNA were substituted to the others in our scoring matrices. It might cause that protein side chain with DNA backbone interactions play a key role in providing stability energy of forming protein–DNA complexes. So when amino acids were mutated, these interacting energies (van der Waals forces and special-forces) will sensitively detect the difference
between wild-types and mutations.
On the other hand, the main chain-backbone matrix is the worst (0.231) correlated scoring matrix. In our statistics data, proteins interacted to DNA were much less in this way than others. Only few amino acids participate in this type of binding model. This type of interaction might only occur in some specific proteins. Smb has no correlation data because there is no main chain-backbone contact as special-force data in our ProNIT data set.
Here we try to compare our scoring model to some other researches. Mu Gao and Jeffrey Skolnick were developed a knowledge-based scoring method, DNA-binding Domain Hunter (DBD-Hunter), for identifying DNA-binding proteins and associated binding sites in 2008. The method uses both structural comparisons and a DNA–protein statistical potential to assess whether or not a given protein binds DNA. They separate DNA into four types of functional groups were considered for DNA nucleotides. Pyrimidines C and T have the phosphate (PP), the sugar (SU) and the pyrimidine (PY) groups. In addition, purines A and G have a fourth group, the imidazole (IM) group.
Same as the contact define of van der Waals forces, DBD-Hunter define their DNA-binding protein residue as a residue with at least one heavy atom within 4.5 Å of a DNA functional group. Without consider other interaction forces, DBD-hunter only define this interacting type in protein-DNA interaction. We apply their scoring matrix to the same 70 experiment free energy data points, the correlation is -0.471, was show in Figure 9.
3.4 Detection of transcription factor binding sites
Transcription factor binding sites (TFBSs) play a major role in the regulation of gene expression. They are recognized by regulatory proteins which act upon binding as transcription repressors or activators, controlling the rate of transcription initiation. The identification of such sequences from a specific gene is therefore essential for understanding its transcription regulation.
We use our scoring matrices that will screen the upstream and the downstream region of the genes and identify binding sites for regulatory proteins. Our approach would be to base the structural binding model of proteins and DNA, and search for DNA sequences that are preferred for this binding mode. By applying our scoring matrices to specified binding models, a score that reflects the compatibility between a protein sequence and a DNA site can be evaluated. The applicability of this scheme is demonstrated for an example of binding sites that are recognized by a DNA binding protein: the E. coli CRP which recognizes the DNA via the helix-turn-helix motif. We show that the current procedure succeeds fairly well in identifying the experimentally determined binding sites.
3.4.1
Distribution of CRP binding sites
At this section, we first choose 273 CRP binding sites from RegulonDB, include 197 activator binding sites, 60 repressor binding sites, and 16 dual binding sites. The distribution
of distance from TFBSs to transcription start site (TSS) is show as Figure10.
The distributions of activator binding site regions were centralized at -40 to -100. The mechanism of CRP activation, in particular the role of different activating regions, has been studied using several well-characterized promoters. At Class I promoters, CRP binds to a DNA sequence upstream of the RNAP-binding site and makes direct protein–protein contact to αCTD via AR1 of the downstream subunit of the CRP dimer, and this interaction recruits αCTD to its DNA target immediately downstream of the CRP-binding site. At Class II promoters, CRP binds to a site overlapping the -35 hexamer and makes several contacts with RNAP: AR1 of the upstream subunit of the CRP dimer binds αCTD, AR2 of the downstream subunit of the CRP dimer binds αNTD and AR3 of the downstream subunit binds region 4 of σ70. The αCTD binds to its target upstream of the CRP site. At Class III promoters that contain tandem sites, CRP activation involves both Class I and Class II mechanisms.
The distributions of repressor binding site regions were centralized before -50, promoter region, even some were in structural gene. In addition to activation, CRP also can serve as a repressor at some promoters. There are several different mechanisms by which repressors can inhibit transcription initiation. The simplest mechanism is by blocking the interaction between RNAP and a promoter. This can occur if a binding site for a repressor protein is located overlapping the binding site for RNAP at a promoter, for example TFBSs locate over the transcription start site or the -10 hexamer.
3.4.2
Conservation of CRP binding sequences
We try to find out are there DNA-binding sites fellow some rules when CRP serve as activator, repressor, or dual. CRP functions as a dimer in the form of a CRP–cAMP complex, and regulates transcription initiation by binding to a symmetrical DNA sequence (consensus sequence 5’-AAATGTGATCTAGATCACATTT-3’). In order to arrange these TFBS sequences to this symmetrical DNA sequence, we use ClustalW to adjust these TFBS sequences’ position. ClustalW2 is a general purpose multiple sequence alignment program for DNA or proteins. We thought that TFBSs are more reliable after MSA. Then we use WebLogo to generate the sequences logos of each character of CRP binding sequences. As the Figure 11, GTG motif was more conserved when CRP serve as activator than repressor. We can see this phenomenon at the other side of symmetrical sequence (show as CAC, complementary base pairing of GTG motif). The last nucleotide adenine of TGTGA pattern was also more conserve in activator.
3.4.3
Scanning CRP TFBSs with structural template binding model
We construct a scoring matrix that consider interaction type and interaction energy, now we try to test this model on the CRP binding sequences to see how it works. First, we choose a CRP–DNA co-crystallized complex to be our template in PDB; here we select 1zrc, a wild-type CRP homodimer resolution was 2.8 Å. 1zrc is crystallized in 2006, has contact with
the most complete DNA so far, it contact with 38 base pairs of DNA.
In Figure 12, we show the interaction profile of 1zrc. Here we labeled van der Waals forces as green, hydrogen bonds and electrostatic interactions as red in each space, respectively. We also took down the interaction type between amino acids and nucleotides. For example, Arg169 interacted with 4-Thymine (first thymine of TGTGA pattern) with special-force, they contact to each other by side chain-backbone and main chain-backbone, both by van der Waals force and special-force. Another example is Glu181, it contact to 7-Guanine (second guanine of GTG motif) only by van der Waals force, Glu181 use its side chain to interact with the base edge of 7-Guanine. According to this interaction profile, when amino acids or DNA has been changed (in this section only substitute DNA) to the others, we can calculate interacting score of these new virtual protein–DNA complexes by our scoring matrices.
We then start to scan on each DNA sequences by 1zrc complex. We try to identify possible TFBSs by applying our scoring function to evaluate the score of the threaded DNA sequence and TF. Each sequence has 1022 base pairs, scanning with 1zrc DNA template model of 38 base pairs, will create 985 new binding complexes of different sequences. When threading DNA sequences onto a template of TF–DNA complex, we suggest that the high-affinity DNA sequences can possibly be the TFBS of the TF.
sequences were keeping the consensus sequence for CRP binding (5’-AAATGTGATCTAGATCACATTT-3’). The symmetrical DNA binding model can also see in this sequences logo (show in Figure 13A), especially the second guanine of GTG motif and the first cytosine of “CAC” (the symmetrical DNA sequences of GTG motif). These two DNA positions were interacted with Glu181 of CRP a-chain and b-chain through amino acids side chain to DNA base edge. In our scoring matrix of special-forces side chain base edge, glutamate was very prefer to interact with cytosine than others nucleic acids. According to binding model and scoring matrix, it might can explain that the highly conserve guanine and cytosine at these two binding sites.
On the other hand, the first thymine of TGTGA and the last adenine of TCACA were the least consensus nucleic acids in this symmetrical DNA sequence. In our interacting profile, these two nucleic acids interacted to several amino acids, respectively. The first thymine of TGTGA was contacted to Thr168, Arg169, Gln170, and Arg180 in chain A of CRP; the last adenine of TCACA was contacted to Thr168, Arg169, Gln170, Arg180, Gly200, and Ly201 in protein chain B. These amino acids were contacted mostly with their side chains to DNA backbone and several main chains; this might imply that these two nucleotides here were providing the stability for DNA binding energy. These types of interaction were not extremely preferred to which amino acids, because the DNA backbones were the same basically. So this might can explain why these two nucleotide were not as conserve as others CRP binding
sequences in TGTGA.
9 TFBSs were been ranked behind than 50%, as their DNA sequences logo show in Figure 13B, these 9 sequences did not keep the consensus sequence for CRP binding. Not only GTG motif was not conserved, but also the others nucleotides which provide the stability for DNA binding energy. Compare to our template sequence, TFBSs in these 9 sequences were very different to DNA in 1zrc. According to our binding model and scoring matrices, these sequences will get low score by their diverse nucleotides. We try to find the references of these binding sequences, some of them were annotated by CRP “putative” binding sites.
We also find discover that interacting force is different in CRP a-chain and b-chain. We try to scoring the original binding model (1zrc) by our scoring matrices, the interacting score of a-chain is 42.805, and b-chain is 37.826. We also try this little experiment on 1CGP, and this time b-chain is 46.371, is higher than a-chain 41.713. This result is very interesting that same monomer interacted to same sequences with different binding energy. We still not figure out yet how come a homodimer binding to a symmetrical DNA will have two different interacting forces? (Still need to conform)
3.4.4
The relationship between CRP binding sequences and gene
regulation
the mechanism of CRP regulate genes by binding to different TFBSs.
As show in Figure 11, GTG motif, the critical binding region of CRP binding sites, is conserve in activator and less in repressor. The amino acid Glu181 we discussed in 3.4.3 is the only contact residue that interacted to the second guanine of GTG motif and the first cytosine of “CAC”. Furthermore, this amino acid uses the side chain contact to DNA base edge (specific for reorganization), and forming hydrogen bond. This might imply the importance of this guanine and cytosine is specific for regulation. When the DNA here from GC pair turns into other AT pair, the preference (shows in Figure 4) of interaction with Glu181 will decrease.
The middle thymine of GTG motif did not change their conservation as much as other two guanines. The interaction forces forming here were all side chain–base in van der Waals forces. In our scoring matrix of Vss, the contact residues Arg180, Glu181, and Arg 185 is slightly prefer to contact with GC pair.
Although we can infer several part of relationship between CRP binding sites and gene regulation by our binding model and scoring matrices, but still far away from to explain the whole mechanism of CRP gene regulation.
Chapter 4 Conclusions
4.1 Summary
Based on the concept of separating interacting type and forces, we develop a new scoring matrix to predict protein-DNA interactions. In this study, we get some critical conclusion as follows:
1. We proposed a structure template-based method which used a functional group scoring matrices to identify potential protein-DNA interactions. The method also reveals the structure information of identified protein-DNA binding partners.
2. This scoring function could achieve good agreement for the binding affinity in protein–DNA interactions. The predicting scoring has batter correlation with experimental ΔΔG than original general matrix which doesn’t consider the difference between van der Waals forces and special-forces (hydrogen bond and electrostatic interaction). This model also successfully identified of several CRP binding sites.
4.2 Future works
Our scoring matrices consider considering the contact information of the steric and specific energies, but still not perfect. Several works might be able to improve our method to be better:
1. The weights of each term in our proposed scoring method will be obtained a good parameter sets by machine learning approach like genetic algorithm (GA), neural network (NN), or support vector machines (SVM).
2. For detecting possible transcription factor binding sites, more transcription factors which have crystal structures of protein-DNA complexes will be used to as the template. The high-score region predicted by our scoring method in promoter regions will be further verified.
3. Consider the occurrences number of interaction pairs, since that multiple hydrogen bonds has been observed appear in several cases. We roughly test this consideration in to ProNIT free energy data set, the performance is improve from -0.498 to -0.525.
REFERENCE
1. Hannenhalli S, Levy S: Predicting transcription factor synergism. Nucleic Acids
Res 2002, 30(19):4278-4284.
2. Smith AD, Sumazin P, Das D, Zhang MQ: Mining ChIP-chip data for transcription factor and cofactor binding sites. Bioinformatics 2005, 21 Suppl 1:i403-412.
3. Simon I, Barnett J, Hannett N, Harbison CT, Rinaldi NJ, Volkert TL, Wyrick JJ, Zeitlinger J, Gifford DK, Jaakkola TS et al: Serial regulation of transcriptional regulators in the yeast cell cycle. Cell 2001, 106(6):697-708.
4. Wasserman WW, Sandelin A: Applied bioinformatics for the identification of regulatory elements. Nat Rev Genet 2004, 5(4):276-287.
5. Tsai HK, Huang GT, Chou MY, Lu HH, Li WH: Method for identifying transcription factor binding sites in yeast. Bioinformatics 2006, 22(14):1675-1681. 6. Liu XS, Brutlag DL, Liu JS: An algorithm for finding protein-DNA binding sites
with applications to chromatin-immunoprecipitation microarray experiments.
Nat Biotechnol 2002, 20(8):835-839.
7. Stormo GD: DNA binding sites: representation and discovery. Bioinformatics 2000, 16(1):16-23.
8. Hoglund A, Kohlbacher O: From sequence to structure and back again: approaches for predicting protein-DNA binding. Proteome Sci 2004, 2(1):3.
9. Pabo CO, Sauer RT: Protein-DNA recognition. Annu Rev Biochem 1984, 53:293-321. 10. Matthews BW: Protein-DNA interaction. No code for recognition. Nature 1988,
335(6188):294-295.
11. Mandel-Gutfreund Y, Schueler O, Margalit H: Comprehensive analysis of hydrogen bonds in regulatory protein DNA-complexes: in search of common principles. J
Mol Biol 1995, 253(2):370-382.
12.
Brooker RJ
:Genetics: analysis and principles
.2005
.13. Wang D, Meier TI, Chan CL, Feng G, Lee DN, Landick R: Discontinuous movements of DNA and RNA in RNA polymerase accompany formation of a paused transcription complex. Cell 1995, 81(3):341-350.
14. Guo F, Gopaul DN, van Duyne GD: Structure of Cre recombinase complexed with DNA in a site-specific recombination synapse. Nature 1997, 389(6646):40-46.
15. Buck MJ, Lieb JD: ChIP-chip: considerations for the design, analysis, and application of genome-wide chromatin immunoprecipitation experiments.
Harbison CT, Thompson CM, Simon I et al: Transcriptional regulatory networks in Saccharomyces cerevisiae. Science 2002, 298(5594):799-804.
17. Kono H, Sarai A: Structure-based prediction of DNA target sites by regulatory proteins. Proteins 1999, 35(1):114-131.
18. Havranek JJ, Duarte CM, Baker D: A simple physical model for the prediction and design of protein-DNA interactions. J Mol Biol 2004, 344(1):59-70.
19. Berman HM, Westbrook J, Feng Z, Gilliland G, Bhat TN, Weissig H, Shindyalov IN, Bourne PE: The Protein Data Bank. Nucleic Acids Res 2000, 28(1):235-242.
20. Kumar MD, Bava KA, Gromiha MM, Prabakaran P, Kitajima K, Uedaira H, Sarai A: ProTherm and ProNIT: thermodynamic databases for proteins and protein-nucleic acid interactions. Nucleic Acids Res 2006, 34(Database issue):D204-206.
21. Gama-Castro S, Jimenez-Jacinto V, Peralta-Gil M, Santos-Zavaleta A, Penaloza-Spinola MI, Contreras-Moreira B, Segura-Salazar J, Muniz-Rascado L, Martinez-Flores I, Salgado H et al: RegulonDB (version 6.0): gene regulation model of Escherichia coli K-12 beyond transcription, active (experimental) annotated promoters and Textpresso navigation. Nucleic Acids Res 2008, 36(Database issue):D120-124.
22. Mandel-Gutfreund Y, Margalit H: Quantitative parameters for amino acid-base interaction: implications for prediction of protein-DNA binding sites. Nucleic
Acids Res 1998, 26(10):2306-2312.
23. McDonald IK, Thornton JM: Satisfying hydrogen bonding potential in proteins. J
Mol Biol 1994, 238(5):777-793.
24. Napoli AA, Lawson CL, Ebright RH, Berman HM: Indirect readout of DNA sequence at the primary-kink site in the CAP-DNA complex: recognition of pyrimidine-purine and purine-purine steps. J Mol Biol 2006, 357(1):173-183. 25.
Revzin A
:The Biology of nonspecific DNA-protein interactions
. 1990. 26. Luscombe NM, Laskowski RA, Thornton JM: Amino acid-base interactions: athree-dimensional analysis of protein-DNA interactions at an atomic level. Nucleic
Acids Res 2001, 29(13):2860-2874.
27. Lilley DMJ: Understanding DNA - the Molecule and How It Works - Calladine,Cr, Drew,Hr. Nature 1994, 367(6461):330-331.
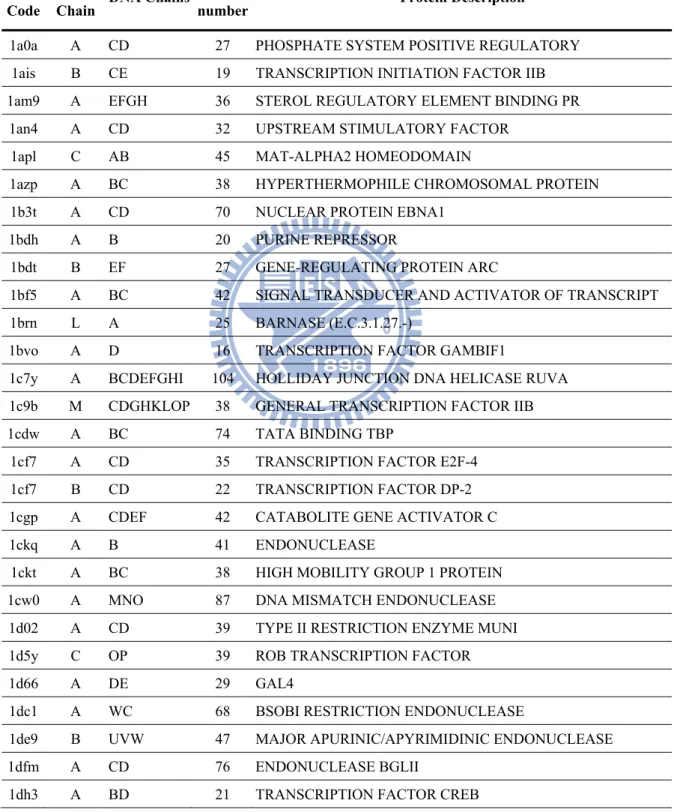
Table 1. List of the representative protein-DNA complex structure set. Each entry is provided with the four-digit PDB code, the protein chain identifier, the chain identifiers of dsDNA to which the protein is bound, the contact number , and the description of the protein.
PDB Code
Protein
Chain DNA Chains
Contact
number Protein Description
1a0a A CD 27 PHOSPHATE SYSTEM POSITIVE REGULATORY 1ais B CE 19 TRANSCRIPTION INITIATION FACTOR IIB 1am9 A EFGH 36 STEROL REGULATORY ELEMENT BINDING PR
1an4 A CD 32 UPSTREAM STIMULATORY FACTOR 1apl C AB 45 MAT-ALPHA2 HOMEODOMAIN
1azp A BC 38 HYPERTHERMOPHILE CHROMOSOMAL PROTEIN 1b3t A CD 70 NUCLEAR PROTEIN EBNA1
1bdh A B 20 PURINE REPRESSOR
1bdt B EF 27 GENE-REGULATING PROTEIN ARC
1bf5 A BC 42 SIGNAL TRANSDUCER AND ACTIVATOR OF TRANSCRIPT 1brn L A 25 BARNASE (E.C.3.1.27.-)
1bvo A D 16 TRANSCRIPTION FACTOR GAMBIF1
1c7y A BCDEFGHI 104 HOLLIDAY JUNCTION DNA HELICASE RUVA 1c9b M CDGHKLOP 38 GENERAL TRANSCRIPTION FACTOR IIB 1cdw A BC 74 TATA BINDING TBP
1cf7 A CD 35 TRANSCRIPTION FACTOR E2F-4 1cf7 B CD 22 TRANSCRIPTION FACTOR DP-2 1cgp A CDEF 42 CATABOLITE GENE ACTIVATOR C
1ckq A B 41 ENDONUCLEASE
1ckt A BC 38 HIGH MOBILITY GROUP 1 PROTEIN 1cw0 A MNO 87 DNA MISMATCH ENDONUCLEASE 1d02 A CD 39 TYPE II RESTRICTION ENZYME MUNI 1d5y C OP 39 ROB TRANSCRIPTION FACTOR
1d66 A DE 29 GAL4
1dc1 A WC 68 BSOBI RESTRICTION ENDONUCLEASE
1de9 B UVW 47 MAJOR APURINIC/APYRIMIDINIC ENDONUCLEASE 1dfm A CD 76 ENDONUCLEASE BGLII
PDB Code
Protein
Chain DNA Chains
Contact
number Protein Description
1diz A EF 36 3-METHYLADENINE DNA GLYCOSYLASE II 1dmu A F 46 BGLI RESTRICTION ENDONUCLEASE
1dnk A BC 40 DEOXYRIBONUCLEASE I (DNASE I)
1dp7 P D 20 MHC CLASS II TRANSCRIPTION FACTOR HRFX1 1dux C AB 44 ETS-DOMAIN PROTEIN ELK-1
1emh A BC 23 URACIL-DNA GLYCOSYLASE 1eoo A CD 66 TYPE II RESTRICTION ENZYME ECORV 1eyg C Q 82 SINGLE-STRAND DNA-BINDING PROTEIN 1f0v B N 11 RIBONUCLEASE A
1f2i H AB 42 FUSION OF N-TERMINAL 17-MER PEPTIDE EXTENSION 1f4k B DE 43 REPLICATION TERMINATION PROTEIN
1f6o A DE 38 3-METHYL-ADENINE DNA GLYCOSYLASE 1fiu D GKHL 54 TYPE II RESTRICTION ENZYME NGOMI 1fok A BC 107 FOKI RESTRICTION ENDONUCLEAS 1fos F AB 22 C-JUN PROTO-ONCOGENE PROTEIN
1fzp B WK 8 STAPHYLOCOCCAL ACCESSORY REGULATOR A 1gd2 E AB 33 TRANSCRIPTION FACTOR PAP1
1gm5 A XYZ 46 RECG
1gt0 D AB 61 TRANSCRIPTION FACTOR SOX-2
1gxp F GH 47 PHOSPHATE REGULON TRANSCRIPTIONAL REGULATORY 1h88 B DE 29 CCAAT/ENHANCER BINDING PROTEIN BETA
1h88 C DE 50 MYB PROTO-ONCOGENE PROTEIN 1h9d A EF 35 CORE-BINDING FACTOR ALPHA SUBUNIT1
1h9t A XY 50 FATTY ACID METABOLISM REGULATOR PROTEIN 1hbx G CW 46 ETS-DOMAIN PROTEIN ELK-4
1hdd C AB 38 ENGRAILED HOMEODOMAIN
1hf0 A MN 69 OCTAMER-BINDING TRANSCRIPTION FACTOR 1 1hht P D 49 P2 PROTEIN
1hlv A BC 97 MAJOR CENTROMERE AUTOANTIGEN B 1hut H D 20 ALPHA-THROMBIN
1hwt C EF 9 HEME ACTIVATOR PROTEIN 1hwt D AB 38 HEME ACTIVATOR PROTEIN
1i3j A BC 114 INTRON-ASSOCIATED ENDONUCLEASE 1 1i6j A BC 16 REVERSE TRANSCRIPTASE
PDB Code
Protein
Chain DNA Chains
Contact
number Protein Description
1ign A CD 124 RAP1
1iu3 F ABDE 42 SeqA protein
1ixy A CE 37 DNA beta-glucosyltransferase
1j1v A BC 50 Chromosomal replication initiator protein dna 1jb7 A D 60 telomere-binding protein alpha subunit 1jb7 A GH 9 telomere-binding protein alpha subunit
1jey A CD 29 Ku70
1jey B CD 41 Ku80
1jfi A DE 9 Transcription Regulator NC2 alpha chain 1jfi B DE 22 Transcription Regulator NC2 beta chain 1jj6 C AB 42 DNA-INVERTASE HIN
1jmc A B 50 REPLICATION PROTEIN A (RPA)
1jt0 A EF 37 HYPOTHETICAL TRANSCRIPTIONAL REGULATOR IN QAC 1k3w A BC 34 Endonuclease VIII
1k78 I CDGH 41 Paired Box Protein Pax5
1k82 A FJ 8 formamidopyrimidine-DNA glycosylase 1keg H A 8 Anti-(6-4) photoproduct antibody 64M-2 Fab 1keg L A 11 Anti-(6-4) photoproduct antibody 64M-2 Fab 1ksp A B 15 DNA POLYMERASE I-KLENOW FRAGMENT 1ksx A CG 22 REPLICATION PROTEIN E1
1ku7 A BC 32 sigma factor sigA 1kx3 A IJ 67 histone H3 1kx3 C IJ 33 histone H2A.1
1l3l A FH 29 Transcriptional activator protein traR 1l3t A BC 93 DNA Polymerase I
1lb2 B KJ 20 DNA-directed RNA polymerase alpha chain 1lmb 4 12 42 LAMBDA REPRESSO
1lq1 D EF 44 Stage 0 sporulation protein A 1lws A BC 100 ENDONUCLEASE PI-SCEI 1m07 A CD 24 Ribonuclease
1m18 H IJ 28 Histone H2B.1
1m3q A BC 46 8-oxoguanine DNA glycosylase 1m6x B EIFJGH 92 Flp recombinase
PDB Code
Protein
Chain DNA Chains
Contact
number Protein Description
1mje A C 40 breast cancer 2
1mjq H KL 25 METHIONINE REPRESSOR 1mm8 A BC 76 Tn5 Transposase
1mow A BCEF 166 chimera of homing endonuclease I-DmoI and DNA 1mvm A BC 8 MURINE MINUTE VIRUS COAT PROTEIN) 1mw8 X Y 46 DNA Topoisomerase I
1mwi A D 6 G/U mismatch-specific DNA glycosylase 1n3f B CDEF 90 DNA endonuclease I-CreI
1n6j B CD 31 Myocyte-specific enhancer factor 2B 1nkp B FG 28 Max protein
1nlw A FG 25 MAD PROTEIN
1noy B S 20 DNA POLYMERASE (E.C.2.7.7.7)
1odh A CD 42 MGCM1
1oe6 B EF 11 SINGLE-STRAND SELECTIVE MONOFUNCTIONAL URACIL 1oh6 A EF 63 DNA MISMATCH REPAIR PROTEIN MUTS
1orp A BC 44 Endonuclease III 1osb A B 116 TrwC protein
1otc B D 18 TELOMERE-BINDING PROTEIN BETA SUBUNI 1owf B CDE 50 Integration Host Factor beta-subunit
1owr P EF 48 Nuclear factor of activated T-cells, cytoplas 1ozj B CD 22 SMAD 3
1p3l F IJ 28 Histone H4 1p7d B EF 103 Integrase
1pgz A B 40 Heterogeneous nuclear ribonucleoprotein A1 1pp8 F EIYKTRJG 50 39 kDa initiator binding protein
1pv4 A G 17 Transcription termination factor rho 1pvi A CD 52 PVUII (E.C.3.1.21.4)
1pvq B CD 128 Recombinase CRE
1pyi A DE 22 PYRIMIDINE PATHWAY REGULATOR 1 1q9x D HL 78 DNA polymerase
1qbj A DE 18 DOUBLE-STRANDED RNA SPECIFIC ADENOSI 1qp4 A M 23 PURINE NUCLEOTIDE SYNTHESIS REPRESSO
1qpi A M 9 TETRACYCLINE REPRESSOR 1qrv A CD 42 HIGH MOBILITY GROUP PROTEIN D 1qum A BCD 54 ENDONUCLEASE IV