Research of Color Distribution Index in CIEL*a*b* Color Space
Wei-De Jeng
a, Ting-Wei Huang*
b, Mang Ou-Yang
a, Tsang-Hsing Lee
c, Yao-Fang Hsieh
b, and
Yi-Ting Kuo
d,ea
Department of Electrical Engineering, National Chiao Tung University, Taiwan;
b
Institute of Optical Sciences, National Central University, Taoyuan County, Taiwan;
cS/W Development Division Display B.U. I, Wistron Corporation, Taiwan;
d
Institute of Applied-Arts , National Chiao-Tung Univ., Hsihchu city, Taiwan;
eJen-Teh Junior College of Medicine, Nursing and Management, Miaoli County, Taiwan.
ABSTRACT
The index for evaluating the ability of color reproduction is required. The color distribution index (CDI) was proposed to comment the display ability of color distribution of reproduction in CIE Lu'v' color space. A cell of Just Noticeable Difference (JND) for luminance and chromaticity (u'v') was proposed to qualify whether the reproduced colors are in some region of color volume of display. Human eye can perceive fewer colors at low luminance, however, the scalar of chromaticity (u'v') JND at low luminance was the same with the one at other luminance. CDI will be distorted at low luminance. In this paper, regarding perceptible vision at low luminance, we try to use chromaticity (a*b*) JND to replace chromaticity (u'v') JND. The color distribution will be discussed in CIE La*b* color space. We find that CDI at low luminance in CIE L*a*b* color space is higher than in CIE Lu'v' color space, as well as different gamma curves and different bit depths affect CDI. The displays are going to keep approaching 100% true color reproduction; hence the index for evaluating the ability of color reproduction is required.
Keywords: color, color distribution index, gamma curve, bit depth.
1. INTRODUCTION
The color distribution index (CDI) was proposed to be used as a new image quality evaluation index by Toshiyuki Fujine1. Color gamut, contrast ratio, maximum luminance, gamma characteristics, and Just Noticeable Difference (JND)2
as human visual system affect CDI to qualify the ability for reproducing visually smooth gradation. The Weber fraction is well known as luminance JND3 as Fig.1 showing.
The relation between the luminance L of background as adaptation luminance and Luminance JND ΔL were that when L > 10 cd/m2, then logΔL/L≈ -2 (constant), when 0.01 cd/m2 < L < 10 cd/m2, then logΔL/L increases gradually as logΔL
decreases, and logΔL/L=-0.7, when L < 0.01 cd/m2, then logΔL/L increase more. Then Toshiyuki Fujine1 confirmed that
Weber Fraction is also effective on FPD TV, and in the luminance rang of 0.5-100 cd/m2, logΔL/L=-2 could be applied.
In other words, luminance JND could be used independently of chromaticity under the condition logΔL/L=0.01 as the luminance L rang of 0.5-100 cd/m2. Moreover, the Toshiyuki Fujine’ experiments revealed that chromaticity JND was
almost independent to luminance, and they defined that chromaticity JND as Δu' v' =0.001 for the CDI calculation. Because CDI which does not set 100% reference white, an evaluation method using absolute luminance value was proposed. The purpose of CDI is to evaluate the distribution of colors which TV set can reproduce in 3D color space as Fig.2 showing. The reproducible color gamut was divided by luminance JND and chromaticity JND and each cell was checked whether it includes one or more reproduced color or not. Then CDI was defined as the percentage of the cells which include reproduced colors. If all cells include reproduced colors, the system has ability to reproduce high image quality without any false contours.
Figure 2. CDI cell in Lu'v' color space.
Finally, the CDI cell was defined as such conditions, luminance JND was ΔL/L = 0.01 was and chromaticity JND was Δu' v' =0.001 in CIE Lu'v' color space. Under CIE Lu'v' color space, the CDI of TV set designed based on BT.709 with 12 bit and 3000:1 contrast ratio would come to 100% , which CDI cell was defined as such conditions that Luminance JND was logΔL/L=0.01 as L> 0.5 cd/m2 and Chromatic JND was Δu'v'=0.001 as L > 1 cd/m2.
However, the chromaticity JND choose Δu' v' in CIE Lu'v' color space rather ΔEa*b* in CIE L*a*b* because 100% reference white had to be set as the reference background and it was difficult to apply the result to the case of severe condition like observinglow APL pictures in dark room4. If these problem could be solved, the performance of CDI will
different by using ΔEa*b* because CIE L*a*b* color space is more uniform.
2. SIMULATION MODULE
The CDI cell sets in 3D space as Fig. 3 showing. The luminance JND still is ΔL/L = 0.01 and uses absolute luminance value. However, the chromaticity JND uses ΔEa*b* in La*b* color space, the 100% reference white is the total white luminance when the red, green, blue channels are set 100%. The color volume and color point have to transform from CIE Lu'v' color space to La*b* color space using (1) and (2), where X, Y, Z are the tristimulus values, and Xn, Yn, Zn
are the tristimulus values of the reference white.
L- JND
u’v’- JND
u’
v’
L
CDI cell
⎪
⎪
⎩
⎪⎪
⎨
⎧
+
+
−
=
+
+
=
+
+
−
=
+
+
=
3
12y
2x
9y
3Z
15Y
X
9Y
v'
3
12y
2x
4x
3Z
15Y
X
4X
u'
(1)(
)
(
)
[
]
(
)
(
)
[
]
⎩
⎨
⎧
−
=
−
=
1/3 n 1/3 n 1/3 n 1/3 nZ/Z
Y/Y
200
b*
Y/Y
X/X
500
a*
(2)Figure 3. CDI cell in La*b* color space.
The chromaticity a*b* is dependent on luminance L and the color gamut5,6 at low luminance condition is less than the
one at the medium luminance as Fig. 4 showing. The bit depth, color gamut, gamma curve, and cell width will discuss at the following section.
Figure 4. Color volume shell in L*a*b* color space.
L- JND
a*b*- JND
a*
b*
L
3. SIMULATIONS AND RESULTS
3.1 Bit depth
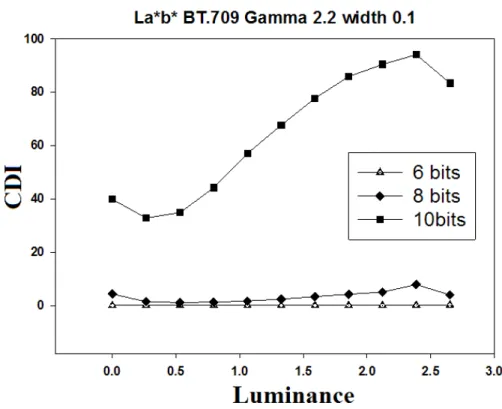
The bit depth will affect the color number of reproduction. More bit depth will produce more color number as Fig. 5 showing. When the CDI is discussed in different bit depth using our module that luminance JND still is ΔL/L = 0.01 and the chromaticity JND uses ΔEa*b* in La*b* color space, the results are showing in the Fig. 6. The simulations are in the condition that color gamut reproduction is BT.709 standard, gamma value is 2.2, and chromaticity JND ΔEa*b* is 0.1. In Fig. 6, it’s well known that the higher bit depth has higher CDI. Therefore, more color number will more possible to fill up all CDI cell. In other words, the color reproduction ability of TV will better as the bit depth increasing.
Figure 5. The relation between bit depth and color points.
Figure 6. The simluations between CDI and Luminance in La*b* color space at BT. 709, gamma value 2.2, cell width 0.1.
3.2 Color gamut
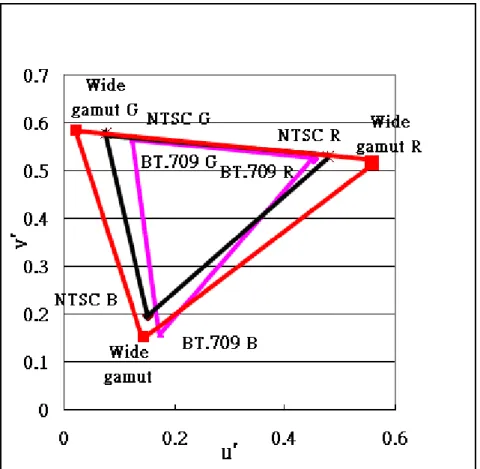
Different color gamut has different tri-primary color chromaticity. However, tri-primary color chromaticity affects the color volume shell. In other words, different color gamut has different region of the color distribution. For examples, three standards of color gamut, BT.709, NTSC, and Wide Gamut are widely using. The color gamut of these three standards is showing in Fig.7. The relation of these three color gamut is BT.709<NTSC<Wide Gamut. And their color chromaticity are showing at Table. 1.
Figure 7. The color gamut of the tree standard, BT.709, wide gamut, NTSC.
Table 1. The tri-primary color chromaticity and white point of the tree standard, BT.709, wide gamut, NTSC.
R G B W
u' v' u' v' u' v' u' v'
BT.709 0.451 0.523 0.125 0.563 0.175 0.158 0.198 -0.468
NTSC 0.477 0.528 0.076 0.576 0.152 0.196 0.198 0.468
Wide
gamut 0.556 0.517 0.023 0.584 0.144 0.151 0.198 0.468
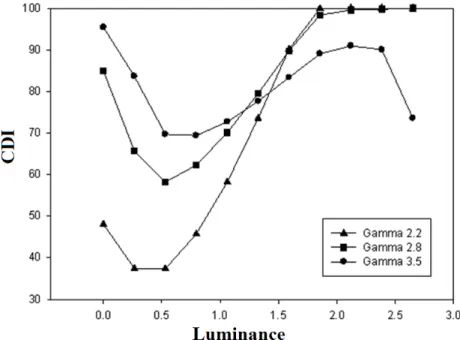
3.3 Gamma curveThe gamma value affects the gray level of one channel. The gamma value is more higher, then the low level will more levels as Fig. 8 showing. In other words, the image will more shape in low luminance. Then we discuss CDI with different gamma value, 2.2, 2.8, and 3.5, using our module that luminance JND still is ΔL/L = 0.01 and the chromaticity JND uses ΔEa*b* in La*b* color space, the results are showing in the Fig. 9.
Figure 8. The simluations between gray level and luminance.
Figure 9. The simluations between CDI and Luminance in La*b* color space with gamma value 2.2, 2.8, and 3.5.
3.4 Cell width
Cell width is meaning chromaticity JND uses ΔEa*b* here. Although the chromaticity JND in Lu'v' color space is almost constant Δu'v'=0.001 as L > 1 cd/m2, it is not a constant at different L in La*b* color space. Therefore, CDI with
different Cell width using our module that luminance JND still is ΔL/L = 0.01 and the chromaticity JND uses ΔEa*b* in La*b* color space, the results are showing in the Fig. 10. The CDI cell widths are varying for 0.1 to 1. The simulations are in the conditions that gamma value is 2.2 and bit depth is 8 bit. It is well know the CDI will be better as cell width bigger. While the CDI are discussed with 7~11 bit and cell width 0.1 as Fig. 11 showing, the CDI with 12 bit will come to 100%. While the CDI are discussed with 10bit, gamma value, 1, 2.2, 2.8, 3.5 and cell width, 0.1, 0.2, as Fig. 12 showing, the CDI with gamma 3.5 will come to 100%.
Figure 10. The simluations between CDI and Luminance in La*b* color space with width 0.1 ~ 3.5.
Figure 11. The simluations between CDI and Luminance in La*b* color space with bit depth 7 ~ 11.
Figure 12. The simluations between CDI and Luminance in La*b* color space with gamma value 1.0, 2.2, 2.8, 3.5, and width 0.1, 0.2.
4. DISCUSSION AND CONCLUSION
In previous paper, the chromaticity JND choose Δu' v' in CIE Lu'v' color space rather ΔEa*b* in CIE L*a*b* because 100% reference white had to be set as the reference background and it was difficult to apply the result to the case of severe condition like observinglow APL pictures in dark room4. However, if these problem could be solved, the
performance of CDI will different by using ΔEa*b* because CIE L*a*b* color space is more uniform. We simulated the CDI with 7~11 bit and cell width 0.1 as Fig. 11 showing, and the CDI with 12 bit will come to 100%. The CDI are simulated with 10bit, gamma value, 1, 2.2, 2.8, 3.5 and cell width, 0.1, 0.2, as Fig. 12 showing, and the CDI with gamma 3.5 will come to 100%. The CDI at low luminance in CIE La*b* color space is higher than in CIE Lu'v' color space, as well as different gamma curves and different bit depths affect CDI. The displays would keep approaching 100% true color reproduction with appropriate bit depth and gamma curve.
ACKNOWLEDGMENT
This work is supported by the National Science Council of Taiwan under the projects NSC 98-2221-E-009-184- and NSC 98-2622-E-009-186-CC1.
REFERENCES
[1] Fujine, T., Kanda, T., Yoshida, Y., Sugino, M., Teragawa, M., Yamamoto, Y., and Ohta, N. "Bit Depth Needed for High Image Quality TV-Evaluation Using Color Distribution Index," Journal of Display Technology 4(3), 340-347 (2008).
[2] Luo, M.R., Cui, G.,and Rigg, B.,"The development of the CIE2000 colour-difference formula: CIEDE2000," Color Research and Application 26(5), 340-350 (2001).
[3] USD Internet Sensation & Perception Laboratory, “Weber's Law of Just Noticeable Differences,”
http://www.usd.edu/psyc301/WebersLaw.htm, (2003).
[4] Yoshida, Y. and Yamamoto, Y., "High quality LCD imaging system—Beyond 8 bits," Proc. PICS2002, 35-41 (2002).
[5] Huang, S.-W. And Ou-Yang, M., "Design Considerations Between Color Gamut and Brightness for Multi-Primary Color Displays," Journal of Display Technology 3(1), 71-82 (2007).
[6] Huang, S.-W. And Ou-Yang, M., "Gamut boundary description for one dependent primary color," Opt. Soc. Am. A 26(10), 2163-2171 (2009)