in Hemodialysis Patients
1
Fang-Yu Lin MS, RN
2
Kwua-Yun Wan PhD, RN, Professor
*3
Tso-Hsiao Chen PhD, MD, Associate Professor
4
Kuan-Chia Lin, PhD, Associate Professor,
5
Wu-Chang Yang, BS,MD, PhD, Associate Professor
1Department of Nursing, Wan Fang Hospital, Taipei Medical University
and Graduate Institute of Nursing, National Defense Medical Center
2Deputy Director, Department of Nursing, Taipei Veterans General Hospital,
School of Nursing, National Defense Medical Center
3Department of Nephrology, Wan Fang Hospital, Taipei Medical University 4School of Nursing, National Taipei University of Nursing and Health Science
5 Department of Nephrology, Taipei Veterans General Hospital
July 2012
Outline
v
Introduction
v
Research Purpose
v
Research Framework
v
Material and Methods
v
Results
v
Conclusion
Introduction
Sleep Quality and Related Factors
in Hemodialysis Patients
Introduction
v
Sleeping problems affect
50%~80%
in hemodialysis patients.
(Basto et al., 2007; Chen et al., 2006)
v
Sleep quality is an important predictor
of health status, quality of
life and survival rate.(Elder et al., 2008)
v
There were few research
showing the influential factors related to
United States Renal Data System.(2011).Annual Data Report Retrieved May 21,2012, From http://www.usrds.org/atlas.aspx
Prevalence & incidence worldwide
Taiwan
Taiwan has the
highest prevalence
of ESRD in the world
Taiwan has the second highest incidence rate of ESRD in the world
Research Purpose
Sleep Quality and Related Factors
in Hemodialysis Patients
Sleep Quality and Related Factors
in Hemodialysis Patients
The purpose of the study was to investigate
sleep quality and related factors
in hemodialysis
Research Framework
Sleep Quality and Related Factors
in Hemodialysis Patients
Definition of Terms
v
Hemodialysis Patients
ì
Diagnosed
ESRD
by a nephrology doctor and receiving
hemodialysis therapy
v
Regular Use Hypnotic Agents
ì
Participants who had regular
regularly used hypnotics
more than
3 times per week
to aid sleep.
.
v
Physical Status
ì
RLS, EDS, high risk of SA and laboratory data
(BUN,
Creatinine,Albumin, Hb, Phosphate)
v
Mental Status
Mental status Depression Demographics Age (years) Sex Smoking Drinking Hypnotic agents Illness Characteristics Hemodialysis duration Dialysis shift Kt/V Comorbidity
Sleep Quality and Related Factor
in Hemodialysis Patients Framework
Essential Attributes
Physical Status
RLS, EDS, high risk of SA
Laboratory data
(BUN, Creatinine, albumin, Hb, P)
Sleep quality
Material and Methods
Sleep Quality and Related Factors
in Hemodialysis Patients
Material and Methods
Study Design
v
Cross-sectional, purposive
and
correlation
design.
v
Sample Size:
n=170
(01/03/2011~30/04/2011)
ì
Subject were recruited from
outpatient
hemodialysis centers of
2 medical centers in Taipei City.
v
Ethical considerations
ì
Before starting this study, researchers obtained
IRB approvals
from the administrative departments of both medical centers.
ì
Participants signed a written
consent form
and
Material and Methods
Participants population (
Inclusion Criteria
)
þ
Diagnosed with ESRD
by nephrologist.
þ
Hemodialysis patient
20 years of age or
older
and
mentally competent
.
þ
Every week receives
two or three convention hemodialysis
treatments for three or more months.
þ
Can communicate in
Mandarin or Taiwanese languages
.
þ
Patient or caregiver
is willing to participate
in the
study and
sign the
consent form
.
Material and Methods
Participant Population (
Exclusion Criteria
)
ý
Hospitalized
hemodialysis patient
within the past month
.
ý
Hemodialysis patient had
mental disturbance, blindness or
dementia.
ý
Hemodialysis patient
refuses
to be interviewed or to fill out
Material and Methods
v
Participants answered structured questionnaires
including
:
ì
Demographic questionnaire
ì
International restless legs scale (IRLS):
RLS (
Yes/No
)
ì
Epworth sleepiness scale (ESS) :
EDS (
Yes/No
)
ì
Berlin’s Questionnaire:
Risk for sleep apnea (
Yes/No
)
ì
The Beck depression inventory-II (BDI-II):
Depression (
Yes/No
)
ì
Chinese version of the Pittsburgh sleep quality index (CPSQI):
Sleep quality (
Good /Poor
)
vv
Illness characteristics
and
laboratory data
from dialysis centers
Material and Methods
v
Statistical Analysis:
SPSS, version 18.0
ì
A
p value
of
< 0.05
was considered statistically significant.
v
Descriptive statistic (frequency/percentage/mean± SD)
v
Inferential statistic
ì
Chi-square (χ
2) test or independent t-test
ì
Stepwise regression
:
Find the most important
sleep quality
variables
in hemodialysis patients
ì
Hierarchical logistic regression (combined with stepwise
regression procedure)
:
find out
the most important independent
Results
Sleep Quality and Related Factors
in Hemodialysis Patients
Results
v
Demographic characteristics of participants
ì
Data was collected from March 2011 to April 2011(N=170)
1)
The mean
age
of the participants was
62.6
years (SD, 14.56
years)
2)
The sample consisted of 88
men (51.2%)
and
82 women (48.2%
)
3)
10.6% of the participants smoked cigarettes
4)
Alcohol consumption was extremely low (5.9%)
5)
35.3%
of participants had
regularly used hypnotics
to aid sleep
(Table1)
Characteristic Category n % Range Mean SD Age(years) 20~30 5 2.9% 20-91 62.58 14.56 31 ~40 6 3.5% 41~50 24 14.1% 51~60 46 27.1% 61~70 37 21.8% 71~80 32 18.8% ≧81 20 11.8% Sex Female 82 48.2% male 88 51.2% Smoking No 152 89.4% Yes 18 10.6% Drinking alcohol No 160 94.1% Yes 10 5.9% Hypnotic No 110 64.7% Yes 60 35.3%
Elderly person
1/3
Hypnotic
Table 2 illness characteristics of the sample (n=170)
Characteristic Category n % Range Mean SD
Dialysis duration 0.25-23.25 5.13 4.44 3 months~1year 30 17.6% >1 year~10years 113 66.5% >10years 27 15.9% Dialysis shifts Morning 53 31.2% Afternoon 57 33.6% Evening 60 35.3% Kt/V index 0.65~2.63 1.65 0.33 Comorbidity 0 23 13.5% 1 44 25.9% 2 60 35.3% ≥3 43 25.3%
dialysis shifts
(morning, afternoon
and evening)
are
Results
vClinical manifestations of hemodialysis patients
ì
41.8%
of participants had
high risk for sleep apnea
ì
34.1%
of participants had
daytime sleepiness
ì
19.4%
of participants had
restless legs syndrome
(Table 3)
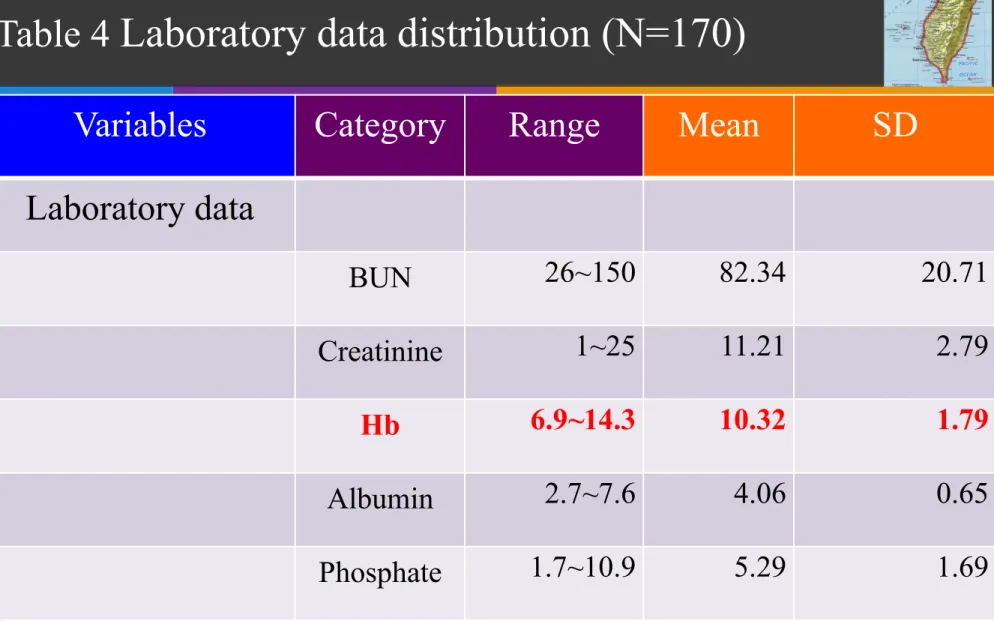
vDistribution of participant characteristics by laboratory data
The mean
BUN
of the participants was
82.3 (SD, 20.7)mg/dl
The mean
creatinine
of the participants was
11.21 (SD, 2.8)mg/dl
The mean
hemoglobin
of the participants was
10.31(SD, 1.8)g/dl
The mean
albumin
of the participants was
4.1 (SD,0.7 )g/dl
The mean
phosphate
of the participants was
5.3 (SD,1.7)mg/dl
(Table4)
vDistribution of participant characteristics by mental status
Table 3 Clinical manifestation of hemodialysis patients
(N=170)
Variables
Category N
%
Rank
Risk for sleep apnea
No
99
58.2%
Yes
71
41.8%
1
Daytime sleepiness
No
112
65.9%
Yes
58
34.1%
2
Restless legs
No
137
80.6%
Table 4
Laboratory data distribution (N=170)
Variables
Category
Range
Mean
SD
Laboratory data
BUN
26~150
82.34
20.71
Creatinine
1~25
11.21
2.79
Hb
6.9~14.3
10.32
1.79
Albumin
2.7~7.6
4.06
0.65
Phosphate
1.7~10.9
5.29
1.69
Table 5 Mental status in hemodialysis patients (n=170)
Characteristic Category N % Range Mean SD
Depression scale (BDI-II) 0-56 14.23 13.52
0~13 (Normal) 95 55.9 14~19 (Mild depression) 21 12.4 20~28 (Moderate depression ) 27 15.9 29~63 (Major depression) 27 15.9
44.1% have
depression
Distribution of Sample
Characteristics by Sleep Status
Sleep Quality and Related Factors
in Hemodialysis Patients
Results
Good sleepers CPSQI≤5 Poor sleepers CPSQI>5 P-Value N(%) N(%) Age < 64 ≥ 65 24(58.5%) 41(41.5%) 74(57.4%%) 129(42.6%) 0.895 Sex Female Male 20(48.8) 21(51.2%) 62(48.1%) 67(51.9%) 0.936
Don’t smoke cigarettes Smoke cigarettes 38(92.7%) 3(7.3%) 115(89.1%) 14(10.9%) 0.511
Don’t drink alcohol Drink alcohol 38(92.7%) 3(7.3%) 122(94.6%) 7(5.4%) 0.654
Don’t require hypnotics Require hypnotics 34(82.9%) 7(7.3%) 122(94.6%) 7(5.4%) 0.005**
CPSQI = The Chinese version of the Pittsburgh Sleep Quality Index; p<0.001 **p<0.01 *p<0.05
Table 6 : hemodialysis patients’ essential attributes and sleep quality (n=170) The number of hemodialysis
pa3ents who needed hypno3cs to aid sleep was sta3s3cally
Results
Good sleepers CPSQI≤5 Poor sleepers CPSQI>5 P-Value N(%) /mean± SD N(%) /mean± SD
Hemodialysis duration (year) 5.24±4.79 5.04±4.39 0.803 Dialysis shift Morning Afternoon Evening 13(31.7%) 12(29.3%) 16(39.0%) 40(31.0%) 45(34.9%) 44(34.1%) 0.775 spKt/V 1.69± 0.32 1.64± 0.33 0.442 Comorbidity 1.73±1.21 1.84±1.18 0.594
CPSQI= The Chinese version of the Pittsburgh Sleep Quality Index; p<0.001 **p<0.01 *p<0.05
Table 7: hemodialysis patients’ essential attributes and sleep quality (n=170)
Hemodialysis
dura3on,
dialysis shi;, spKt/V,
comorbidity
were not
Results
Good sleepers CPSQI≤5 Poor sleepers CPSQI>5 P-Value N(%)/mean± SD N(%) /mean± SD Non RLS RLS 39(95.1%) 2(4.9%) 98(76%) 31(24.0%) 0.006** Non EDS EDS 35(85.4%) 6(14.6%) 77(59.7%) 52(40.3%) 0.002**
Low risk of sleep apnea High risk of sleep apnea
37(90.2%) 4(9.8%)
80(62.0%) 49(38.0%)
<0.001***
Blood urea nitrogen (BUN)mg/dl 87.88±19.40 80.57±20.87 0.049*
Hemoglobin (Hb)g/dl 10.74± 1.06 10.19± 1.19 0.009**
Albumin (g/dl) 4.17±0.71 4.03± 0.62 0.217
Phosphate (mg/dl) 5.11±1.96 5.35±1.60 0.427 Table 8 : hemodialysis patients’ physical status and sleep quality (n=170)
RLS, EDS, risk of sleep apnea,
BUN, Hb
were sta3s3cally
Results
Good sleepers CPSQI≤5 Poor sleepers CPSQI>5 P-Value N(%) N(%) Non Depression Depression 32(78.0%) 9(22.0%) 63(48.8%) 66(51.2%) <0.001***
Table 9: hemodialysis patients’ mental status and sleep quality (n=170)
CPSQI= The Chinese version of the Pittsburgh Sleep Quality Index; p<0.001 **p<0.01 *p<0.05
The number of hemodialysis
pa3ents who had
depression
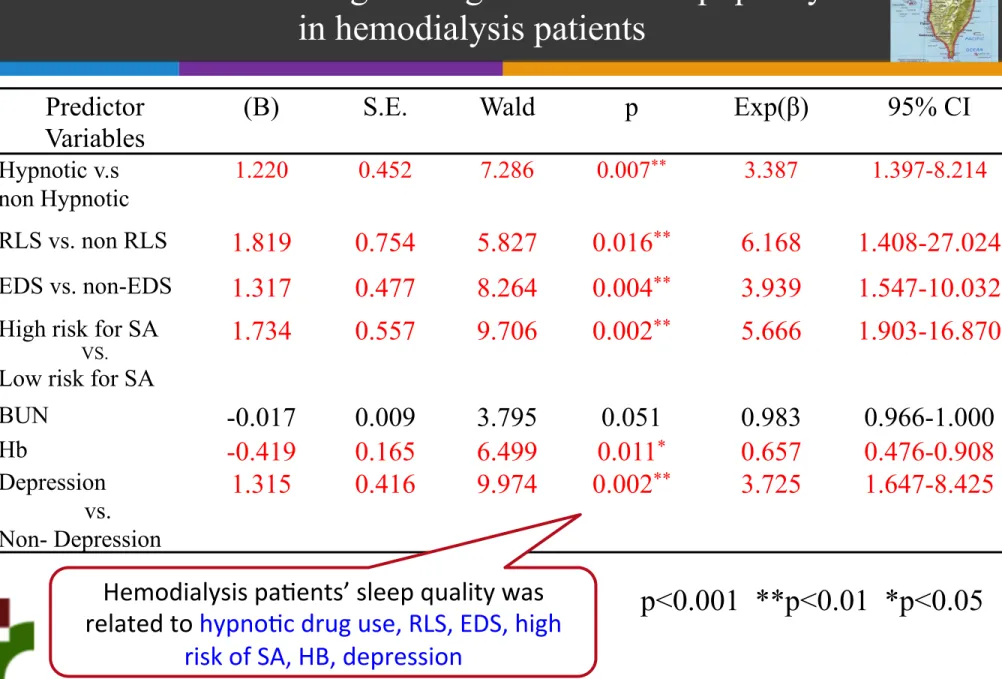
Table 10 Univariable logistic regression of sleep quality
in hemodialysis patients
Predictor Variables (B) S.E. Wald p Exp(β) 95% CI Hypnotic v.s non Hypnotic 1.220 0.452 7.286 0.007** 3.387 1.397-8.214 RLS vs. non RLS 1.819 0.754 5.827 0.016** 6.168 1.408-27.024 EDS vs. non-EDS 1.317 0.477 8.264 0.004** 3.939 1.547-10.032High risk for SA
VS.
Low risk for SA
1.734 0.557 9.706 0.002** 5.666 1.903-16.870 BUN -0.017 0.009 3.795 0.051 0.983 0.966-1.000 Hb -0.419 0.165 6.499 0.011* 0.657 0.476-0.908 Depression vs. Non- Depression 1.315 0.416 9.974 0.002** 3.725 1.647-8.425
p<0.001 **p<0.01 *p<0.05
Hemodialysis pa3ents’ sleep quality wasrelated to hypno3c drug use, RLS, EDS, high risk of SA, HB, depression
Predictor Model for Sleep Quality
in Hemodialysis Patients
Sleep Quality and Related Factors
in Hemodialysis Patients
Predictor Variables (B) S.E. Exp(β) ( odd ratio) p Cox& Snell R2 Nagelkerke R2
Model 1 (Essential attribute) Hypontic drug V.S non-Hypontic drug
0.049
0.073
(χ
2=8.56, p=0.003; Hosmer- Lemeshow=0.000 ,p<0.001)
(N=170)
Model 2 ( add
Physical status
)
↑△R
2change 70%
0.162
0.242
(χ
2=29.96,p<0.001; Hosmer- Lemeshow=10.75, p=0.216)
Model 3 (add
Physical status
Mental status
)
↑△R
2change12%
0.184
0.275
(χ
2=34.599, p<0.001; Hosmer- Lemeshow=5.58, p=0.694)
The increase in R
2(△R
2) was computed to determine
Predictor Variables (B) S.E. Exp(β) (odd ration) p Cox& Snell R2 Nagelkerke R2
Model 1 (Essential attribute) 0.049 0.073 Hypnotic drug V.S non-hypontic drug
Hypnotic Constant 1.220 0.804 0.452 0.206 3.387 15.199 0.007** <0.001***
Model 2 (Add Physical status) ↑△R2 change 70% 0.161 0.241
Hypnotic drug v.s non-hypontic drug
1.There was a very large R2 change when the RLS, EDS,Hb variables were added to the model. 2. The overall model fit was still good (p<0.05) 3.Physical status and
hypnotic drug use were significant predictors of sleep quality. Hypnotic drug 1.10 0.489 2.996 0.025* RLS vs. non-RLS RLS 1.829 0.776 6.225 0.018* EDS vs. non-EDS EDS 1.048 0.501 2.852 0.037* Hb -0.445 0.183 0.641 0.015* Constant 5.005 1.937 149.19 0.010**
Table12 Predictors of Sleep Quality in Hemodialysis Patients
Table13 Predictors of Sleep Quality in Hemodialysis Patients
Model 3(Add Mental status)
↑ △R
2change 12%
0.184
0.275
Hypnotic vs. Non-Hypnotic
Hypnotic 1.084 0.498 2.956 0.030* 1.27.5% of the model 3
in sleep quality was explained by all the variables considered. 2. Hypno3c, RLS, EDS, HB, and depression were significant predictors of sleep
quality in hemodialysis pa3ents . RLS vs. Non-RLS RLS 1.595 0.790 4.074 0.044* EDS vs. Non-EDS EDS 1.022 0.580 2.779 0.044* Hb -0.397 0.185 0.672 0.032* Depression vs. Non-Depression Depression 0.936 0.448 2.550 0.037* Constant 4.218 1.973 67.931 0.033* Predictor Variables (B) S.E. Exp(β) (odd ratio) p Cox& Snell R2 Nagelkerk R2 p<0.001 **p<0.01 *p<0.05