行動服務設計與個人特質配適度評量 - 政大學術集成
47
0
0
全文
(2) Accessing the Fit between Mobile Service Design and Individual Difference ABSTRACT In the service economy, as markets change from offering physical products to offering service products, organizations across many industries must embrace this transformation to remain competitive. Mobile technology plays an important role in this transformation because of characteristics such as mobility. According to customer variability in service encounters, we identify several individual differences that affect the quality of the service encounter and try to determine how these factors moderate the effect of mobility in the design of the mobile service. Therefore, we argue that a fit exists between mobile service design and individual difference that increases service performance. The results of this inquiry can guide service providers in developing more attractive mobile services through mobile technology.. 立. 政 治 大. ‧. ‧ 國. 學. Keywords: Mobile Technology, Mobile Service, Exhibition Industry, Individual Difference, Service Design. n. er. io. sit. y. Nat. al. Ch. engchi. i n U. v.
(3) CONTENT CONTENT ..................................................................................................................... i TABLES & FIGURES .................................................................................................ii CHAPTER 1 - INTRODUCTION .............................................................................. 1 CHAPTER 2 – LITERATURE REVIEW ................................................................. 4 2.1 Mobile Service Design ..................................................................................... 4 2.2 Customer Expectations in the Context of Service ........................................... 7 2.3 The Fit Concept................................................................................................ 9 CHAPTER 3 - DEVELOPMENT OF RESEARCH FRAMEWORK .................. 11 3.1 Research Model ............................................................................................. 11 3.2 Mobile Service Mobility Design .................................................................... 12 3.1.1 Spatial Mobility .................................................................................. 12 3.1.2 Temporal Mobility .............................................................................. 13 3.1.3 Contextual Mobility ............................................................................ 13. 立. 政 治 大. ‧. ‧ 國. 學. 3.3 Individual Difference ..................................................................................... 13 3.2.1 Personal Innovativeness ...................................................................... 14 3.2.2 Need for Interaction ............................................................................ 14 3.2.3 Self-Efficacy ....................................................................................... 15 3.2.4 Previous Experience............................................................................ 15. sit. y. Nat. CHAPTER 4 – RESEARCH METHODOLOGY ................................................... 16 4.1 Proposed Research Methodology .................................................................. 16. er. io. 4.1.1 Measurement ....................................................................................... 16 4.1.2 Data Collection ................................................................................... 18 4.2 Measurement Model Analysis........................................................................ 21. al. n. v i n CDISCUSSION CHAPTER 5 – RESULTS AND 23 h e n g c h...................................................... i U. 5.1 Structure Model Analysis ............................................................................... 23 5.2 Findings.......................................................................................................... 26. CHAPTER 6 – CONCLUSION ................................................................................ 29 6.1 Summary ........................................................................................................ 29 6.2 Contribution ................................................................................................... 30 6.3 Limitations and Implications of Future Research .......................................... 30 REFERENCE ............................................................................................................. 30 Appendix A: Complete Questionnaire for the Mobile Service “Orbi” (English Version) ....................................................................................................................... 38 Appendix B: Complete Questionnaire for the Mobile Service “Orbi” (Chinese Version) ....................................................................................................................... 41 Appendix C: Examples of Orbi Mobility Classification ......................................... 43 i.
(4) TABLES & FIGURES Table 3-1. Previous Research of User Acceptance on Mobile Service ......................... 8 Figure 2-2. Service Encounter and Customer Variability.............................................. 9 Figure 3-1. Research Framework ................................................................................. 11 Table 4-1. Measurement of Constructs ........................................................................ 16 Table 4-2. The Mobility Classification and Functions of Orbi .................................... 18 Table 4-3. Characteristics of the Study Sample ........................................................... 20 Table 4-4. Item Reliability Analysis ............................................................................ 21 Table 4-5. Correlations of Latent Variable................................................................... 22 Table 4-6. Factor Structure Matrix of Loadings and Cross-Loadings ......................... 22. 政 治 大. Table 5-1. Testing of Hypotheses 2 .............................................................................. 23. 立. Table 5-2. Testing of Hypotheses 3 .............................................................................. 24. ‧ 國. 學. Table 5-3. Testing of Hypotheses 4 .............................................................................. 25 Table 5-4. Testing of Hypotheses 5 .............................................................................. 26. ‧. n. er. io. sit. y. Nat. al. Ch. engchi. ii. i n U. v.
(5) CHAPTER 1 - INTRODUCTION Service industries play an increasingly important role in our overall economy (Kellogg and Nie, 1995). As the nature of markets change from offering physical product to offering more service products, organizations across many industries must embrace this transformation to remain competitive (Rust and Kannan, 2003). Thus, how to design services to fulfill customers’ needs becomes an important issue. New information technologies (IT) enable service organizations to integrate technology with their marketing and operational activities and allow customers to produce and consume services electronically instead of interacting with service employees (Meuter et al., 2005). IT dramatically changes how services are conceived, developed, and delivered as well as complicates the service encounter that has traditionally been dominated by interpersonal interactions (Curran et al., 2003; Meuter et al., 2005).. 立. 政 治 大. ‧. ‧ 國. 學. With its rapid growth in technical sophistication and wide-spread use, mobile technology is one of the most important emerging IT. Mobile devices, such as smart cell phones, personal digital assistants (PDAs), and portable devices, offer an unprecedented level of ubiquity, personalization, flexibility, and mobility, enabling business users to perform work-related tasks efficiently (Gebauer, 2008; Lin and Wang, 2005; Zhang, 2007) and creating business opportunities for new and innovative services provided through mobile devices (Sheng et al., 2005). The market. sit. y. Nat. n. al. er. io. for global mobile content and services is expected to grow to one trillion dollars by 2013, as the research from Informa Telecoms & Media has shown (Informa, 2010).. Ch. i n U. v. As the mobile services market gradually grows, many studies have attempted to determine what type of design increases customers’ intention to use and service satisfaction. Rayport and Jaworski (2001) have proposed a ―7C framework‖ for the evaluation of interface design (i.e., context, content, community, customization, communication, connection, and commerce). Lee and Benbasat (2004) have examined this framework further by looking at the impacts of mobile settings and mobile device constraints. Zhang (2007) has also argued that the content design of mobile devices should meet the needs of users and be adaptable to the dynamics of different contexts.. engchi. While the majority of studies have focused on enhancing interface design, there is a rising interest in mobility design as well as its associated social and technical issues such as the impact of geography, urban and public policy, or interactions driven by the notion of ―anytime, anywhere‖ access to people and information (Basole, 2004; Pellegrino, 2007; Perry et al., 2001). For example, Kakihara and Sorensen (2001) have categorized the design of mobility along the dimensions of spatial, temporal, and 1.
(6) contextual mobility. They contend that mobility is related to people’s interactions in their social lives. Although some scholars have recognized the significance of mobility design in the context of mobile service (Basole, 2004; Ciolfi et al., 2005; Kakihara and Sorensen, 2002; Pellegrino, 2007), we have found few studies in this field overall. Among the few that have focused on mobile service design, only one or two dimensions of mobility have been mentioned. Hence, we believe that there is a need to study how to design mobile interactive artifacts that can support customers in all aspects of mobility (i.e., spatial, temporal, and contextual mobility). Once mobility is designed into a service, it is communicated to customers for whom it creates expectations. According to Teboul (2006), service providers must shape expectations to satisfy customers and thus influence positively a customer's evaluation of service performance. Previous studies have identified numerous factors that have a significant impact on the expectations of individual customers, such as word-of-mouth communication, personal needs, and past experience (Zeithaml et al., 1988). In the context of mobile service, researchers have also found that individual differences in self-efficacy, demographics, or technology anxiety affect customers’. 立. 政 治 大. ‧ 國. 學. ‧. expectations concerning the use of mobile service (Lin and Wang, 2005; Nysveen, 2003; Sarker and Wells, 2003; McKee et al., 2006; Meuter et al., 2003). Therefore, to improve the performance of mobile services, companies require not only a good design but also good management of customer expectations. Furthermore, because customers with different characteristics have different expectations of mobile service. sit. y. Nat. n. al. er. io. design, we argue that a certain fit should exist between mobile service design and individual difference to increase the service performance.. Ch. i n U. v. Gebauer and Shaw (2004) have used the task-technology fit (TTF) to analyze the fit between the characteristics of mobile business applications and tasks, usage, and organizational impacts. Lee and Cheng (2007) have also used TTF to discover the fit between individual differences and PDA technology for insurance tasks. However, no study has examined the fit from a service perspective. Instead of considering the fit between task and technology characteristics, we propose to investigate the fit between service expectation and service design based on the service quality model developed by Parasuraman et al. (1985). We exploit the fit as moderation (Venkatraman, 1989). engchi. and argue that individual difference moderates the relationship between mobile service design and service performance. The results are expected to guide service providers in designing interactive mobile services that can meet the expectations of customers and generate better service performance. The research questions are presented below:. 2.
(7) 1. What are the critical characteristics of interactive mobile service designs that can generate better service performance? 2. What are the critical individual differences that moderate the relationship between mobile service design and service performance? 3. How do alternative mobile service designs fit with individual differences to create better service performance?. 立. 政 治 大. ‧. ‧ 國. 學. n. er. io. sit. y. Nat. al. Ch. engchi. 3. i n U. v.
(8) CHAPTER 2 – LITERATURE REVIEW To understand the fitness between customer expectation and mobile service design as well as its effects on the service performance, we review the literature related to mobile service design, sources of customer expectation, and the fit concept. The literature review is therefore composed of three parts. The first section introduces the important issues related to mobile service design and how they enhance service performance. In the second section, we discuss the sources of customer expectation. In the last, we review the concept of fit. 2.1 Mobile Service Design Previous literature has suggested that the mobility and reachability of mobile technology offer several value-added attributes such as ubiquity, convenience, instant connectivity, personalization, and localization (Liang and Wei, 2004; Turban and King, 2003). There are, however, some limitations. For example, small screens restrict the complexity of the information that can be displayed, and limited keypads and bandwidth restrict the amount of data that can be processed wirelessly (Gebauer et al., 2002). While conducting a large-scale, international focus group study that examined the experiences of mobile technology users, Jarvenpaa and Lang (2005) generalized eight paradoxes of mobile technology that indicated possible design features. They suggested that service providers needed to address these paradoxes and. 立. 政 治 大. ‧. ‧ 國. 學. sit. y. Nat. n. al. er. io. design services that better assisted users with balancing technology. Jones and Marsden, (2006) have also mentioned that poor design in mobile devices can result in emotional and economic impact such as higher stress and lower productivity among users.. Ch. engchi. i n U. v. Many studies, therefore, have focused on interface design. They argue that the well-designed interfaces make the exchange of information (or other intangible sources of exchange) more efficient and the whole user experience more desirable. Several studies of m-commerce interface design were developed by extending Rayport and Jaworski’s 7C framework indentified above (Rayport and Jaworski, 2001). For example, Zhang (2007) suggested that service providers should offer attractive content by adapting content presentation to both the features of a device and the user’s preference. Lee and Benbasat, (2004), however, have stressed the significance of mobile setting and mobile device constraints in the m-commerce interface design. Mobile setting refers to people carrying mobile devices anywhere they go, accessing the Internet instantly at any time, and using the devices in dynamic circumstances. Mobile device constraints include various issues, such as portability, 4.
(9) screen size, inconvenient input facilities, and lower multimedia processing capabilities than desktop computers. Lalji and Good (2008) have designed an interface for illiterate people through an iterative process of questioning and probing, participatory design, and continuous testing of prototypes. They argue that people have different life experiences, requirements, and worldviews; thus, a user-centered design process provides a valuable framework for developing products that people will enjoy and want to use because it ensures that the product or technology being developed will meet the demands of real users. While these studies have emphasized the constraints of mobile devices, they have seldom considered customers’ needs. As a result, another stream of research has attempted to address the issue of constraint by enhancing the interactive design. Mobile devices differ from computers in that desktops demand the user’s direct manipulation and visual attention due to their hardware constraints (Jones et al., 1999; Jones and Marsden, 2006; Kristoffersen and Ljungberg, 1999). Because mobile users often use their devices while engaged in tasks unrelated to computing or in situations in which manipulating a keyboard or paying attention to a screen can prove difficult, increasing the possibilities of mobile interaction is an important goal. Kristoffersen and Ljungberg (1999) have developed an interaction style named ―MOTILE‖ that needs little visual attention or tactile input and relies on only four buttons for user input with ―hands free‖ audio feedback. To enhance mobile synchronous learning, Huang et al. (2008) have designed the Interactive Service Module that allows teachers. 立. 政 治 大. ‧. ‧ 國. 學. sit. y. Nat. n. al. er. io. to use a short message and a friendly user interface to solicit information from students. The Interactive Service Module can thereby determine the students’ status with regard to the comprehension of course materials and can dynamically adapt the style of content delivery to the given learning conditions, such as the screen size or network bandwidth of the students’ hardware. Furthermore, they have developed a friendly feedback process in which students can send their opinions to the instructor without keying in complex sentences or words, thus increasing the efficiency of students’ interactive online learning. This design not only enhances the interactive flow of information but also offers a certain level of personalization, increasing spatial and contextual mobility. Studies that have discussed the interaction style of mobile services seem to be familiar with human-computer interaction (HCI) issues,. Ch. engchi. i n U. v. but the majority of the HCI issues related to mobile computing are mainly about I/O techniques (mobile nature of the work and mobile device limitations) and issues related to development and implementation (York and Pendharkar, 2004). Kakihara and Sorensen (2001) conducted one of the most prominent studies that extended the mobility concept to people’s interactions in their social lives and 5.
(10) redefined the mobility concept along the lines of spatial, temporal, and contextual interactions. Spatial mobility refers to the exchange of information, symbols, images, or files through the Internet or mobile devices without the limitation of space; temporal mobility means that human interaction no longer occurs within a linear 'clock-time' perspective or in a sequence; as for contextual mobility, it refers to the situations and environments in which humans perform their activities. Previous studies have recognized that mobility design would impact user acceptance. We summarize these studies along with the three dimensions of mobility in Table 3-1. In general, most of the studies have focused on contextual mobility and determined that customers nowadays can easily interact with others in largely different contexts (Kakihara and Sorensen, 2002). There have been relatively few studies, however, that have considered spatial and temporal mobility. Whereas these findings give us only a single direction for the development of mobile service design, there should be more concrete principles or guidelines for mobile service design with respect to other dimensions of mobility. Because many scholars have recognized the significance of including the mobility concept in the context of mobile service design (Basole, 2004; Ciolfi et al., 2005; Kakihara and Sorensen, 2002; Pellegrino, 2007), we believe that there is a need to examine mobile service design with the extended mobility concept.. 政 治 大. 立. ‧. ‧ 國. 學. Constantiou et al., 2007. Contextual. Hong et al., 2006. Contextual. n. Hung et al., 2003; Lu et al., 2008. al. Temporal Contextual. Findings. Mobile users are categorized into four groups based on different technology and services use.. er. Focus Mobility. io. Reference. sit. y. Nat. Table 3-1. Previous Research of User Acceptance on Mobile Service. Ch. engchi. i n U. v. Need for uniqueness is an important factor that affects intention to adopt. Marketing planners should expend more effort on enhancing connection speed that enables more quality and instant information exchange. Design of WAP services should adapt the services to people with higher personal innovativeness and different facilitating conditions to raise their intension.. Kuo and Yen, 2009 Yang, 2005. Contextual. Design of value-added services should focus on people with higher personal innovativeness 6.
(11) Lin and Wang, 2005. Mallat et al., 2009. Nysveen, 2003; Nysveen. Mobile services should be concerned with security Contextual. Temporal Contextual. Contextual. et al., 2005. Developers of new mobile services should build on the benefits of mobility, which means timely services easily accessed and tailored to the needs of specific users and their locations. Furthermore, mobile services must be widely applicable and compatible with customers’ past behaviors. Self-expressiveness has both an indirect and a direct influence on intention to use mobile parking services.. 立. Contextual. 治 政 Service providers 大 should offer services in a way that customers regard them as well-suited to their individual behavioral patterns and prior experience.. ‧. ‧ 國. 學. Schierz et al., 2009; Wu and Wang, 2005. and privacy issues and focus on people with higher self-efficacy.. 2.2 Customer Expectations in the Context of Service. io. sit. y. Nat. Shaping and clarifying customers’ expectations is important for service providers because customer satisfaction is expressed by the difference between perception and. n. al. er. expectation. If perception exceeds expectation, then the customer will most likely be satisfied (Teboul, 2006). However, measuring customer expectations in service contexts has been problematic because expectations and perceived performance are often measured at the same point in time (Hubbert et al., 1995). Much of the literature devoted to issues of service has attempted to discover the determinants of customer expectations. Although there is evidence that demographics such as age, gender, and income have an effect on expectations of service quality for professional and nonprofessional services, further investigation into other factors that affect customer expectations is needed. Parasuraman et al. (1985) proposed that, in addition to being influenced by a marketer's communications, customers’ service expectations were. Ch. engchi. i n U. v. affected by word-of-mouth communications, personal needs, and past experiences. They suggested that research should focus on the relative impact of these factors on the service expectations of customers within and across service categories for useful managerial implications. Zeithaml et al. (1993) further specified three different types of service expectations: desired services, adequate services, and predicted services. They also found that antecedents such as enduring service identifiers that elevate the 7.
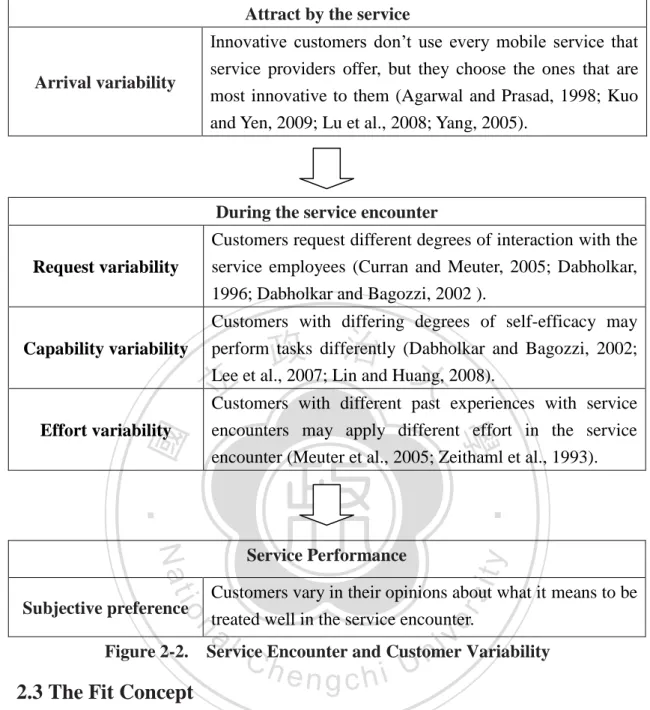
(12) level of desired services. Moreover, transitory service intensifiers, perceived service alternatives, customer self-perceived service roles, and situational factors increase the level of adequate service. Therefore all these antecedents consequently raise the level of service that customers expectations. Additionally, Webster (1991) examined the influence of opinion leadership, advertising, and sales promotions on customers’ expectation of service and found that word-of-mouth communications had the biggest impact on expectations, followed by past experiences, advertising, and sales promotion. On the other hand, Bebko (2000) has argued that overall customer expectations for service quality will vary with the level of intangibility of the service. To act upon customers’ expectations, Robledo (2001) examined the sources of customer expectations and found that many others sources (such as formal and informal recommendations, corporate image, all elements of the promotional mix, and price) had an effect on expectation of service.. 治 政 While researchers have proposed many determinants 大 of customer expectation, few studies have explored 立 the factors that directly relate to customer interactions with ‧. ‧ 國. 學. service encounters. Frei (2006) has mentioned that customers show many types of variability in every service encounter, and it is a challenge for service providers to carefully eliminate or manage the variability. He has proposed five types of variability: arrival variability, request variability, capability variability, effort variability, and subjective preference. As Figure 2-2 shows, we can map the process of service encounters by way of customer variability. Customers exhibit different behaviors in. sit. y. Nat. n. al. er. io. every phase based on their personalities. Initially, customers who arrive with higher innovativeness are often attracted to innovative services; these customers usually request to interact with service employees. Their degree of self-efficacy and experience determines how well they perform the tasks and how much effort they contribute during the service encounter. Therefore, customers with differing degrees of personal innovativeness, need for interaction, self-efficacy, and previous experience create customer variability during a service encounter; thus, these personality differences are important determinants of customer expectation. Because the literature on service shows that customer expectations are a critical component of service quality (Bebko, 2000; Clow et al., 1997; Hubbert et al., 1995; Robledo, 2001; Webster, 1991), service providers need to influence and manage customer. Ch. engchi. i n U. v. expectations to ensure that they are realistic and can be fulfilled. Thus, in this paper, we define four influential individual differences that capture customer variability and propose that these differences may affect customer expectation, which, in turn, affects service performance.. 8.
(13) Attract by the service Innovative customers don’t use every mobile service that service providers offer, but they choose the ones that are most innovative to them (Agarwal and Prasad, 1998; Kuo and Yen, 2009; Lu et al., 2008; Yang, 2005).. Arrival variability. During the service encounter Request variability. Customers request different degrees of interaction with the service employees (Curran and Meuter, 2005; Dabholkar, 1996; Dabholkar and Bagozzi, 2002 ).. Capability variability. Customers with differing degrees of self-efficacy may perform tasks differently (Dabholkar and Bagozzi, 2002; Lee et al., 2007; Lin and Huang, 2008).. 政 治 大. 立 Customers with different past experiences with service encounters may apply different effort in the service encounter (Meuter et al., 2005; Zeithaml et al., 1993).. ‧. ‧ 國. 學. Effort variability. y. sit. io. Customers vary in their opinions about what it means to be treated well in the service encounter.. n. al. er. Nat Subjective preference. Service Performance. Ch. i n U. v. Figure 2-2. Service Encounter and Customer Variability. 2.3 The Fit Concept. engchi. The fit is the key concept in contingency theory, which has dominated the study of organizational design and performance (Drazin and Ven, 1985). Ven and Drazin (1985) proposed three different conceptual approaches to fit in the development of contingency theory: the selection, interaction, and systems approach. They suggested that these three approaches are not mutually exclusive and can provide both unique and complementary information on the fit in a researcher's data. In addition, researchers believe that these approaches clarify much of the confusion in the literature on contingency theory and provide alternative directions to further the development of contingency. Venkatraman (1989) also developed six perspectives of fit: fit as moderation, fit as mediation, fit as matching, fit as gestalts, fit as profile deviation, and fit as covariation (due to lack of corresponding schemes by which fit 9.
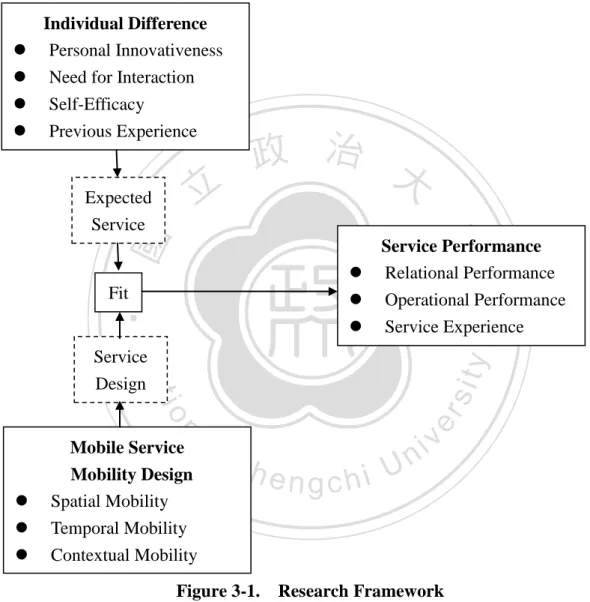
(14) has been tested). Umanath (2003), however, sought to build on congruence and contingency as the basic expressions of fit by proposing three broad categories of fit in the context of IS research: fit as congruence, fit as contingency, and fit as holistic configurations to assessing fit. Premkumar et al. (2005) have argued that there is a high level of correspondence between Umanath and Venkatraman’s concepts of fit. Many IS studies have applied Galbraith’s information processing theory to examine the fit between information processing needs and information processing capability to understand its effect on performance (Bensaou and Benkatraman, 1995; Premkumar et al., 2005). They commonly use a cluster analytic technique to develop taxonomies of the result. However, Goodhue and Thompson (1995) empirically showed that when users who understand the business task are involved in system design, it is more likely that the resulting system will fit the task needed. Thus, user involvement potentially affects not only user commitment, but also the quality or fit of the resulting system and individual performance.. 立. 政 治 大. ‧. ‧ 國. 學. Although an intuitive concept, fit is difficult to instantiate empirically. As mentioned above, many researchers have proposed several ways to conceptualize the fit, but the choice should be driven by theoretical foundations and empirical measurement (Premkumar et al., 2005). We have adopted fit as moderation and the Service Quality Model developed by Parasuraman et al. (1985) to illustrate the relationship between mobile service design and customer expectation. Such a relationship highlights the potential quality gaps described in the Service Quality. sit. y. Nat. n. al. er. io. Model. According to Parasuraman et al. (1985), by eliminating these gaps, people will receive higher perceived service quality and, therefore, better service performance. Because individual differences have an effect on customer expectation (Dabholkar and Bagozzi, 2002; Hung et al., 2003; Venkatesh et al., 2003), we propose that there is a fit between individual differences and mobile service design, which, in turn, affects the service performance.. Ch. engchi. i n U. v. Thus far, we have summarized the importance of mobile service design, the necessity of managing customer expectations, and the general concepts of fit. Therefore, we can use the research streams mentioned above to build the fit that we propose between service expectation and service design. We exploit the fit as moderation (Venkatraman 1989) and argue that individual difference moderates the relationship between mobile service design and service performance. The specific framework will be discussed in the next chapter.. 10.
(15) CHAPTER 3 - DEVELOPMENT OF RESEARCH FRAMEWORK 3.1 Research Model According to the Service Quality Model developed by Parasuraman et al. (1985), we propose that there is a fit between mobile service mobility design and customer expectation that could generate better service performance, as figure 3-1 shows. Individual Difference Personal Innovativeness Need for Interaction Self-Efficacy . Previous Experience. 立. ‧ 國. Fit. Service Performance Relational Performance Operational Performance Service Experience. ‧. . 學. Expected Service. 政 治 大. Nat. n. al. er. io. sit. y. Service Design. . Mobile Service Mobility Design Spatial Mobility Temporal Mobility Contextual Mobility. Ch. engchi. i n U. v. Figure 3-1. Research Framework In our study, we used the fit as moderation concept that illustrates that customers with certain characteristics tend to have higher expectations of services they receive, thus moderating the effect between mobile services design and service performance. With regard to mobile service design, we used the extended mobility concept to focus on three types of mobility: spatial, temporal, and contextual mobility (Kakihara and Sorensen, 2001). Additionally, based on the customer variability framework (Frei 2006), we identified four individual differences as the antecedents of customer expectation. 11.
(16) We measured service performance using three dimensions: operational, relational, and experiential. Goodhue (1995) has argued that TTF leads to higher operational performances such as utilization, accessibility, and compatibility. Pujari (2004) has worked on B2B (business-to-business) customer satisfaction in the service encounter and indicates that operational benefits such as improved speed, improved process efficiency, saved labor hours, technology reliability, real-time accessibility, convenience, and quick help are sources of satisfaction when adopting self-service technology. Besides operational performance, we also consider relational performance that measures the service firm’s closeness to customers and involves service providers who proactively seek to understand customers’ expectations and needs (Bhappu and Schultze, 2006; Stank et al., 1999). Gwinner et al. (1998) have specified that confidence benefits, social benefits, and special treatment benefits are the most important relational benefits. Moreover, we argue that service experience is another essential dimension of service performance. Pine II and Gilmore (1998) have suggested that with the rise of the experience economy service, providers should turn to offering and selling appealing experiences. Poulsson and Kale (2004) describe experience as sensations and feelings that include personal relevance, novelty, surprise, learning, and engagement. Consistent with the Service Quality Model, we believe that better mobile service design will reduce the gap between customer expectations and management’s perceptions of those expectations, which will have an impact on the customer's evaluation of service performance. A more detailed discussion follows.. 立. 政 治 大. ‧. ‧ 國. 學. n. al. 3.1.1 Spatial Mobility. Ch. engchi. er. io. sit. y. Nat. 3.2 Mobile Service Mobility Design. i n U. v. Spatial mobility denotes the movement of objects (which could be anything from information, signals, symbols, or people to mediums such as Internet or mobile technology) without the limitations of space. Spatial mobility connects everyone within a virtual community (Kakihara and Sorensen, 2001), giving mobile workers greater flexibility so that that they can complete work anywhere. Because the traditional working space has been extended and the information influx via the Internet has changed how we acquire useful knowledge, we no longer depend on wired personal computers, networks, and paper systems. It is much more convenient for people to control the progress of work and exchange information rapidly; therefore, higher service performance is perceived. We develop the hypothesis H1a: H1a: Higher spatial mobility is positively related to mobile service performance. 12.
(17) 3.1.2 Temporal Mobility Temporal mobility grants people the ability to structure their activities and plan synchronously or asynchronously through the Internet or mobile technology instead of following the linear 'clock-time' perspective (Ciolfi et al., 2005; Kakihara and Sorensen, 2001). With temporal mobility, we are able to better manage several tasks simultaneously. In other words, we can do many tasks at the same time, and there are no obtrusive events we must react to immediately. Instead of needing to pay full attention and react instantly to service messages as they arrive, the real-time information and flexible work allocation allows us to work effectively and efficiently. Precise and updated information exchanges lead to fewer errors of communication, and flexible task management accelerates working processes as well as saving time. We develop the hypothesis H1b:. 政 治 大. H1b: Higher temporal mobility is positively related to mobile service performance. 立. 3.1.3 Contextual Mobility. ‧ 國. 學. ‧. Contextual mobility refers to the situation and environment in which people perform their activities. It provides an understanding of in what way and under what circumstances the activity is being performed via the Internet or mobile technology (Basole, 2004; Ciolfi et al., 2005). People with different backgrounds in different locations have various resources and constraints. Contextual mobility focuses on satisfying these different requirements in the mobile service context. Many service. sit. y. Nat. n. al. er. io. providers embrace contextual mobility in an attempt to bring customers unique value and higher satisfaction. Mobile services with high contextual mobility offer customers tailor-made information, notification, or configuration in different contexts according. Ch. engchi. i n U. v. to customers’ habits and preferences. With contextual mobility, customers no longer receive a mass of useless information; furthermore, customized information and utilities not only adapt to the different constraints and situations but also save time and improve work efficiency. Therefore, we develop the hypothesis H1c: H1c: Higher contextual mobility is positively related to mobile service performance. 3.3 Individual Difference In the previous chapter, we have shown how individual differences create customer variability in the service encounter. In the following section, we explain how these individual differences act as moderators between mobility design and service performance. 13.
(18) 3.2.1 Personal Innovativeness Agarwal and Prasad (1998) have defined personal innovativeness as the willingness of an individual to try out any new information technology from the perspective of domain-specific innovativeness. Personal innovativeness includes several component behaviors such as seeking novelty, seeking an optimal stimulation level, seeking variety, and having exploratory tendencies (Yang, 2005). It means that customers are willing to take risks and be active seekers of new ideas or innovativeness. Some researchers postulate that individuals with higher levels of innovativeness are expected to develop more positive perceptions about intentions to use innovative IT (Lu et al., 2008). The result is similar when applied to the mobile context. For example, Yang (2005) conducted a survey of 866 Singaporean students, examining their decision-making processes when adopting M-commerce. The results indicated that personal innovativeness had significantly positive effects on perceived usefulness and perceived ease of use. Because people with higher personal innovativeness look forward to innovative services and have positive intention toward using mobile services, these people may feel the service even more useful when it incorporates a high degree of mobility. That is, customers cannot only use multiple mobile services at the same time but can also experience various interaction styles and highly customized utilities. We expect that such innovative designs can fulfill the needs of individuals with high innovativeness; therefore, we hypothesize:. 政 治 大. 立. ‧. ‧ 國. 學. sit. y. Nat. H2:Higher levels of mobility design will be more positively related to mobile. io. n. al. er. service performance when users are those who request high levels of innovativeness. Ch. 3.2.2 Need for Interaction. engchi. i n U. v. The need for interaction with service employees highlights the importance of human interaction to the customer in service encounters (Dabholkar, 1996). Many customers evaluate the quality of the services by human contact in a service delivery instead of using machines that dehumanizes the interaction (Dabholkar, 1996; Dabholkar and Bagozzi, 2002). While Curran and Meuter (2005) point out there is no evidence to support that need for interaction is negatively related to attitude toward self-service technology (SST), Meuter et al. (2005) find out that need for interaction have negative effects on consumer readiness to try SST. Derived from this finding, we can expect that while people with a high need for interaction lack the motivation to adopt mobile services, they probably indulge in mobile services with more interactive and fluid communication design, highly adaptive functions that offer real-time interaction, and 14.
(19) a friendly and unimpeded user experience (thus improving their work performance and satisfaction). We therefore hypothesize: H3: Higher levels of mobility design will be more positively related to mobile service performance when users are those who need high levels of interaction. 3.2.3 Self-Efficacy Self-efficacy is an individual’s assessment or confidence of his/her capabilities in dealing with any situation (Dabholkar and Bagozzi, 2002; Oyedele and Simpson, 2007). Dabholkar and Bagozzi (2002) found that people with higher self-efficacy attenuated the relationship between ease of use and their attitude toward using a technology-based self-service. Lee et al. (2007) have also mentioned that computer self-efficacy is the major factor impacting the task–technology fit of applying PDA technology. We can expect that users with a higher computer self-efficacy have a greater willingness to use new computer technology to assist with tasks. As a result, they are more likely to be interested in mobile services with higher mobility because they can expend less effort in dealing with the potentially more complicated operations and quickly get used to doing work with the mobility functions provided. Thus, the following hypothesized is set forth. 政 治 大. 立. ‧. ‧ 國. 學. Nat. sit. y. H4: Higher levels of mobility design will be more positively related to mobile service performance when users are those who have high levels of self-efficacy. n. er. io. al 3.2.4 Previous Experience. Ch. engchi. i n U. v. Zeithaml et al. (1993) proposed that customers’ previous exposure to certain services that they had used has a positive impact on their expected services. Previous experience with mobile services can shorten the learning curve because people are familiar with the service operation. Armed with more relevant knowledge and less dependent on assistance, people who have had previous service experience can properly execute mobile services with high mobility and generate better performance. Hence, we put forward the following hypothesis: H5: Higher levels of mobility design will be more positively related to mobile service performance when users are those who have high levels of past experience. 15.
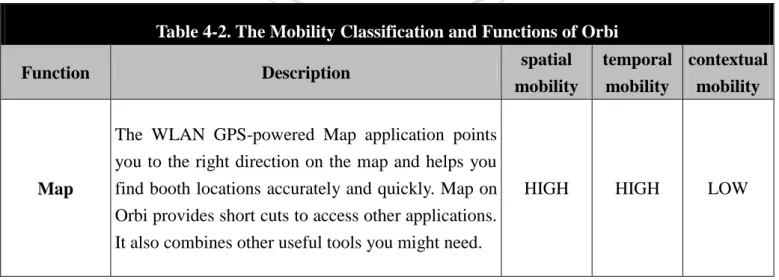
(20) CHAPTER 4 – RESEARCH METHODOLOGY 4.1 Proposed Research Methodology 4.1.1 Measurement The constructs of the proposed research model are conceptualized in the previous chapters. Table 4.1 shows the measures for each construct, operationalized using the items provided in the referenced studies.According to the expanding mobility concept (Kakihara and Sorensen, 2001), we created the measurements for mobility (SM, TM, and CM shown in the Table 4-1). We defined three types of mobility for each function in the Orbi and gave high mobility the score of 1 and low mobility the score of 0 (Table 4-2). There are some examples of how we classified the mobility of Orbi services in Appendix C. Each function, therefore, had three mobility scores (one for SM, one for TM, and one for CM). Additionally, respondents were asked to rate their satisfaction with each function, ranging from 10 as high to 1 as low (the score is denoted as service score). For each function, we derived the respondent’s preference score by multiplying the mobility score by the service score. We then summed up the preference scores for all functions to derive each respondent’s preference for one specific mobility. The measurements of personal innovativeness (PI1, PI2), need for interaction (NI1, NI2), self-efficacy (SE1, SE2), and previous experience (PE1, PE2) are defined in Table 4.1. Finally, the measurements of relational performance (from. 政 治 大. 立. ‧. ‧ 國. 學. sit. y. Nat. n. al. er. io. RP1 to RP4) and operational performance (from OP1 to OP3) were adapted from the reference shown in Table 4.1. According to Pulsson and Kale’s work on experience (2004), we created measurements for service experience by using three items (from SE1 to SE3).. Ch. engchi. i n U. v. Table 4-1. Measurement of Constructs Independent Variable (Predictor Variable). Spatial mobility (single item measure created for the context). Item. Measures of Mobility Design Spatial mobility is measured by the degree of interactivity during the communication. In the mobile service context, people could now do one-way communication (e.g.,. SM. information access or message notification), two-way communication (e.g., interpersonal communication), and hybrid communications (e.g., online meeting or Wiki). The spatial mobility is labeled as high for two-way and hybrid communications, while low for one-way communication. 16.
(21) Temporal mobility is measured by the degree of obtrusion of Temporal mobility (single item measure created for the context). mobile services. In the mobile service context, temporal mobility is low when the messages or information generated by service are obtrusive and high when unobtrusive.. TM. Contextual mobility (single item measure created for the context) Independent Variable (Moderator Variable). CM. Contextual mobility is measured by the degree of customization of functions. Contextual mobility is labeled as high when it is more customized to match with different situations and needs.. Item. Measures of Individual Difference. 治 政Willingness of 大 an individual to try out any new information. Dependent Variable (Criterion Variable). Service Performance (2 items adapted from Gwinner et al., 1998, Pujari, 2004 and 1 item created for the context ). of. domain-specific. NI1. Importance of human interaction to the customers in service encounters.. NI2. Degree of annoyance that mobile services create in service encounters.. y. Assessment or confidence of an individual’s capabilities in aSE1,SE2 i v by using IT. l C dealing with any situation n hengchi U. n. Previous Experience (2 items adapted from Meuter et al., 2005). view. sit. io. Self-Efficacy (2 items adapted from Lin and Huang, 2008 ). the. er. Nat. Need for Interaction (2 items adapted from Dabholkar, 1996). technology from innovativeness.. ‧. ‧ 國. 立PI1,PI2. 學. Personal Innovativeness (2 items adapted from Agarwal and Prasad, 1998). PE1,PE2. Customers’ previous exposure to similar mobile services they have used.. Item. Measures of Service Performance. SP1. The degrees of additional services or preferential treatment received by customers.. SP2. The improvement reliability.. SP3. The degree of satisfaction with overall using experience. 17. of. process. efficiency,. technology.
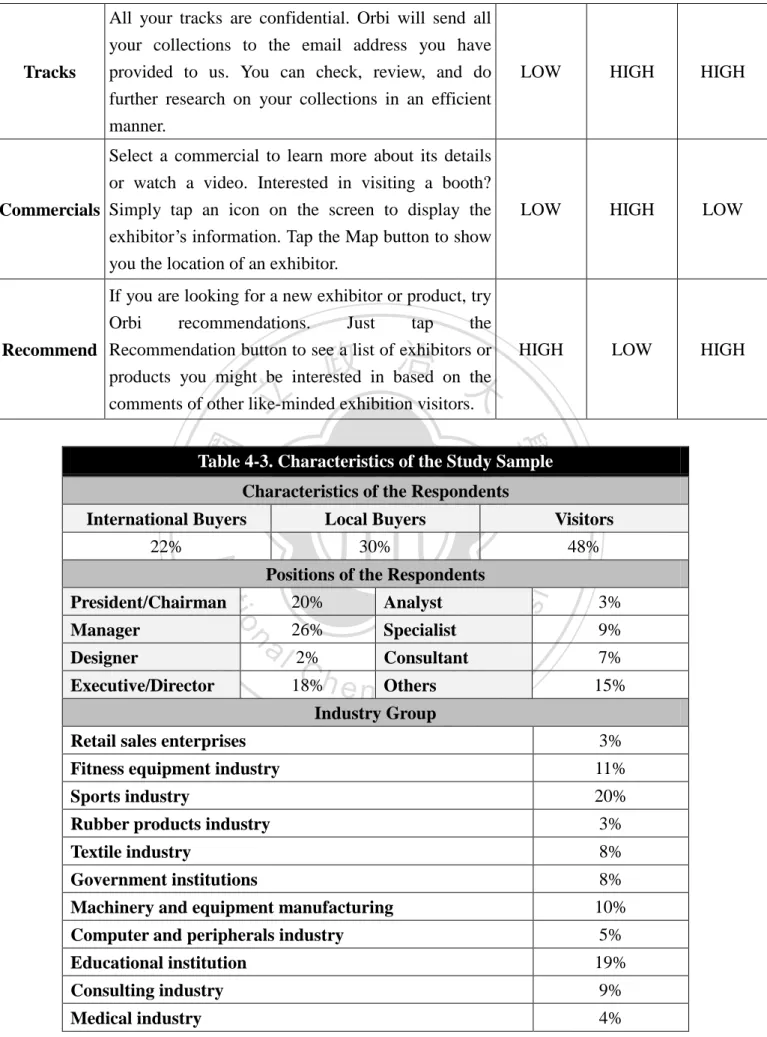
(22) 4.1.2 Data Collection Exhibition is an emerging industry that provides a medium for firms to find customers and suppliers. Due to the enormous business opportunity presented by exhibitions, many countries are dedicated to investing in and developing the exhibition industry. According to ICCA (International Congress & Convention Association), there are about 40 thousand exhibitions held each year across the world, costing a total of about 28 billion dollars. UFI (The Global Association of the Exhibition Industry) also indicates that the output value of the exhibition industry is approximately 160 billion dollars. In view of the importance and the benefits of the exhibition industry, the Service Science Research Center (SSRC) in National Chengchi University (NCCU) conducted a project that endeavored to build an innovative mobile service named ―Orbi‖ for exhibition use. The functions of Orbi are summarized in Table 4.2. The goal of Orbi was to streamline the exhibition process and allow exhibitors and visitors to match and interact efficiently. To collect the data, we distributed a survey at a professional exhibition ―TaiSPO‖ held at the Taipei World Trade Center Nangang Exhibition Hall in April 2010. 2010TaiSPO was the 37th exhibition held for promoting Taiwanese athletic products, an industry that generates about 60 billion dollars every year. The exhibition attracts hundreds of exhibitors and thousands of buyers, thus becoming the most important athletic goods purchasing exhibition in Asia. The questionnaire was designed as a paper-based and PDF-based survey (Appendix A). Visitors and buyers were required to finish the. 立. 政 治 大. ‧. ‧ 國. 學. sit. y. Nat. n. al. er. io. questionnaire when returning the Orbi device. Over the course of the three-day exhibition, we collected 105 questionnaires that included 54 international buyers and 51 visitors, as shown in Table 4.3. Of these questionnaires, 98 were found to be complete and usable.. Ch. engchi. i n U. v. Table 4-2. The Mobility Classification and Functions of Orbi Function. spatial mobility. Description. temporal contextual mobility mobility. The WLAN GPS-powered Map application points you to the right direction on the map and helps you Map. find booth locations accurately and quickly. Map on Orbi provides short cuts to access other applications. It also combines other useful tools you might need.. 18. HIGH. HIGH. LOW.
(23) Orbi features Exhibitors — a useful application Exhibitors. Products. Activity. designed for the exhibition safari. Use it to browse a list of all exhibitors and obtain more details. Fast! Orbi features Products — a useful application designed for the exhibition safari. Use it to browse a list of all products and obtain more details. Fast! Orbi automatically informs you of upcoming events you might be interested in, so that you will not miss any opportunity to network and build relationships with suppliers. Moreover, Orbi allows you to browse. LOW. LOW. LOW. LOW. LOW. LOW. HIGH. HIGH. HIGH. HIGH. HIGH. HIGH. LOW. LOW. LOW. LOW. LOW. HIGH. LOW. HIGH. LOW. LOW. LOW. a list of exhibition activities and shows you the venues of the events on its display screen.. 政 治 大 Discover Orbi intelligence. 立 If you are embarking on. ‧ 國. ‧. Orbi makes it easy for you to keep all exhibitors and product marketing materials. Click the Collect It button on the Exhibitor, Product, or Activity pages.. n. al. sit. LOW. er. io. Moreover, Orbi allows you to review collected information whenever and wherever you are.. y. Nat. Collection. an exhibition journey to service excellence, let Express be your guide. No other business trade show tool does it like Orbi.. 學. Express. i n C Orbi enables you to simultaneously recordsU and h e nkeep i h c g take notes right there in the exhibition hall. You don't Quick note. have to wait until you have access to a PC to keep notes. Orbi also provides practical indicators to help you evaluate exhibitors. Simply tap and score on the touch screen.. v. Orbi’s innovative intelligence service platform Search. Information. predicts and suggests keywords as you search information for the entire exhibition in a whole new way. You can browse through a wide range of information related to transportation, food, shops, and more. 19.
(24) All your tracks are confidential. Orbi will send all Tracks. your collections to the email address you have provided to us. You can check, review, and do further research on your collections in an efficient manner.. Select a commercial to learn more about its details or watch a video. Interested in visiting a booth? Commercials Simply tap an icon on the screen to display the exhibitor’s information. Tap the Map button to show you the location of an exhibitor.. LOW. HIGH. HIGH. LOW. HIGH. LOW. HIGH. LOW. HIGH. If you are looking for a new exhibitor or product, try Orbi recommendations. Just tap the Recommend Recommendation button to see a list of exhibitors or products you might be interested in based on the. 政 治 大. 立. 學. ‧ 國. comments of other like-minded exhibition visitors.. Table 4-3. Characteristics of the Study Sample Characteristics of the Respondents. 22%. 30%. n. Executive/Director. sit. io. al. 20%. Analyst. 26%. Specialist. 2%. n U Others engchi. C 18%h. Consultant. er. Nat. Designer. 48%. Positions of the Respondents. President/Chairman Manager. Visitors. y. Local Buyers. ‧. International Buyers. iv. 3% 9% 7% 15%. Industry Group Retail sales enterprises. 3%. Fitness equipment industry. 11%. Sports industry. 20%. Rubber products industry. 3%. Textile industry. 8%. Government institutions. 8%. Machinery and equipment manufacturing. 10%. Computer and peripherals industry. 5%. Educational institution. 19%. Consulting industry. 9%. Medical industry. 4% 20.
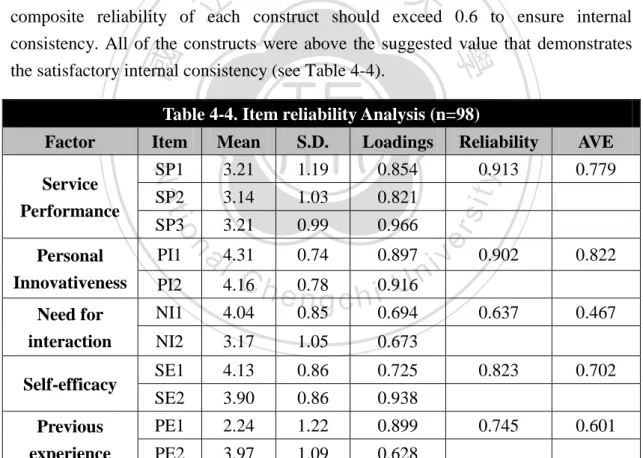
(25) 4.2 Measurement Model Analysis We chose a Partial Least Squares (PLS) approach for the data analysis because of its minimal requirements for measurement scales and sample size (Chin et al., 1998). Chin et al. also pointed out that reflective and formative relation could be specified in PLS. We followed the criteria of distinguishing between formative and reflective indicators provided by Jarvis et al. (2003) to model the service performance as a formative construct because the items within the construct were not interchangeable and covaried with each other. Individual differences were modeled as reflective constructs because all the items of each construct reflected the same underlying construct and were interchangeable. We first conducted the item reliability and the validity examination. Item reliability analysis provided the information about the consistency, stability, and internal consistency of the data. We identified the reliability by examining the loadings and composite reliability. Bagozzi and Yi (1988) have suggested that the loadings of items within each construct should exceed 0.5 and the composite reliability of each construct should exceed 0.6 to ensure internal consistency. All of the constructs were above the suggested value that demonstrates the satisfactory internal consistency (see Table 4-4).. 立. 政 治 大. ‧ 國. 學. Loadings. Reliability. AVE. SP1. 3.21. 1.19. 0.854. 0.913. 0.779. SP2. 3.14. 1.03. 0.821. SP3. 3.21. 0.99. 0.966. n. a l4.31 Ch 4.16. Personal Innovativeness. PI1. Need for interaction. NI1. 4.04. NI2. Self-efficacy Previous experience. sit. i n 0.916 e 0.78 ngchi U 0.74. 0.897. 0.85. 0.694. 3.17. 1.05. 0.673. SE1. 4.13. 0.86. 0.725. SE2. 3.90. 0.86. 0.938. PE1. 2.24. 1.22. 0.899. PE2. 3.97. 1.09. 0.628. PI2. y. S.D.. io. Performance. Mean. er. Service. Item. Nat. Factor. ‧. Table 4-4. Item reliability Analysis (n=98). v. 0.902. 0.822. 0.637. 0.467. 0.823. 0.702. 0.745. 0.601. We considered the convergent validity and discriminant validity in order to measure the construct validity (which means that the questionnaire accurately reflected the respondent’s reaction). Fornell and Larcker (1981) concluded that the average variance extracted (AVE) of the constructs should be greater than 0.5 to ensure the convergent validity. Chin et al. (1998) has suggested examining the discriminant validity by identifying the cross-loading matrix and the square root of AVE. All of the 21.
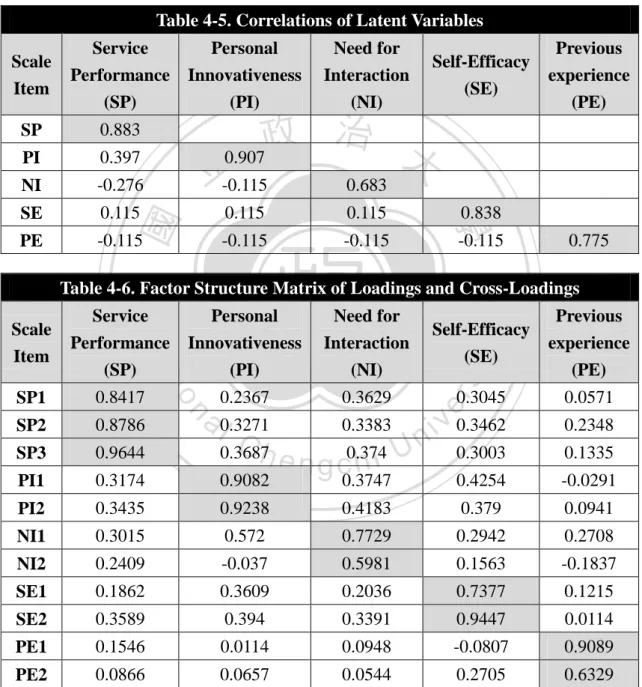
(26) constructs’ AVEs achieved the requirement except for the construct ―Need for interaction‖ with an AVE of 0.467 (see Table 4-2). Because the value was approximate to 0.5, we kept the construct for later analysis. As shown in Table 4-5, none of the correlations with other latent constructs were sufficiently higher than the square root of the AVE for the defined constructs and cross-loading matrix. Table 4-6 also shows that loadings within constructs were significantly higher than loadings between constructs. Therefore, the constructs possessed the sufficient convergent validity and discriminant validity. Table 4-5. Correlations of Latent Variables Scale Item. Service Performance. Personal Innovativeness. Need for Interaction. (SP). (PI). (NI). Self-Efficacy (SE). 治 政 大 0.907 立-0.115 0.683. PI. 0.397. NI. -0.276. SE. 0.115. 0.115. 0.115. PE. -0.115. -0.115. -0.115. (PE). 0.838. -0.115. ‧. ‧ 國. 0.883. 學. SP. Previous experience. 0.775. Table 4-6. Factor Structure Matrix of Loadings and Cross-Loadings. (SP). (PI). (NI). 0.2367. 0.3629. SP2. 0.8786. SP3. 0.9644. PI1. 0.3174. PI2. 0.3045. a l0.3271 v 0.3462 0.3383 i n Ch 0.3687 e n g c0.374 h i U 0.3003. n. 0.8417. io. SP1. Self-Efficacy (SE). y. Need for Interaction. sit. Personal Innovativeness. er. Service Performance. Nat. Scale Item. Previous experience (PE) 0.0571 0.2348 0.1335. 0.9082. 0.3747. 0.4254. -0.0291. 0.3435. 0.9238. 0.4183. 0.379. 0.0941. NI1. 0.3015. 0.572. 0.7729. 0.2942. 0.2708. NI2. 0.2409. -0.037. 0.5981. 0.1563. -0.1837. SE1. 0.1862. 0.3609. 0.2036. 0.7377. 0.1215. SE2. 0.3589. 0.394. 0.3391. 0.9447. 0.0114. PE1. 0.1546. 0.0114. 0.0948. -0.0807. 0.9089. PE2. 0.0866. 0.0657. 0.0544. 0.2705. 0.6329. 22.
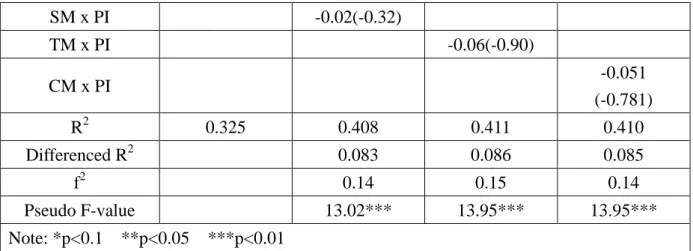
(27) CHAPTER 5 – RESULTS AND DISCUSSION 5.1 Structure Model Analysis We used a bootstrapping approach with 300 samples created for estimating path coefficients and confidence intervals. We first calculated the R-squared (R2) parameter for the basic model (Model 1) including the three types of mobility and the dependent variable. All path coefficients, except for the path from the contextual mobility to service performance, were found to be significant and thus provide support for H1a but not H1b (significant at the opposite direction) and H1c, as shown in Model 1 of Table 5-1. We then followed Chin et al.’s (1996) PLS product-indicator approach to detect the moderating effects. We obtained the R2 of the moderating effect models by including independent variables, moderators, interaction terms, and the dependent variable in the model. Then, we compared the R2 of the moderating effect models against the R2 of Model 1 to derive the f2 statistics and the pseudo-F statistics1. For p = 0.01, the pseudo-F statistics in the three models were all larger than F(0.99, 3, 94) = 4.02, and, therefore, the differenced R2 were all significant in ―Model 2,‖. 政 治 大. 立. ‧ 國. 學. ‧. ―Model 3‖ and ―Model 4‖. Because the path coefficients of personal innovativeness (PI) of all three types of mobility on service performance were not significant, H2 is not supported. That is, PI did not have a moderating effect on the relationship between the three types of mobility and the service performance, but we found that PI was a. sit. y. Nat. n. al. er. io. predictor variable itself (PI was significant at the 0.01 level in model 2, model3, and model 4), and the significant differenced R2 indicated that including the valuable increased the model’s explanatory ability.. Ch. engchi. i n U. v. Table 5-1. Testing of Hypotheses 2 Independent Variable. Dependent Variable: Service Performance Model 1. Model 2. Model 3. Model 4. Spatial Mobility(SM). 0.86(3.67)***. 0.88(2.94)***. 0.86(3.08)***. 0.87(3.22)***. Temporal Mobility(TM). -0.31(-1.52)*. -0.33(-1.73)**. -0.31(-1.65)**. -0.33(-1.68) **. Contextual Mobility(CM). -0.04(-0.21). -0.10(-0.52). -0.09(-0.51). -0.085 (-0.478). 0.30(2.75)***. 0.29(2.84)***. 0.29(2.94)***. Personal Innovativeness (PI). 23.
(28) SM x PI. -0.02(-0.32). TM x PI. -0.06(-0.90) -0.051 (-0.781). CM x PI R2. 0.325. 0.408. 0.411. 0.410. Differenced R2. 0.083. 0.086. 0.085. 2. f. 0.14. 0.15. 0.14. Pseudo F-value. 13.02***. 13.95***. 13.95***. Note: *p<0.1 **p<0.05. ***p<0.01. In Table 5-2, for p = 0.01, pseudo F-values in models 2, 3, and 4 were larger than F (0.99, 3, 296) = 3.782, indicating that the differenced R2 were significant in ―Model 2,‖ ―Model 3‖ and ―Model 4‖. Because NI significantly moderated the relationship between mobility and service performance, H3 is supported. The result shows that NI not only interacts with the predictor variables (SM x NI, TM x NI and CM x NI were significant in model 2, model 3, and model 4), but was also a predictor variable itself (NI was significant at the 0.01 level in model 2, model3, and model 4). Moreover, the significant differenced R2 indicated that including the valuable increased the model’s explanatory ability.. 政 治 大. ‧ y. io. Model 1. n. al. sit. Dependent Variable: Service Performance Model 2. Model 3. er. Variable. Table 5-2. Testing of Hypotheses 3. Nat. Independent. 學. ‧ 國. 立. i n U. v. Model 4. Spatial Mobility(SM). 0.86(3.67)***. 0.73(2.62)***. 0.79(2.83)***. 0.77(2.54)***. Temporal Mobility(TM). -0.31(-1.52)*. e n-0.29(-1.56)* gchi. -0.33(-1.70)**. -0.34(-1.66)**. Contextual Mobility(CM). -0.04(-0.21). -0.01(-0.08). -0.03(-0.14). 0.006(0.03). Need for interaction(NI). 0.26(2.90)***. 0.26(2.74)***. 0.26(2.98)***. SM x NI. 0.16(1.90)**. Ch. TM x NI. 0.14(1.75)**. CM x NI R. 0.11(1.45)*. 2. Differenced R. 0.325 2. 0.419. 0.416. 0.407. 0.094. 0.091. 0.082. 2. f. 0.16. 0.16. 0.14. Pseudo F-value. 14.88***. 14.88***. 13.2***. Note: *p<0.1 **p<0.05. ***p<0.01 24.
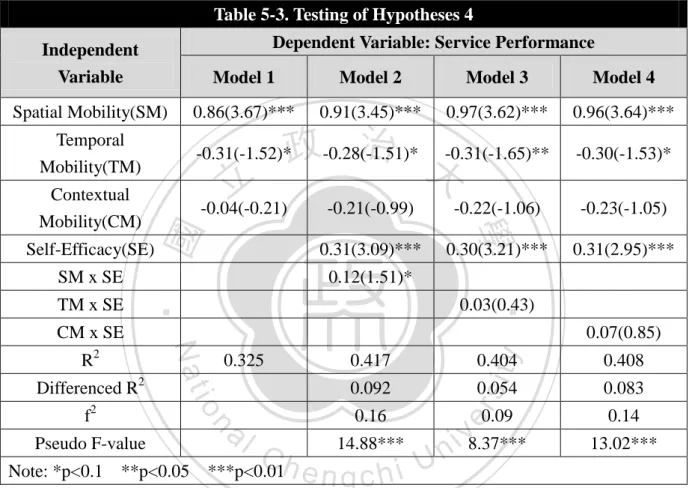
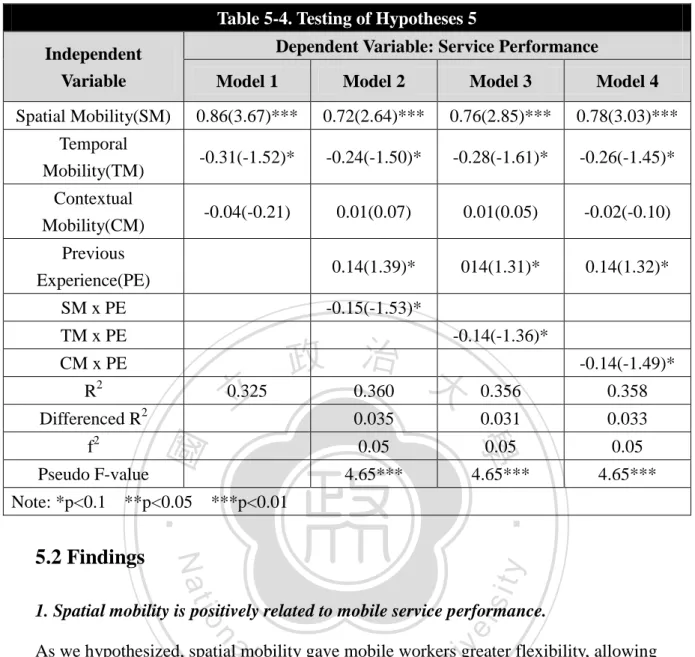
(29) In Table 5-3, for p = 0.01, pseudo F-values in model 2, 3, and 4 were larger than F(0.99, 3, 296) = 4.02, indicating that differenced R2 were significant in ―Model 2,‖ ―Model 3‖ and ―Model 4‖. The result also shows that self-efficacy only moderated the relationship between spatial mobility and service performance (SM x SE was significant at the 0.1 level in model 2), partially supporting H4. Moreover, SE was a predictor variable itself (SE was significant at the 0.01 level in model 2, model3, and model 4) and it increased the model’s explanatory ability. Table 5-3. Testing of Hypotheses 4 Dependent Variable: Service Performance. Independent Variable. Model 1. Model 2. Model 3. Model 4. Spatial Mobility(SM). 0.86(3.67)***. 0.91(3.45)***. 0.97(3.62)***. 0.96(3.64)***. Temporal Mobility(TM). -0.31(-1.52)*. Contextual Mobility(CM). -0.04(-0.21). 治 -0.31(-1.65)** 政-0.28(-1.51)* 大. 立. Self-Efficacy(SE). 0.31(3.09)***. 0.30(3.21)***. SM x SE. 0.12(1.51)*. 2. Pseudo F-value Note: *p<0.1 **p<0.05. 0.31(2.95)***. y. 0.092. al. 0.16. Ch. ***p<0.01. n U engchi 14.88***. 0.07(0.85). 0.404. 0.408. 0.054. 0.083. sit. 0.417. n. f. 0.325. io. Differenced R. 2. Nat. R2. -0.23(-1.05). 0.03(0.43). er. CM x SE. ‧. TM x SE. ‧ 國. -0.22(-1.06). 學. -0.21(-0.99). -0.30(-1.53)*. 0.09. i v8.37***. 0.14 13.02***. In Table 5-4, for p = 0.01, pseudo F-values in model 2, 3, and 4 were larger than F(0.99, 3, 296) = 4.02, indicating that differenced R2 were significant in ―Model 2,‖ ―Model 3‖ and ―Model 4‖. Because the path coefficients of interaction term in three models were negatively significant, H5 is not supported. The result shows that PE not only interacted negatively with the predictor variables (SM x PE, TM x PE and CM x PE were negatively significant in model 2, model 3, and model 4), but also was a predictor variable itself (PE was significant at the 0.1 level in model 2, model3, and model 4) and it increased the model’s explanatory ability.. 25.
(30) Table 5-4. Testing of Hypotheses 5 Dependent Variable: Service Performance. Independent Variable. Model 1. Model 2. Model 3. Model 4. Spatial Mobility(SM). 0.86(3.67)***. 0.72(2.64)***. 0.76(2.85)***. 0.78(3.03)***. Temporal Mobility(TM). -0.31(-1.52)*. -0.24(-1.50)*. -0.28(-1.61)*. -0.26(-1.45)*. Contextual Mobility(CM). -0.04(-0.21). 0.01(0.07). 0.01(0.05). -0.02(-0.10). Previous Experience(PE). 0.14(1.39)*. 014(1.31)*. 0.14(1.32)*. SM x PE. -0.15(-1.53)*. TM x PE. -0.14(-1.36)*. CM x PE. 立. 0.033. 0.05 4.65***. 0.05. 0.05. 4.65***. 4.65***. ***p<0.01. Nat. 5.2 Findings. 0.031. ‧. Note: *p<0.1 **p<0.05. 0.035. y. Pseudo F-value. 0.358. 學. f2. 0.356. -0.14(-1.49)*. sit. Differenced R. 0.325 2. ‧ 國. R. 2. 政 治 大 0.360. n. al. er. io. 1. Spatial mobility is positively related to mobile service performance.. i n U. v. As we hypothesized, spatial mobility gave mobile workers greater flexibility, allowing greater control over progress of work and increasing the speed of information exchange. Spatial mobility, therefore, lead to higher service performance.. Ch. engchi. 2. Temporal mobility is negatively related to mobile service performance Based on previous literature, we hypothesized that, with higher temporal mobility, mobile users would be able to better manage several tasks simultaneously. In other words, they could perform multiple tasks at the same time. H1b hypothesis was not supported because the results showed that higher temporal mobility design was negatively related to mobile service performance. The result indicates that business visitors viewed unobtrusive message alerts as a type of disturbance. In fact, business visitors preferred to concentrate on using one mobile service at a time. Too many messages alerts confused and distracted them. Hence, we can conclude that high temporal mobility design will not benefit service performance. 26.
(31) 3. Contextual mobility is not significantly related to mobile service performance for goal-oriented visitors Greater contextual mobility design did not attract goal-oriented visitors. The targeted exhibition in this study was a business-to-business exhibition in which the visitors were corporate buyers who were very clear about which products they intended to buy and which exhibitors they intended to visit. In other words, most of the visitors were goal-oriented customers, not impulsive. In this situation, customized mobile services such as information and commercials customized according to their personal information were not necessarily useful to them. The results highlight the importance of designing contextual mobility according to users’ purposes. 4. High levels of personal innovativeness do not have significant moderating effect on mobility and mobile service performance. 治 政 Users with high personal innovativeness did not 大 regard greater mobility as a 立 performance, although these users did perceive more contributor to mobile service ‧. ‧ 國. 學. mobile service value. People with high personal innovativeness are always active seekers of new ideas and innovativeness. Lu et al. (2008) have mentioned that individuals with higher levels of innovativeness are expected to have positive perceptions about using innovative IT. However, in our study, a mobile service embedded with high levels of mobility did not attract these innovative users. One of the reasons may be that the mobility design on smart phones has become so popular. sit. y. Nat. n. al. er. io. that many users did not consider the similar design in the Orbi service as innovative enough. Therefore, discovering new ways to add innovative elements to the mobility design will be an import point in the future.. Ch. engchi. i n U. v. 5. High levels of mobility design will be more positively related to mobile service performance when users are those who need high levels of interaction This result was consistent with our hypothesis that users with a higher need for interaction appreciate mobility design. It also provided evidence that the Orbi service can offer customers real-time interaction with exhibitors and buyers and thus improve their work performance and satisfaction 6. High levels of spatial mobility design will be more positively related to mobile service performance when users are those who have high levels of self-efficacy; however, self-efficacy does not play a role in the relationship between temporal and contextual mobility and mobile service performance Greater spatial mobility in the design had a more positive effect on users with higher 27.
(32) levels of self-efficacy. Compared to the functions with high levels of temporal and contextual mobility design, those functions on Orbi with high levels of spatial mobility design required that users have more IT related knowledge to operate them properly. For example, high spatial mobility services such as the GPS-powered map application required users to frequently locate new positions. Users had to comprehend and react to the messages. As Lee et al. (2007) have proposed, computer self-efficacy is the major indicator of task–technology fit when applied to PDA technology; therefore, users with higher self-efficacy are more confident with using functions with high levels of spatial mobility in the Orbi. These results highlight the importance in designing as easy-to-use interfaces that function with high levels of spatial mobility. 7. User’s past experience does not have significant moderating effect on the relationship between mobility design and mobile service performance.. 政 治 大 H5 is not supported because the results showed that users with high levels of previous 立 experience of mobile services did not appreciate the mobile services designed for high ‧. ‧ 國. 學. mobility. Zeithaml et al. (1993) found that customers’ previous exposure to certain services had a positive impact on their expected services. In our study, users with high levels of previous experience certainly lead to better service performance. However, mobile services designed with greater mobility did not leave a positive impression on those users – that is, they did not appreciate the mobile services designed for greater. y. Nat. sit. mobility as a beneficial tool for their task. Instead, we can conclude that although. n. al. er. io. previous experience with mobile services can shorten the learning curve, it can also lower the significance of mobile services designed for high mobility among experienced users.. Ch. engchi. 28. i n U. v.
(33) CHAPTER 6 – CONCLUSION 6.1 Summary With the rapid growth of the service economy and mobile devices that offer an unprecedented level of ubiquity and mobility, service providers are attempting to develop more attractive mobile services through mobile technology. We examined one such service along three dimensions of mobility – spatial, temporal, and contextual mobility – and identified four individual differences: personal innovativeness, need for interaction, self-efficacy and previous experience according to customer variability in the service encounter. We attempted to determine how these factors moderated the effect of mobility in the mobile service design.. 政 治 大. To test the proposed framework, we joined the project endeavoring to build an innovative mobile service named ―Orbi‖ for use in an exhibition conducted by Service Science Research Center (SSRC) in National Chengchi University (NCCU). Data were collected by distributing the survey in a professional exhibition ―TaiSPO‖ held at the Taipei World Trade Center Nangang Exhibition Hall in April 2010. The. 立. ‧ 國. 學. ‧. questionnaire was designed as a paper-based and PDF-based survey. 105 questionnaires were collected including 54 international buyers and 51 visitors, and among them 98 were found to be complete and usable. Then, we used a Partial Least Squares (PLS) approach to test the fit between mobile service design and individual. sit. y. Nat. n. al. er. io. differences that increase service performance. The results showed that while spatial mobility was positively related to mobile service performance, temporal and contextual mobilities were not. As for individual differences, personal innovativeness did not have a significant moderating effect, need for interaction had a positively significant moderating effect, previous experience had a negatively significant moderating effect, and self-efficacy had a partially moderating effect between mobility and mobile service performance.. Ch. engchi. i n U. v. Therefore, we can conclude that spatial mobility is beneficial to mobile users in the context of a B2B exhibition. Users prefer to concentrate on using one mobile service at a time instead of many messages alerts that distract them. Hence, high temporal mobility design in mobile service design does not benefit the service performance. Furthermore, we should design contextual mobility according to users’ purposes. As for customers with high levels of personal innovativeness, service providers should focus on adding innovative elements into the mobility design because smart phones are getting so popular that many users did not think that a similar design used in the Orbi services was innovative enough. For customers who 29.
(34) require high levels of interaction, high mobility design offers them real-time interaction that improves their work performance and satisfaction. Customers with high levels of self-efficacy are more confident when using mobile services designed to have high spatial mobility because they require users to have more IT-related knowledge to operate. We also found that customers with high levels of previous experience did not appreciate high mobility design in mobile services as a beneficial characteristic.. 6.2 Contribution Knowing that users with different attitudes toward service encounters require different mobility designs can guide service providers in developing more attractive mobile services through mobile technology. Examining the mobility along the lines of spatial, temporal, and contextual mobility and identifying individual differences according to customer variability in the service encounter can provide IT researchers with a basis for further examination of other important factors.. 立. 政 治 大. ‧ 國. 學. 6.3 Limitations and Implications of Future Research. ‧. sit. y. Nat. Although we proposed mobility and several individual differences as the fit factors in this study, there may be other factors to be considered, such as users’ job positions, the exhibition size, and the exhibition type. In the future, individual differences and. n. al. er. io. characteristics of mobile technology can also be extended to broaden categories according to different situations, making the proposed framework more general to effectively apply to other similar industries.. Ch. engchi. i n U. v. REFERENCE Agarwal, R., & Prasad, J. (1998). A conceptual and operational definition of personal innovativeness in the domain of information technology. Information Systems Research, 9(2), 204-215. Bagozzi, R. R., & Yi, Y. (1988). On the Evaluation of Structural Equation Models. Journal of the Academy of Marketing Science, 16(1), 074-094. Basole, R. C. (2004). The value and impact of mobile information and communication technologies. Proceedings of the IFAC Symposium on Analysis. Bebko, C. P. (2000). Service intangibility and its impact on consumer expectations of service quality. Journal of Services Marketing, 14(1), 9-26. 30.
數據
+6
相關文件
各縣市政府於提報自評資料時,下列四個考核項目權重為就業服務或就 業服務臺績效執行佔
機器人、餐飲服務、花藝、雲端運算、網路安全、3D 數位遊戲藝術、旅 館接待、行動應用開發、展示設計、數位建設
為配合政府推動六大新興產業及十大重點服務業之發展與開拓就業
為了更進一步的提升與改善本校資訊管理系 的服務品質,我們以統計量化的方式,建立
Schools may first relate the four basic learning areas (personal, social, academic and career development) to the personal level of students and then extend to the family and
個別動物輔助治療 (Individual Animal Assisted Therapy) 時數: 45 分鐘一節.. 與「狗」同行 - 犬隻輔助治療計劃
A marble texture can be made by using a Perlin function as an offset using a Perlin function as an offset to a cosine function. texture = cosine( x +
Wolfgang, "The Virtual Device: Expanding Wireless Communication Services through Service Discovery and Session Mobility", IEEE International Conference on
