行政院國家科學委員會專題研究計畫 成果報告
使用類神經網路模組應用於放射腫瘤治療計畫品質劑量指
標定量分析與副作用預測平台之研究
研究成果報告(精簡版)
計 畫 類 別 : 個別型 計 畫 編 號 : NSC 100-2221-E-151-003- 執 行 期 間 : 100 年 08 月 01 日至 101 年 07 月 31 日 執 行 單 位 : 國立高雄應用科技大學電子工程系 計 畫 主 持 人 : 李財福 共 同 主 持 人 : 汪昶佑、方富民、林淑媛 報 告 附 件 : 出席國際會議研究心得報告及發表論文 公 開 資 訊 : 本計畫可公開查詢中 華 民 國 101 年 09 月 08 日
中 文 摘 要 : 為了提供醫師值得信任可行的治療計劃品質指標,可作適合 治療模式安排的憑藉,使得治療計畫決策建立在科學的定量 治療計劃品質指標基礎上。本研究計畫中最主要的研究主題 是(一)將不同的治療計劃參數資料匯出轉譯成可程式的資 訊,進而使用 MatLab 程式設計分析,建構治療計畫品質指 標定量分析平台,就可將治療計劃資訊呈現在個人電腦,進 而評估分析比較各治療計劃的成效。(二)透過治療計畫品質 指標定量分析平台輸入資訊至欲建構之類神經網路,使之經 過訓練與學習,來建立一品質指標分析運作評估模型,可直 接分析資料提供劑量品質指標給醫師與病患作為選擇治療計 劃的參考,或可提升治療計劃重新規劃(re-planning)之品 質。 本研究探討三種使用不同訓練方式的類神經網路
(Artificial neural network, ANN)演算法,藉以評估運用 類神經網路專家系統於鼻咽癌放射治療計畫等級判斷之準確 率與可行性。藉由探討訓練時間、神經元數目、訓練資料量 及 ROC 的靈敏性和特異性分析系統特性,結果顯示,三種類 神經網路之中以 ANN-PR-loo 為最適合應用於鼻咽癌放射治療 計畫之等級判斷之網路。 中文關鍵詞: 放射治療,類神經網路,鼻咽癌。
英 文 摘 要 : In order to offer extra information to doctors for making the treatment decision, a quantitative Dosimetric Analysis Framework by using the preliminary results of quantitative dosimetric
indices analysis was accomplished in this project. It offers more dosimetric information to doctors for conducting the treatment planning by using the results of quantitative dosimetric indices analysis and the data shown in the Dosimetric Analysis
Framework.
There are two main subjects we have accomplished in this research:
A. To export the parameters in different treatment planning systems and translate them for programming. The software ‘MatLab’ was introduced to program and to create the quantitative Dosimetric Analysis
Framework. Then we can download the treatment plans data to the personal computer and evaluate the performance.
B. To build a neural network by using the preliminary results of quantitative dosimetric indices analysis. Through learning and training procedures, to obtain the quality index evaluation model, then it can offer extra information to doctors and patients for making treatment decision or to improve the quality of re-planning.
The main goal in this research is to evaluate the performance among the three neural artificial networks (ANN) with different training methods for radiation treatment plans. As the results, ANN-PR-loo is the best network among three ANN systems included in this study for the purpose of evaluating and predicting the quality of radiation treatment planning.
英文關鍵詞: artificial neural network (ANN), leave-one-out (LOO), nasopharyngeal carcinoma (NPC)。
NSC 100
2221
E
151
003
100
8
01
101
07
31
(
)
101
8
13
( ) MatLab
( )
(re-planning)
(Artificial neural network, ANN)
ROC
ANN-PR-loo
Abstract
In order to offer extra information to doctors for making the treatment decision, a quantitative
Dosimetric Analysis Framework by using the preliminary results of quantitative dosimetric indices
analysis was accomplished in this project. It offers more dosimetric information to doctors for conducting the treatment planning by using the results of quantitative dosimetric indices analysis and the data shown in the Dosimetric Analysis Framework.
There are two main subjects we have accomplished in this research:
A. To export the parameters in different treatment planning systems and translate them for programming. The software ‘MatLab’ was introduced to program and to create the quantitative
Dosimetric Analysis Framework. Then we can download the treatment plans data to the personal
computer and evaluate the performance.
B. To build a neural network by using the preliminary results of quantitative dosimetric indices analysis. Through learning and training procedures, to obtain the quality index evaluation model, then it can offer extra information to doctors and patients for making treatment decision or to improve the quality of re-planning.
The main goal in this research is to evaluate the performance among the three neural artificial networks (ANN) with different training methods for radiation treatment plans. As the results,
ANN-PR-loo is the best network among three ANN systems included in this study for the purpose of
evaluating and predicting the quality of radiation treatment planning.
keywords artificial neural network (ANN), leave-one-out (LOO), nasopharyngeal carcinoma (NPC)
[3, 4]
(artificial neural networks; ANN)
ROC(receiver operating characteristic)
(Artificial neural networks, ANN) Su M, et al.[5]
Shifeng Chen, et al.[6] (Radiation
pneumonitis) ROC 0.67 0.53
0.69 p=0.020
Mathieu, et al.[7] ANN
2 Isaksson, et al.[8] Feed -forward neural
network Borfeld et.al.[9] [10] ANN 3D IMRT - (Dose-Volume Histogram) (Receiver operative characteristic, ROC)[6] (Sensitivity) (Specificity)
RTOG (Radiation therapy oncology group) 0225 100
(NP=N100) NP P A B C D 4 25 (N25) I. II. Parallel III. Serial IV. [11, 12] i. a. (PTV) V93 V100 V110 V93 93% 97% V100 95% V110 110% 20% b.
(Spinal cord, SC) (Brainstem, BS) (Parotid) (Lens)
(Eye) (Oral) (Mandible)
i.
a. (Conformal index, CI) (PTV)
b. (Homogeneity Index, HI)
D=[ V93, V100, V110, SC, BS, rt Parotid, lt Parotid, Lens, rt eye, lt eye, Oral,
A. [13] 1 MATLAB7.10.0 Treatment planing Manual evaluation ANN Evaluation system Check criteria Ready for delivery Plan improvement suggestions Yes No 1. B.
(Artificial neural network, ANN)
MATLAB (Mathwork, Natick, MA)
i.
(Feed-Forward Networks, ANN-FF)
[3, 8, 9, 14, 15] I w
O ii.
(Elman Networks, ANN-E) (Simple
Recurrent Network, SRN) ANN-E
[16-19]
(Context Unit) iii.
(Pattern Recognition Networks, ANN-PR)
ANN-FF (Pattern) (Sensing)
(Measurements) (Preprocessing) (Features Extraction)
[20-24]
ANN-loo ANN-random ANN-user
ROC
I.
ANN-E
84% ANN-FF 84% ANN-PR 76%
1
1 ANN-E ANN-FF ANN-PR
ANN-E ANN-FF ANN-PR
(%) (s) (%) (s) (%) (s)
60 75.38 ±1.22 0.99±0.05 68.74±1.21 4.60±0.82 76.38±1.27 0.56±0.04 68 78.06±1.27 0.99±0.05 69.97±1.97 4.55±0.98 78.63±1.22 0.56±0.03 76 79.03±1.00 0.99±0.04 72.34±1.72 4.85±0.95 80.27±1.35 0.57±0.04 84 81.18±1.94 0.97±0.06 75.49±2.43 5.36±0.82 81.83±2.33 0.58±0.04
ANN-FF ANN-E ANN-PR
(%) (%)
(s)
II.
2
ANN-PR-loo (93.65±3.60) ANN-FF-loo
(88.05±5.84) ANN-E-loo (87.55±5.86)
ANN-PR-random(0.55±0.11) ANN-PR-user (0.58±0.08)
2 ANN-loo ANN-random ANN-user (%) (%) (s) ANN-loo ANN-E — 6 87.55±5.86 43.62±1.44 ANN-FF — 24 88.05±5.84 42.38±4.38 ANN-PR — 9 93.65±3.60 37.34±0.58 ANN-random ANN-E 84 26 83.13±7.34 1.08±0.13 ANN-FF 84 22 85.00±5.27 4.83±2.23 ANN-PR 76 4 77.71±2.80 0.55±0.11 ANN-user ANN-E 84 12 87.50±11.79 1.07±0.16 ANN-FF 84 8 85.00±9.86 4.33±3.00 ANN-PR 76 11 83.33±6.21 0.58±0.08
ANN-FF ANN-E ANN-PR ANN-loo LOO
ANN-random ANN-user
(%)
(%) (s)
III. ROC
ROC 2
ANN-PR-loo 99% 0% ANN-ELM-user 67% 36%
3
ANN-loo ROC
0.1 T h e p o si ti v e ra te
False positive rate
0.2 0.3 0.4 0.5 0.6 0.7 0.8 0.9 1.0 0.1 0.2 0.3 0.4 0.5 0.6 0.7 0.8 0.9 1.0 ANN-ELM ANN-FF ANN-PR
ANN-random ROC
0.1 T h e p o si ti v e ra te
False positive rate
0.2 0.3 0.4 0.5 0.6 0.7 0.8 0.9 1.0 0.1 0.2 0.3 0.4 0.5 0.6 0.7 0.8 0.9 1.0 ANN-ELM ANN-FF ANN-PR
ANN-user ROC
0.1 T h e p o si ti v e ra te
False positive rate
0.2 0.3 0.4 0.5 0.6 0.7 0.8 0.9 1.0 0.1 0.2 0.3 0.4 0.5 0.6 0.7 0.8 0.9 1.0 ANN-ELM ANN-FF ANN-PR (a) (b) (c)
2 ROC(a) ANN-loo (b) ANN-random (c) ANN-user
3 (%) (%) ANN-loo ANN-ELM 96 4 ANN-FF 96 0 ANN-PR 99 0 ANN-random ANN-ELM 77 16 ANN-FF 81 16 ANN-PR 88 36 ANN-user ANN-ELM 67 36 ANN-FF 77 24 ANN-PR 89 8
ANN-FF ANN-ELM ANN-PR ANN-loo LOO
ANN-random ANN-user
IV. MATLAB7.10.0 DVH 3 Dose (Gy) 80 70 60 50 40 30 20 10 Re la ti v e v o lu m e ( % n o rm a li ze d ) 0 20 0 40 60 80 100 PTV72.0-before improvement PTV72.0-after improvement Dose (Gy) 80 70 60 50 40 30 20 10 Re la ti v e v o lu m e ( % n o rm a li ze d ) 0 20 0 40 60 80 100 PTV72.0-before improvement PTV72.0-after improvement Dose (Gy) 80 70 60 50 40 30 20 10 Re la ti v e v o lu m e ( % n o rm a li ze d ) 0 20 0 40 60 80 100
Brain stem- before improvement Brain stem- after improvement Spine cord- before improvement Spine cord- after improvement Rt parotid- before improvement Rt parotid- after improvement Lt parotid- before improvement Lt parotid- after improvement Lens- before improvement Lens- after improvement Lt parotid Brain stem Spine cord Lens Rt parotid Dose (Gy) 80 70 60 50 40 30 20 10 Re la ti v e v o lu m e ( % n o rm a li ze d ) 0 20 0 40 60 80 100
Brain stem- before improvement Brain stem- after improvement Spine cord- before improvement Spine cord- after improvement Rt parotid- before improvement Rt parotid- after improvement Lt parotid- before improvement Lt parotid- after improvement Lens- before improvement Lens- after improvement Lt parotid Brain stem Spine cord Lens Rt parotid 3 DVH
[1] T. F. Lee, F. M. Fang, P. J. Chao, T. J. Su, L. K. Wang, et al., "Dosimetric comparisons of helical tomotherapy and step-and-shoot intensity-modulated radiotherapy in nasopharyngeal carcinoma," Radiotherapy and oncology, vol. 89, 2008 pp. 89-96.
[2] S. Webb, Contemporary IMRT: developing physics and clinical implementation: Taylor & Francis, 2004.
[3] J. O. D. J. R. Alaly and K. Zakaryan, "Obstacles and advances in intensity-modulated radiation therapy treatment planning," IMRT, IGRT, SBRT: advances in the treatment planning and delivery of radiotherapy, vol. 40, 2007 pp. 42.
[4] J. J. Wilkens, J. R. Alaly, K. Zakarian, W. L. Thorstad and J. O. Deasy, "IMRT treatment planning based on prioritizing prescription goals," Physics in medicine and biology, vol. 52, 2007 pp. 1675. [5] M. Su, M. Miften, C. Whiddon, X. Sun, K. Light, et al., "An artificial neural network for predicting the
incidence of radiation pneumonitis," Medical physics, vol. 32, 2005 pp. 318.
[6] S. Chen, S. Zhou, J. Zhang, F. F. Yin, L. B. Marks, et al., "A neural network model to predict lung radiation-induced pneumonitis," Medical physics, vol. 34, 2007 pp. 3420.
[7] R. Mathieu, E. Martin, R. Gschwind, L. Makovicka, S. Contassot-Vivier, et al., "Calculations of dose distributions using a neural network model," Physics in medicine and biology, vol. 50, 2005 pp. 1019. [8] M. Isaksson, J. Jalden and M. J. Murphy, "On using an adaptive neural network to predict lung tumor
motion during respiration for radiotherapy applications," Medical physics, vol. 32, 2005 pp. 3801. [9] T. Bortfeld and S. Webb, "Single-arc IMRT?," Physics in medicine and biology, vol. 54, 2009 pp. N9. [10] P. J. Chao, T. F. Lee, W. L. Huang, L. C. Chen, T. J. Su, et al., "Applications of Artificial Neural
Network to Building Statistical Models for Qualifying and Indexing Radiation Treatment Plans," [11] L. Tsair-Fwu, C. Pei-Ju, F. Fu-Min, S. Te-Jen, L. Stephen, et al., "Helical tomotherapy for single and
multiple liver tumours," Radiation Oncology, vol. 5,
[12] T. F. Lee, P. J. Chao, C. Y. Wang, J. H. Lan, Y. J. Huang, et al., "Dosimetric comparison of helical tomotherapy and dynamic conformal arc therapy in stereotactic radiosurgery for vestibular schwannomas," Medical Dosimetry, vol. 36, 2011 pp. 62-70.
[13] S. L. Gulliford, S. Webb, C. G. Rowbottom, D. W. Corne and D. P. Dearnaley, "Use of artificial neural networks to predict biological outcomes for patients receiving radical radiotherapy of the prostate," Radiotherapy and oncology, vol. 71, 2004 pp. 3-12.
[14] L. Jian, Y. Guanglei, Y. Hua, Z. Hongwei and A. Bing, "Bus protection ANN model with function approximation ability," 2005, pp. 1-478.
[15] L. Zhang, L. Jia and W. Zhu, "Overview of traffic flow hybrid ANN forecasting algorithm study," 2010, pp. V1-615-V611-619.
[16] Y. C. Cheng, W. M. Qi and J. Zhao, "A new Elman neural network and its dynamic properties," 2008, pp. 971-975.
[17] Z. Qi, M. Liu and H. Wang, "Process modeling method based on an improved Elman Neural Network," 2008, pp. 8188-8192.
[18] S. Gang, W. Lingling, X. Yongsheng and W. Xiuli, "Date Gas Load Forecasting With OIF-Elman Network," 2007, pp. 167-170.
[19] L. Hongmei, W. Shaoping and O. Pingchao, "Fault diagnosis based on improved Elman neural network for a hydraulic servo system," 2006, pp. 1-6.
[20] C. S. Weaver, "Some properties of threshold logic unit pattern recognition networks," Computers, IEEE Transactions on, vol. 100, 1975 pp. 290-298.
[21] S. Maruno, T. Imagawa, T. Kohda and Y. Shimeki, "Object recognition system using temporal pattern recognition networks with quantizer neuron chip," 1993, pp. 1285-1288 vol. 1282.
[22] A. H. Klopf and E. Gose, "An evolutionary pattern recognition network," Systems Science and Cybernetics, IEEE Transactions on, vol. 5, 1969 pp. 247-250.
[23] J. S. J. Lee and J. C. Bezdek, "A feature projection based adaptive pattern recognition network," 1988, pp. 497-505 vol. 491.
[24] M. Ulug, "Combining fuzzy pattern recognition and fuzzy control in an AI driven neural network," 1996, pp. 2071-2077 vol. 2073.
[25] F. Lampariello and M. Sciandrone, "Efficient training of RBF neural networks for pattern recognition," Neural Networks, IEEE Transactions on, vol. 12, 2001 pp. 1235-1242.
[26] M. Kolasa, R. Wojtyna, R. Długosz and W. Jóźwicki, "Application of Artificial Neural Network to Predict Survival Time for Patients with Bladder Cancer," Computers in Medical Activity, 2009 pp. 113-122.
[27] P. F. Bassi, E. Sacco, V. De Marco, M. Aragona and A. Volpe, "Prognostic accuracy of an artificial neural network in patients undergoing radical cystectomy for bladder cancer: a comparison with logistic regression analysis," BJU international, vol. 99, 2007 pp. 1007-1012.
1.
100
2.
100
3.
500
Elman(ELM)
(FF)
(PR)
3
4
(Receiver Operative Characteristic, ROC)
(A)
1. Tsair-Fwu Lee*, Hui-Min Ting, Pei-Ju Chao, Jia-Ming Wu, Ming-Yuan Cho, Hung-Yu Wang, Mong-Fong Horng, Chin-Shiuh Shieh, Eng-Yen Huang, Yu-Je Huang, Hui-Chun Chen, Fu-Min Fang. “Dosimetric advantages of generalised equivalent uniform dose (gEUD)-based optimisation on dose-volume objectives in intensity-modulated radiotherapy planning for bilateral breast cancer,” British Journal of Radiology 2012, NSC 100-2221-E-151-003. (SCI-IF:
2.062). accepted,
2. Tsair-Fwu Lee*, Pei-Ju Chao, Chang-Yu Wang, Wei-Luen Huang, Chiu-Ching Tuan, Mong-Fong Horng, Jia-Ming Wu, Shyh-An Yeh, Fu-Min Fang and Stephen Wan Leung. “An intelligence system approach using artificial neural networks to evaluate the quality of treatment planning for nasopharyngeal carcinoma,” Scientific Research and Essays SCI-IF: 0.445), vol.7 (23), pp.2076-2088, 21 June, 2012. ISSN: 1992-2248 NSC 100-2221-E-151-003. (Subject Categories: Multidisciplinary Sciences )
3. Tsair-Fwu Lee*, Pei-Ju Chao, Hui-Min Ting, Su-Hua Lo, Yu-Wen Wang, Chiu-Ching Tuan, Fu-Min Fang, Te-Jen Su*. “Comparative analysis of SmartArc-based dual arc volumetric modulated arc radiotherapy (VMAT) versus intensity-modulated radiotherapy (IMRT) for nasopharyngeal carcinoma,” Journal of Applied Clinical Medical Physics vol.12, no.4, pp.158-174, Fall 2011, (SCI-IF: 1.291). NSC 100-2221-E-151-003. ISSN: 1526-9914. 87/113, (Subject Categories: Radiology, Nuclear Medicine & Medical Imaging)
(B)
1. Tsair-Fwu Lee, Chang-Yu Lee, Pei-Ju Chao, Li-Fu Wu, Chin-Shiuh Shieh, Ping-Shou Cheng, Kuan-Cho Liao and Chun-Hsiung Fang, “ A Fuzzy System for Evaluating Radiation Treatment Plans of Head and Neck Cancer” the 2012 Ninth International Conference on Fuzzy Systems and Knowledge Discovery (FSKD'12), pp.521-525. 29-31 May 2012, in Chongqing, China. NSC 100-2221-E-151-003,
2. Tsair-Fwu Lee, Tsung-I Liao, Pei-Ju Chao, Hui-Min Ting, Jia-Ming Wu, Wen-Pen Chen, Chin-Shiuh Shieh, Kuan-Cho Liao, Fu-Min Fang, “ Quality of Treatment Planning Evaluation for Head and Neck Cancer Using Artificial Neural Networks Intelligence System,” 2012 International Conference on Agricultural, Food and Biological Engineering (ICAFBE 2012), May 11-13, 2012. in Guangzhou, China. NSC 100-2221-E-151-003,
3. , , , ,“ ”
(ILT 2012), pp.1256-1259. Jun. 1, 2012, Taichung, Taiwan. NSC 100-2221-E-151-003.
(ILT 2012), pp.705-708. Jun. 1, 2012, Taichung, Taiwan. NSC 100-2221-E-151-003.
(C)
1. 2012 INPEX--27 (Gold Medal) Jun 13-15, 2012.
Intelligent rehabilitation flexbar with cloud services. 2. Jun 2012. 3. Jun 2012. 4. 2012 ( ) Apr 2012. 5. 2012 ( ) Apr 2012. 6. 100 Dec 2011.
行政院國家科學委員會補助國內研究生出席國際學術會議報告
100 年 8 月 8 日 報告人姓名 吳立夫 就讀校院 (科系所) 國立高雄應用科技大學 電子工程系 □博士班研究生 ■碩士班研究生 會議時間 會議地點 100 年 5 月 27 日至 6 月 1 日 中國 重慶 本會核定 補助文號 NSC 100-2221-E-151-003- 會議名稱 (中文) 模糊系統與知識發現國際學術會議(英文) International Conference on Fuzzy Systems and Knowledge Discovery
發表論文 題目
(中文) 評估頭頸部癌症放射治療計畫之模糊系統
(英文) A Fuzzy System for Evaluating Radiation Treatment Plans of Head and Neck Cancer
報告內容應包括下列各項: 一、參加會議經過
此會議由 IEEE 與重慶郵電大學共同主辦的模糊系統與知識發現國際學術會議 (2012 International Conference on Fuzzy Systems and Knowledge Discovery),會議於 5 月 29 日至 5 月
31 日,在中國重慶 Chongqing Wanyou Conifer Hotel 舉行。會議吸引了來自世界各國學術界
及產業界許多的專家學者參與,會議主要討論自然計算 (Natural Computation)與模糊系統 (Fuzzy Systems)兩大主題,深入探討各國對於模糊系統在各領域發展現況與經驗交流。會期
一共三天,包括了第一天上午開幕式與大會所邀請的專家專題講座,以及接續兩天的的論文 發表討論會。在此會議期間,除了和與會人士交流與研討之外,依照議程於五月二十九日壁 報發表以「A Fuzzy System for Evaluating Radiation Treatment Plans of Head and Neck Cancer」 為題的論文後返國。 二、 與會心得 隨著科技的創新進步、人工智慧的演進,模糊理論已經廣泛運用到醫學、工程、商業… 等各種種領域。參加這次大會讓我體會模糊理論能夠廣泛運用在各個領運用,並且可靠度都 有很高的水準,並且看到在未來創新運用的各種可能性。同時也藉由與來自世界各的與會人 士討論與互動中,學習各種模糊集合的發展現況,對於將來的研究都有很大的幫助。
三、 考察參觀活動(無是項活動者省略) 無 四、 建議 參加國際論文研討會,除了可以發表自己的研究成果以外,透過投稿過程的學習,增進 學生本身的英文能力及學術能力。並且在會議進行中,與世界各國的學者交流,除了可增加 國際能見度外,吸收各國學者在學術領域之經驗,可以有效增加學生的國際競爭力。因此, 建議應多鼓勵學生參加相關的國際論文研討會,正所謂讀萬卷書更應行萬里路,特別是在全 球化的時代,要能夠多方接觸以增長見識。 五、 攜回資料名稱及內容
International Conference on Fuzzy Systems and Knowledge Discovery 大會手冊:包括各日議
程、各篇文章摘要。
六、 其他
2012 9th International Conference on Fuzzy Systems and Knowledge Discovery (FSKD2012)
A Fuzzy System for Evaluating Radiation Treatment
Plans of Head and Neck Cancer
Tsair-Fwu Lee1,*, Chang-Yu Lee2, Pei-Ju Chao1,3,*, Li-Fu Wu1, Chin-Shiuh Shieh1, Ping-Shou Cheng1,
Kuan-Cho Liao3 and Chun-Hsiung Fang2
1Medical Physics & Informatics Lab., Department of Electronics Engineering, 2Department of Electrical Engineering,
National Kaohsiung University of Applied Sciences, Kaohsiung, Taiwan, ROC
3Department of Radiation Oncology, Kaohsiung Chang Gung Memorial Hospital and Chang Gung University College
of Medicine, Kaohsiung, Taiwan, ROC
*Corresponding authors; e-mail: [email protected], [email protected]
Abstract—In this study, 14 treatment planning dose parameters for head and neck cancer are adopted as the characteristic functions to establish the statistical analysis of the fuzzy system module for radiation treatment plan classification. By constructing fuzzy rules and fuzzy set membership functions, we aim to improve the classification efficiency and accuracy by the fuzzy systems, and to improve the quality of the treatment plan. Three different fuzzy logic control systems were used for analysis of 100 Pinnacle treatment planning system datasets. The results show that the accuracy may be up to 100%. The fuzzy logic control system we propose may be a useful tool for accurate planning and decision-making.
Keywords-dose parameter; treatment plan; fuzzy system; head and neck cancer
I. INTRODUCTION
The head and neck (H&N) is a complex part of the human body that possesses many exclusive functions, e.g. chewing, swallowing and linguistic ability. However, these functions deteriorate to a different degree—on a case-by-case basis—when people have H&N cancer or after irradiation treatment. It is defined as "H&N cancer" if it is found in the paranasal sinus, nasal cavity, nasopharyngeal, oral cavity, throat or parotid glands. H&N cancers make up about 50% of cancers in Asia. Clinically IMRT (intensity modulated radiation therapy) is the most common technique to deliver radiation doses to H&N cancer patients, because IMRT is capable of delivering a high dose to the irregular tumours, and prevents organs at risk and normal tissues from being exposed to radiation. However, it is usually difficult to complete a suitable IMRT plan at one time because both the patient’s condition and some complex formulas need to be considered simultaneously [1]. A treatment plan that results in a higher planning target volume (PTV) coverage and reduce the complications in normal tissues is preferred, and this may be done after several attempts using trial and error. The dose parameters, dose indices, treatment volume and dose coverage are discussed in this paper to find out how much they affect the quality of a plan, and then the fuzzy analysed modules are modelled by those parameters—so-called characteristic functions—to achieve the purpose of combining electronic and biomedical engineering. The dose
parameters of a treatment plan function as characteristic functions to build fuzzy rules and membership functions to obtain the correlation values; it is an alternative way to optimize the parameters of treatment plans.
II. MATERIALS AND METHODS
A. Data Analysis
The main goal of this study focuses on treatment plans of NPC, which are calculated by the Pinnacle system with 6MV X-ray and 7-field IMRT [2]. The prescribed doses are delivered in three phases, i.e. 7000, 5940 and 5400 cGy. The SIB (simultaneous integrated boost) is also taken into consideration in each phase so that a 212/180/167 cGy daily dose is given in a 33-fraction course. Each treatment plan of NPC possesses its own dose indices and parameters, and then an expert system based on those parameters is constructed. This system offers comments on radiation volumes of tumours and normal tissues against radiation doses, and it also reminds users of the dose constraints of different organs and suggests optimal values of the conformity and homogeneity index when a treatment plan is set-up [3, 4]. Every treatment plan involves fourteen different parameters to be assessed that are described as follows.
z Dose Parameters:
1. V93, V100 and V110 are used to define how the PTV
(planned target volume) is under coverage of the radiation dose. In the case of V93, it means more than 97% of PTV is covered by 93% of the prescribed dose; similarly, V100 means that the prescribed dose should cover more than 95% of the defined volume. Finally, 110% of prescribed dose must be kept within 20% of the total defined volume that is named V110.
2. Evaluation of critical organs: the maximum dose for
the SC (spinal cord); the maximum dose for the BS (brain stem); the average dose for the right parotid; the average dose for the left parotid; the maximum dose for the lens; the maximum dose for the right eye; the maximum dose for the left eye; the average dose for the oral cavity; and the average dose for the mandible.
z Dose Indices
This study was supported financially, in part, by grants from the National Science Council (NSC) of the Executive Yuan of the Republic of China.NSC 100-2221-E-151-003 and CGMH(CMRPG890062).
1. CI (conformity index): This index indicates a ratio to evaluate the fitness of the PTV to the prescription isodose volume in treatment plans; if CI is >1, this means the treated volume is larger than defined volume, or <1 in the opposite case.
2. HI (homogeneity index): HI indicates how evenly the delivered dose is distributed within the defined volume, and it is defined as the proportion of the maximum dose to a specified dose.
One hundred sets of treatment plans are taken into account and classified into four levels that are described as follows:
[A] Treatment plan is qualified and ready to be executed with the physician’s approval.
[B] One or more parallel organs' accepted doses are out of tolerance.
[C] Any serial organs' accepted doses are out of tolerance. [D] Any condition of a treatment plan breaks the standard
rules.
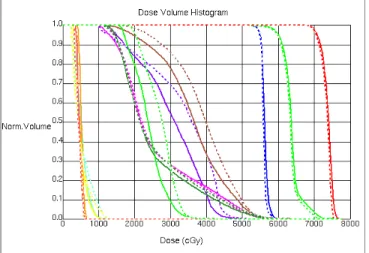
The two most popular ways that are clinically adopted to score treatment plans are the isodose curve and DVH (dose volume histogram). The former is an irregularly enclosed curve on which the radiation dose at any specified point is the same on a two-dimensional image, and any two different curves do not intersect with each other and centre along the central axis of a radiation beam. DVH is based on the relationship of the volume of critical organs or PTVs with dose variations and plotted in curves of which the vertical axis stands for nominal volume and horizontal axis stands for radiation dose.
m R
U⊂ V Rn
⊂
Figure 1. A block diagram of fuzzy system
B. Fuzzy System
The constructed fuzzy modules correlate with the fuzzy sets and the rules and their theory is based on the approximation reasoning that deals with message and semantic messages to recognize nonlinear dynamic modules [5, 6].
The work flowchart of a fuzzy system is shown in Fig.1, which combines four parts [7]. The fuzzy rule base is the most important component of the system as it is used to make a decision when input signals are imported. The second part is the fuzzy inference engine which is used to transfer the variables in the space U⊂Rm onto the space
n
R
V⊂ and it is given that U =U1×U2×"×Um and
n V V V V = 1× 2×"× where Ui,Vj ⊂R , i=1 ",2, ,m and n
j=1 ",2, , . The function of the fuzzifier is transferring the source data into fuzzy variables. The last one— the defuzzifier—is a procedure that turns the fuzzy variables into digital outputs [8, 9]. Based on many proposed publications [10, 11], they state that the fuzzy logic controller is a solution in many applications; therefore, this controller is applied to a static fuzzy system.
A set is a collection of finite or infinite components and each one of those components has the same character; however, this definition is slightly modified in fuzzy sets. The characteristic function in conventional set theory only has binary outcomes {0, 1}, and any event is illegal and not allowed to happen except for those two outcomes; however, a modern characteristic function in fuzzy theory turns an input into the form of degrees which means the outcomes are continuous multi-valued from the range 0-1 and it is called the membership function. There are four types of membership function adopted, which are triangle, trapezoid, S-liked and Z-liked functions.
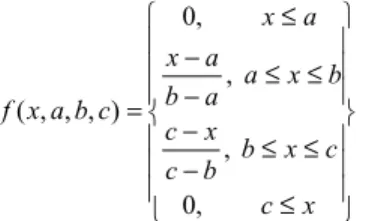
The triangle set is the most popular fuzzy set that has been used, and its range is divided into three linear sections at three points a, b, and c, which are defined as follows:
⎪ ⎪ ⎪ ⎭ ⎪ ⎪ ⎪ ⎬ ⎫ ⎪ ⎪ ⎪ ⎩ ⎪ ⎪ ⎪ ⎨ ⎧ ≤ ≤ ≤ − − ≤ ≤ − − ≤ = x c c x b b c x c b x a a b a x a x c b a x f , 0 , , , 0 ) , , , ( (1)
The trapezoid set has four vertexes, named a0, a1, a2, and a3, which are described in equation (2).
⎪ ⎪ ⎪ ⎪ ⎭ ⎪ ⎪ ⎪ ⎪ ⎬ ⎫ ⎪ ⎪ ⎪ ⎪ ⎩ ⎪ ⎪ ⎪ ⎪ ⎨ ⎧ ≤ ≤ ≤ − − ≤ ≤ ≤ ≤ − − ≤ = x a a x a a a x a a x a a x a a a a x a x a a a a x f 3 3 2 2 3 3 2 1 1 0 0 1 0 0 3 2 1 0 , 0 , , 1 , , 0 ) , , , , ( (2)
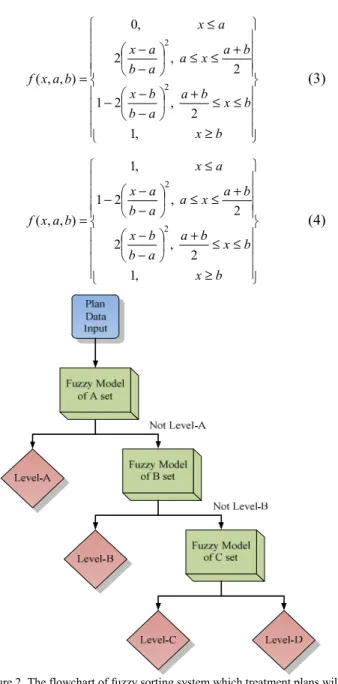
S-liked and Z-liked sets are described in equation (3) and (4), as follows:
⎪ ⎪ ⎪ ⎪ ⎭ ⎪⎪ ⎪ ⎪ ⎬ ⎫ ⎪ ⎪ ⎪ ⎪ ⎩ ⎪⎪ ⎪ ⎪ ⎨ ⎧ ≥ ≤ ≤ + ⎟ ⎠ ⎞ ⎜ ⎝ ⎛ − − − + ≤ ≤ ⎟ ⎠ ⎞ ⎜ ⎝ ⎛ − − ≤ = b x b x b a a b b x b a x a a b a x a x b a x f , 1 2 , 2 1 2 , 2 , 0 ) , , ( 2 2 (3) ⎪ ⎪ ⎪ ⎪ ⎭ ⎪⎪ ⎪ ⎪ ⎬ ⎫ ⎪ ⎪ ⎪ ⎪ ⎩ ⎪⎪ ⎪ ⎪ ⎨ ⎧ ≥ ≤ ≤ + ⎟ ⎠ ⎞ ⎜ ⎝ ⎛ − − + ≤ ≤ ⎟ ⎠ ⎞ ⎜ ⎝ ⎛ − − − ≤ = b x b x b a a b b x b a x a a b a x a x b a x f , 1 2 , 2 2 , 2 1 , 1 ) , , ( 2 2 (4)
Figure 2. The flowchart of fuzzy sorting system which treatment plans will be categorized into four levels.
Fuzzy rules are actually programed by many IF-THEN loops [8, 9] where IF denotes a critical condition and THEN directs to an execution or action, this conditional relationship is convenient for us to edit programs, and equations (5) and (6) are an example:
] , , , [R1 R2 Rm R= " (5) ) is , , is ( THEN ); and and is ( IF : 1 1 1 1 l q p l l p p l l G y G y F is x F x R " " (6) Where T m x x x x=( 1, 2,", ) and T n y y y y=( 1, 2,", ) are input and output vectors respectively. Further, l
i
F and G are lj mapping onto sets Ui andVj, respectively, where1≤p≤m,
n q≤
≤
1 andl=1 ",2, ,m. Therefore, Rl can be represented
as equation (7) and (8): ] , , , [ 1 2 l q l l l R R R R = " (7) ) is ( THEN ); and and is ( IF : 1 1 l j j l p p l l G y F is x F x R " (8) where j=1 ",2, ,q
Figure 3. The details of Model A which include 7 fuzzy rules and numbers in parenthesis in input and output blocks denote fuzzy sets. TABLE I. FUZZY RULES
Characteristic
Function Fuzzy set Rule
A 5(14) 34 7
B 6(14) 32 69
C 3(14) 37 30
A, B, and C denotes three different fuzzy models, respectively. The number of characteristic functions is denoted in parentheses in the first column.
In our study, the concept of a fuzzy control system is adopted to design three different fuzzy models as shown in Fig. 2. Fourteen dose parameters as characteristic functions will be extracted from any treatment plan that we wish to evaluate. These parameters are initially sent into model A; this plan will be arranged in Level A if its conditions are satisfied with the fuzzy rules in this model. If it is not, then it steps into the next model, and so on, until the whole procedure is complete; finally, those plans are grouped in four levels. There is one extreme case that if Model A does not receive any legal source at the beginning, then seven fuzzy rules embedded in this model, shown in Fig. 3, are activated immediately. Those fuzzy rules will find the
optimal parameters of a treatment plan as the threshold values to maximize the accuracy of the fuzzy system [12]
III. RESULTS
In Fig. 4, the dashed lines denote treatment plans without comments from an expert system; otherwise, the solid lines denote plans with comments. The red, green and blue curves represent PTVs that are under specified doses and the farthest to right in Fig.4, and the others are critical organs.
Figure 4. Treatment plans with (dashed lines) and without (solid lines) fuzzy system comments are compared in DVHs.
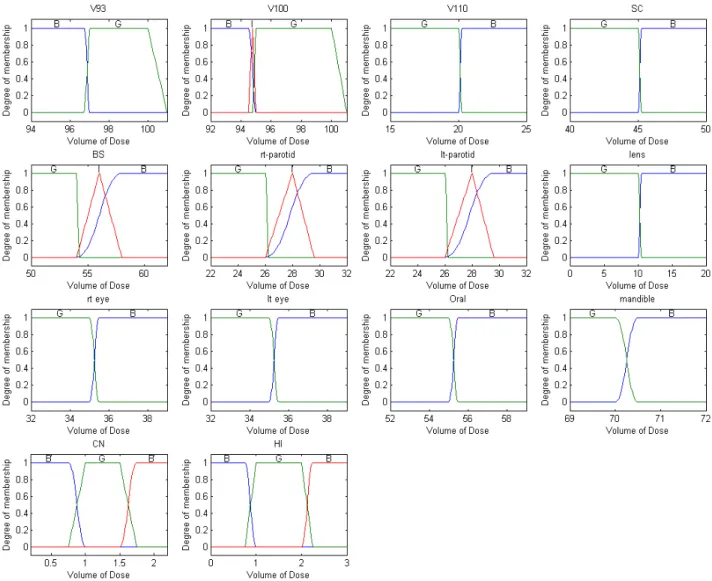
As mentioned previously, three fuzzy models are instructed to evaluate treatment plans, and the fuzzy sets in Model A are plotted in Fig. 5. In those figures, the vertical axis denotes membership function in the range 0-1, and the horizontal axis denotes the dose volume; moreover, the coordinate in each plot can be divided into three regions, which are named G (good), I (intermediate) and B (bad). The fuzzy logic control system used are expressed in Table I
TABLE II. EVALUATION RESULTS
Executions Selected result Output result
Model A Level A 25(100) 25(100) others 75(100) 75(100) Model B Level B 25(75) 25(75) others 50(75) 50(75) Model C Level C 25(50) 25(50) Level D 25(50) 25(50)
The execution column represents what instruction needs to be executed. The selected result column denotes how many treatment plans passed and are sorted out in its model. The total number of execution are listed in the parentheses
The statistical results are shown in Table II. One hundred sets of treatment plans are sent into this well-designed fuzzy system, the first 25 grade A sets of plans are sorted from them into Model A as depicted in Fig. 6 (a). The
other 75 sets are delivered to the next stage, Model B. As shown in Fig. 6 (b), 25 sets are screened out and the rest 50 sets are delivered to the next stage, Model C. As shown in Fig. 6 (c), grade C or D are screened from the rest. Eventually, those treatment plans are evenly categorized between the four groups.
IV. DISCUSSIONS AND CONCLUSIONS
The fuzzy control theory is used to design three different fuzzy models and to classify treatment plans into Level A, B, C, and D. According to our design, Model A had a much higher threshold value that includes 34 membership functions and seven fuzzy rules; Model B possesses 32 membership functions and 69 fuzzy rules; 37 membership functions and 30 fuzzy rules are embedded in Model C. Those three models cannot be merged into one because of the different thresholds and characteristic functions etc. If it was to be done, it would involve more than 36864 fuzzy rules to be instructed, and it would consume a large amount of memory and slow down the CPU. Therefore, we have made an effective way to design an excellent fuzzy expert system to evaluate treatment plans.
ACKNOWLEDGMENT
The authors wish to acknowledge the help of Dr. Stephen Wan Leung for technical support and assistance.
REFERENCES
[1]. Gulliford SL, Webb S, Rowbottom CG, et al. Use of artificial neural networks to predict biological outcomes for patients receiving radical radiotherapy of the prostate. Radiotherapy and oncology. 2004;71(1):3-12.
[2]. Chao PJ, Lee TF, Huang WL, et al. Applications of artificial neural network to building statistical models for qualifying and indexing radiation treatment plans. World Academy of Science, Engineering
and Technology. 2010;70:37-42.
[3]. Lee TF, Chao PJ, Wang CY, et al. Dosimetric comparison of helical tomotherapy and dynamic conformal arc therapy in stereotactic radiosurgery for vestibular schwannomas. Med Dosim. 2011 Spring;36(1):62-70.
[4]. Lee TF, Fang FM, Chao PJ, et al. Dosimetric comparisons of helical tomotherapy and step-and-shoot intensity-modulated radiotherapy in nasopharyngeal carcinoma. Radiother Oncol. 2008 Oct;89(1):89-96. [5]. Chang YC, Chen SM, Liau CJ. Fuzzy interpolative reasoning for
sparse fuzzy-rule-based systems based on the areas of fuzzy sets.
Fuzzy Systems, IEEE Transactions on. 2008;16(5):1285-301.
[6]. Huang Z, Shen Q. Fuzzy interpolative reasoning via scale and move transformations. Fuzzy Systems, IEEE Transactions on.
2006;14(2):340-59.
[7]. Alci M, Asyali MH. Nonlinear system identification via Laguerre network based fuzzy systems. Fuzzy Sets and Systems. 2009;160(24):3518-29.
[8]. Orriols-Puig A, Casillas J, Bernadó-Mansilla E. Fuzzy-UCS: a Michigan-style learning fuzzy-classifier system for supervised learning. Evolutionary Computation, IEEE Transactions on. 2009;13(2):260-83.
[9]. Pulkkinen P, Koivisto H. Fuzzy classifier identification using decision tree and multiobjective evolutionary algorithms. International Journal
of Approximate Reasoning. 2008;48(2):526-43.
[10]. Cecati C, Ciancetta F, Siano P. A multilevel inverter for photovoltaic systems with fuzzy logic control. Industrial Electronics, IEEE
Transactions on. 2010;57(12):4115-25.
[11]. Thomya A, Khunatorn Y. Designof control system of hydrogen and oxygen flow rate for proton exchange membrane fuel cell using fuzzy logic controller. Energy Procedia. 2011;9:186-97.
[12]. Tao W, Jin H, Liu L. Object segmentation using ant colony optimization algorithm and fuzzy entropy. Pattern Recognition
Letters. 2007;28(7):788-96
Figure 5. Fuzzy set of Model A: the figures are plotted with dose volume against degree of membership which “G” denotes good, “I” denotes intermediate and “B” denotes bad, respectively.
(a) Model A (b) Model B (c) Model C Figure 6. The sorted results of the fuzzy models.
國科會補助計畫衍生研發成果推廣資料表
日期:2012/08/30國科會補助計畫
計畫名稱: 使用類神經網路模組應用於放射腫瘤治療計畫品質劑量指標定量分析與副作 用預測平台之研究 計畫主持人: 李財福 計畫編號: 100-2221-E-151-003- 學門領域: 醫學資訊無研發成果推廣資料
100 年度專題研究計畫研究成果彙整表
計畫主持人:李財福 計畫編號: 100-2221-E-151-003-計畫名稱:使用類神經網路模組應用於放射腫瘤治療計畫品質劑量指標定量分析與副作用預測平台之 研究 量化 成果項目 實際已達成 數(被接受 或已發表) 預期總達成 數(含實際已 達成數) 本計畫實 際貢獻百 分比 單位 備 註 ( 質 化 說 明:如 數 個 計 畫 共 同 成 果、成 果 列 為 該 期 刊 之 封 面 故 事 ... 等) 期刊論文 0 0 100% 研究報告/技術報告 0 0 100% 研討會論文 2 1 100% 篇 論文著作 專書 0 0 100% 申請中件數 0 0 100% 專利 已獲得件數 0 0 100% 件 件數 0 0 100% 件 技術移轉 權利金 0 0 100% 千元 碩士生 0 0 100% 博士生 0 0 100% 博士後研究員 0 0 100% 國內 參與計畫人力 (本國籍) 專任助理 0 0 100% 人次 期刊論文 3 1 100% 研究報告/技術報告 0 0 100% 研討會論文 2 1 100% 篇 論文著作 專書 0 0 100% 章/本 申請中件數 0 0 100% 專利 已獲得件數 0 0 100% 件 件數 0 0 100% 件 技術移轉 權利金 0 0 100% 千元 碩士生 2 2 100% 博士生 2 2 100% 博士後研究員 0 0 100% 國外 參與計畫人力 (外國籍) 專任助理 0 0 100% 人次其他成果
(
無法以量化表達之成 果如辦理學術活動、獲 得獎項、重要國際合 作、研究成果國際影響 力及其他協助產業技 術發展之具體效益事 項等,請以文字敘述填 列。) 參賽得獎1. 2012 INPEX--27 屆美國匹茲堡發明展金牌獎 (Gold Medal),Jun 13-15, 2012. 作 品 名 稱 「 具 雲 端 服 務 功 能 的 智 慧 型 復 健 棒 」 Intelligent rehabilitation flexbar with cloud services.
2. 指導學生林世耀、江競川,榮獲「第七屆智慧生活科技研討會」,智慧型控 制系統領域論文佳作,Jun 2012. 作品名稱「使用最大似然估計法評估放射治 療後口乾症併發機率」 3. 指導學生林世耀、吳立夫、陳柏亮參加「茂迪盃-太陽能光電應用設計創意 競賽」,榮獲入選獎,Jun 2012. 4. 指導學生戴嘉昌、蔡學毅、江競川、吳立夫參加「2012 第八屆電子創意競 賽」,獲得電子設計類(大專組)第二名,Apr 2012. 5. 指導學生方智顯、江競川、柯逸軒、張鏵方參加「2012 第八屆電子創意競 賽」,獲得資訊類(大專組) 佳作,Apr 2012. 6. 指導學生林宸彬、黃明城,榮獲「100 學年度電子工程系畢業專題競賽」電 子組第二名,Dec 2011. 成果項目 量化 名稱或內容性質簡述 測驗工具(含質性與量性) 0 課程/模組 0 電腦及網路系統或工具 0 教材 0 舉辦之活動/競賽 0 研討會/工作坊 0 電子報、網站 0 科 教 處 計 畫 加 填 項 目 計畫成果推廣之參與(閱聽)人數 0
國科會補助專題研究計畫成果報告自評表
請就研究內容與原計畫相符程度、達成預期目標情況、研究成果之學術或應用價
值(簡要敘述成果所代表之意義、價值、影響或進一步發展之可能性)
、是否適
合在學術期刊發表或申請專利、主要發現或其他有關價值等,作一綜合評估。
1. 請就研究內容與原計畫相符程度、達成預期目標情況作一綜合評估
■達成目標
□未達成目標(請說明,以 100 字為限)
□實驗失敗
□因故實驗中斷
□其他原因
說明:
2. 研究成果在學術期刊發表或申請專利等情形:
論文:■已發表 □未發表之文稿 □撰寫中 □無
專利:□已獲得 □申請中 ■無
技轉:□已技轉 □洽談中 ■無
其他:(以 100 字為限)
3. 請依學術成就、技術創新、社會影響等方面,評估研究成果之學術或應用價
值(簡要敘述成果所代表之意義、價值、影響或進一步發展之可能性)(以
500 字為限)
本研究藉由人工類神經網路技術改善成本函數的處理過程和減少治療計劃試誤次數且縮 短評估治療計畫速度。提出並討論 Elman(ELM) 、前饋式 (FF) 和圖形識別 (PR) 三種神 經網路應用在鼻咽癌病患治療計畫評估的準確率及特性。本研究成果目前己發表期刊論文 3 篇,研討會論文 4 篇,而目前國內此相關研究並不多,主要是跨領域之整合具有相當的 難度,而本研究團隊成員有醫學方面專業,如放射腫瘤專科醫師及醫學物理師,並結合具 有演算法、醫學工程及放射物理之專長的工程人員,而使此研究有創新發展及價值性。 本研究成果,本研究藉由探討訓練時間、神經元數目、訓練資料量及接收操作特徵曲線 (Receiver Operative Characteristic, ROC)的靈敏性和特異性(Specificity),結果顯 示,三種類神經網路之中(ANN-PR-loo)為最適合應用於鼻咽癌放射治療計畫之等級判斷。 未來希望在研究希望能運用不同演算法及加入生活品質的關連程度來評估最佳之生物指 標的方法,以利提供放射治療新的目標。 本研究藉由人工類神經網路技術改善成本函數的處理過程和減少治療計劃試誤次數且縮 短評估治療計畫速度。提出並討論 Elman(ELM) 、前饋式 (FF) 和圖形識別 (PR) 三種神 經網路應用在鼻咽癌病患治療計畫評估的準確率及特性。本研究成果目前己發表期刊論文 3 篇,研討會論文 4 篇,而目前國內此相關研究並不多,主要是跨領域之整合具有相當的 難度,而本研究團隊成員有醫學方面專業,如放射腫瘤專科醫師及醫學物理師,並結合具 有演算法、醫學工程及放射物理之專長的工程人員,而使此研究有創新發展及價值性。(Receiver Operative Characteristic, ROC)的靈敏性和特異性(Specificity),結果顯 示,三種類神經網路之中(ANN-PR-loo)為最適合應用於鼻咽癌放射治療計畫之等級判斷。 未來希望在研究希望能運用不同演算法及加入生活品質的關連程度來評估最佳之生物指 標的方法,以利提供放射治療新的目標。