PC牙線盒射出成型之翹曲及收縮量最佳化分析
78
0
0
全文
(2) PC 牙線盒射出成型之翹曲及收縮量最佳化分析 Optimal Analysis of the Warpage and Shrinkage of Polycarbonate (PC) Dental Floss Box in Injection Molding Process 研 究 生:梅文俊. Jun- Mei Wen. 指導教授:黃世疇. Shyh- Chour Huang. 國立高雄應用科技大學 製造與管理外國學生碩士專班 101 春季班 碩士論文 A thesis Submitted to Department of Mechanical Engineering National Kaohsiung University of Applied Sciences in Partial Fulfillment of the Requirements for the Degree of Master of Engineering in International Industry Research Master Program for International Business Management and Manufacturing. June 2014 Kaohsiung, Taiwan, Republic of China 中華民國 103 年 6 月.
(3) PC 牙線盒射出成型之翹曲及收縮量最佳化分析 研究生:梅文俊. 指導教授:黃世疇 教授. 國立高雄應用科技大學 製造與管理外國學生碩士專班 101 春季班 摘要 近年來,射出成型產業需要更好產品品質之需求日益重要。因此為了減少產 品的缺陷(翹曲、收縮),以獲得最好的品質,射出成型過程中參數的最佳化是很 重要的。在本研究,以田口方法尋求最佳化參數以得到最小的翹曲和收縮。文中 以聚碳酸酯(PC)射出牙線盒,並探討各參數之最佳化(融膠溫度,保壓壓力, 保壓時間),其他參數則是固定的(冷卻時間 15s,射出壓力 180MPa,模具溫度 91,50C,冷水溫度 250C),S/N 比作為認定最佳化參數。結果顯示,3000C 的融 膠溫度、160MPa 的保壓壓力、6s 的保壓時間會得到最小翹曲與收縮,其翹曲值 為 0.199mm,收縮值為 1.695%。研究中並發現保壓時間對翹曲和收縮值有最大的 影響。. 關鍵字:翹曲和收縮,田口方法,射出成型. i.
(4) Optimal Analysis of the Warpage and Shrinkage of Polycarbonate (PC) Dental Floss Box in Injection Molding Process Student: Jun-Wen Mei. Advisors: Prof. Shyh-Chour Huang. International Industry Research Master Program for International Business Management and Manufacturing National Kaohsiung University of Applied Sciences. Abstract Today more than ever, the injection molding industry demands better product quality. Therefore, the optimal process conditions are important in injection molding process to reduce defects of product such as warpage and shrinkage to obtain the best product quality. In this study, optimal injection molding parameters for minimum warpage and shrinkage were determined by Taguchi method. Polycarbonate (PC) was injected in dental floss box-shaped under various change process parameters: melt temperature, packing pressure, and packing time. Other parameters such as cooling time, injection pressure, mold temperature, and water temperature are constant and their values are 15s, 180Mpa, 91,5oC, 25oC, respectively. Signal to noise (S/N) ratios were utilized for determining the optimal set of parameters. According to the result, melt temperature at 300oC, packing pressure at 160MPa, and packing time at 6s gave minimum warpage and minimum shrinkage, that values are 0.199mm and 1.695%, respectively. The study also found out the most significant parameters, which had the biggest effect on warpage and shrinkage is packing time. Keywords: Warpage and Shrinkage, Taguchi Method, Injection Molding. ii.
(5) Acknowledgments I would like to express my sincere thanks to everyone who have been helped me for my master program at National Kaohsiung University of Applied Sciences. It is my great pleasure to be guided, motivated and supported by Professor Dr. Shyh-Chour Huang, who is always available to me for all conditions for research of my thesis. Thanks my adviser who gave me an opportunity deep study about the field of plastic injection molding. I would like to acknowledge Professor Dr. Wang Chia Nan for his support and encouragement during the time I have studied in National Kaohsiung University of Applied Sciences. I would like to acknowledge Professor Dr. Wang Min Wen who supports me Moldex3D software to simulate in research. I also would like to thank all my friends in my laboratory for their technical assistance. Finally, it is a great time to mention about my friend in Taiwan. I never have forgotten the time I studied here, when we have a lot of memory with us. The time in here is as an image inculcated in my mind. Taiwan, June 2014 Tuan-Van Mai. iii.
(6) Contents Abstract (Chinese) ............................................................................................................. i Abstract (English) ............................................................................................................. ii Acknowledgments ............................................................................................................ ii Contents............................................................................................................................iv Table List..........................................................................................................................vi Figure List ........................................................................................................................vi List of Symbols.................................................................................................................ix Chapter 1. Introduction ................................................................................................1. 1.1 General background ...................................................................................................1 1.1.1 General introdcuction of plastic injection molding..............................................1 1.1.2 The general introduction process of producing in the plastic mold company .......5 1.2 Objective of the study ................................................................................................6 Chapter 2. Literature Review ......................................................................................9. 2.1 The influence of warpage and shrinkage to quality of product....................................9 2.1.1 Shrinkage ...........................................................................................................9 2.1.2 Warpage ...........................................................................................................10 2.1.3 Solution to reduce warpage and shrinkage ........................................................11 2.2 Investigation previous research about warpage and shrinkage ..................................11 2.3 The structure of the thesis .......................................................................................16 Chapter 3. Research Methodology .............................................................................18. 3.1 Material for simulation.............................................................................................18 3.2 Finite Element Method.............................................................................................19 3.2.1 Introduction Finite Element Method ................................................................19 3.2.2 Design 3D model for simulation process...........................................................20 3.2.2.1 Mold for dental floss box ...........................................................................20 3.2.2.2 Runner system ...........................................................................................23 3.2.2.3 Cooling system ..........................................................................................26 3.2.2.4 Meshing.....................................................................................................27. iv.
(7) 3.3 Taguchi method .......................................................................................................31 3.3.1 Introduction......................................................................................................31 3.3.2 Methods involve in Taguchi process.................................................................33 3.3.3 Determining parameter Design Orthogonal Array.............................................34 Chapter 4. Analysis Result..........................................................................................37. 4.1 Influence of hot runner system design to quality of product.....................................37 4.2 Influence parameters process to warpage and shrinkage ...........................................39 4.2.1 Influence of melt temperature to warpage and shrinkage...................................39 4.2.2 Influence of packing time to warpage and shrinkage.........................................44 4.2.3 Influence of packing pressure to warpage and shrinkage...................................45 4.3 Influence of process parameters to deformation of the product ................................46 4.3.1 Building model for testing process....................................................................46 4.3.2 Analysis result ..................................................................................................48 4.3.2.1 Measurement D1, D2, D3 dimension.......................................................49 4.3.2.2 The results of displacement of curve profiles on the product....................51 Chapter 5. Optimization Minimum Warpage and Shrinkage...................................56. 5.1 Analysis and computing mean S/N ratio (dB)..........................................................56 5.2 The result of the dental floss box when using the optimum set of parameters ...........59 Chapter 6. Conclusion and Future Works .................................................................63. 6.1 Conclusion...............................................................................................................63 6.2 Future works............................................................................................................64 Reference........................................................................................................................65. v.
(8) Table List Table 3. 1 Summary of polycarbonate (PC) properties [19] .............................................18 Table 3. 2 Dimension of the plates of the dental floss box mold ......................................23 Table 3. 3 Relation between the plastic mass of product and runner dimension [21].........25 Table 3. 4 Summary of mesh properties ..........................................................................30 Table 3. 5 The process parameters and levels using plan testing .......................................35 Table 3. 6 The experimental layout using an L9 (33) Orthogonal Array of Taguchi ...........36 Table 3. 7 Nine- simulations with detail value of Orthogonal Array L9 .............................36 Table 4. 1 Simulation results of the two cases design of hot runner system.......................38 Table 4. 2 Influence results of melt temperature to warpage and shrinkage.......................40 Table 4. 3 Summary of warpage-shrinkage value at different temperature level................43 Table 4. 4 Summary of warpage-shrinkage value using different packing time level .......45 Table 4. 5 Summary of warpage-shrinkage value using different packing pressure level...45 Table 4. 6 Zi value of the each experiment .......................................................................50 Table 4. 7 Summary of D1, D2, D3, D , DTC, and value of each experiment .................50 Table 4. 8 The total displacement value of the curve profiles of the product .....................51 Table 5.1 Warpage and shrinkage value of nine experiments............................................57 Table 5.2 S/N ratio value of nine experiments .................................................................57 Table 5. 3 Mean S/N ratio value.......................................................................................58 Table 5. 4 The error percent of the product length ............................................................61. vi.
(9) Figure List Fig.1. 1 Three main kinds of materials use in the injection molding industry.....................2 Fig.1. 2 Some main components of the injection machine [2].............................................3 Fig.1. 3 Main systems in the mold......................................................................................3 Fig.1. 4 Three basic steps of the injection molding process [2]. ..........................................4 Fig.1. 5 Distribution time of five stages in the injection process cycle [2]...........................5 Fig.1. 6 Component of dental floss box product .................................................................8 Fig.1. 7 3D CAD model of the dental floss box using SolidWorks software drawing..........8 Fig.2. 1 The structure of thesis .........................................................................................17 Fig.3. 1 The characters of PC [19]....................................................................................19 Fig.3. 2 Dimension of the dental floss box .......................................................................21 Fig.3. 3 Cavity plate and core plate dimension .................................................................22 Fig.3. 4 Main plates of the dental floss box mold ............................................................22 Fig.3. 5 Dental floss box and mold base in the Moldex3D Design ....................................23 Fig.3. 6 Two cases of design hot runner for dental floss box mold (unit: mm) .................26 Fig.3. 7 Model of two cases hot runner prepare to simulation process.............................26 Fig.3. 8 Cooling system of cavity plate (dimension unit: mm) .........................................27 Fig.3. 9 All system of the dental floss box mold ..............................................................27 Fig.3. 10 The comparison difference among meshing methods [19] ................................29 Fig.3. 11 The product is meshed by Moldex3D 2012........................................................30 Fig.4. 1 Relation between melt temperature and warpage-shrinkage value........................44 Fig.4. 2 Relation between packing time and warpage- shrinkage value.............................45 Fig.4. 3 Relation between packing pressure and warpage-shrinkage value........................46 Fig.4. 4 Several positions of the product in testing process..............................................47 Fig.4. 5 Model for testing process of the product.............................................................48 Fig.4. 6 Data of measure nodes in the injection molding process ......................................49 Fig.5. 1 Warpage and shrinkage value of the experiment 1...............................................57 Fig.5. 2 Plot of process parameters effects to warpage......................................................59. vii.
(10) Fig.5. 3 Plot of process parameters effect to shrinkage .....................................................59 Fig.5. 4 The smallest warpage value is 0.199mm..............................................................60 Fig.5. 5 The smallest shrinkage value is 1.695% ..............................................................60 Fig.5. 6 The result of total displacement of the tested curve profiles.................................61 Fig.5. 7 Weld line of the product at the optimum set of parameters .................................62. viii.
(11) List of Symbols E. Plastic modulus, dyne/cm2. kN. Kilo newtons (103 newston). MPa. Megapascal. mm. Millimetre. Pj. Injection pressure, MPa. Pk. Packing pressure, MPa. S/N (dB). Signal to noise (disambiguation). s. Seconds. Tm. Melt temperature, oC. Tmd. Mold temperature, oC. Tnd. Water temperature, oC. tc. Cooling time,s. tp. Packing time, s. X, Y, Z. The direction. yi. Warpage and shrinkage of experiment i, mm, %. o. Celsius degree. . Poison ratio. C. ix.
(12) Chapter 1 Introduction 1.1 General background 1.1.1 General introduction of plastic injection molding The plastic injection molding is an important part of all industries that provide products served our life to improve the life quality. The plastic injection molding industry was discovered by Jöns Jacob Berzelius in 1846. The industry expanded rapidly in the 1940 because World War II created huge demand inexpensive, mass produced products. In 1946 American inventor James Watson Hendry built the first screw injection machine, which allowed much more precise control over the speed of injection and quality of products. This machine also allowed material to be mixed before injection. Today, the screw injection machine was improved more modern and more suitable for producing complex products. This greatly improved design flexibility as well as strength and finish of manufactured parts while reducing production time, cost, weight and waste [1]. Injection molding industry makes creating many things such as wire spool, packaging, bottle cap, automotive dashboards, pocket combs and most other plastic products available today. Injection molding is the most common method for manufactured products. It is the way of producing high volume of the same object. Several advantages of injection molding field are high production rates, repeatable, high tolerances, to create smaller products, complex products, apply for a wide range of material, reduce labor cost, minimize scrap losses, and use short cycle time to make one. 1.
(13) plastic product. Some disadvantages of injection molding field are an expensive equipment investment, must to design the mold base part, high operation cost. The polymer is important material in the injection molding industry. Commonly, the polymer using for the injection molding industry was divided three main kinds material, including thermoplastics, thermosets, and elastomers. The Fig.1.1 shows three main kinds of material used in the injection molding industry. Polymer. Thermoplastic. Thermosets. Elastomers. Fig.1. 1 Three main kinds of materials use in the injection molding industry Injection molding machines and mold are the important equipments in the injection molding industry. This machine is designed for changing the state of plastic from solid to liquid. It is to put plastic into molds to create products shape, so the injection molding machine is specially designed suitable for injection process molding. Some main parts of injection molding machine are material hopper, an injection ram or screw-type plunger, heating units, control panel, camping force system. The Fig 1.2 shows some main components of injection machine.. 2.
(14) Fig.1. 2 Some main components of the injection machine [2] Mold and die are directly part to make product shape, so it is designed complexity and precisely manufactured to get high quality product. The structure mold includes mold base, inject system, cooling system, runner system, some complex products need additional heating system, air system in the structure mold for suitable for the quality of product. The Fig.1.3 presents some main systems in the mold. Most of the mold is constructed from hardened steel, pre-hardness steel, aluminum, and beryllium-copper alloy material. Therefore, choosing material to build mold suitable for each product characteristic is very difficult for designers, it is not only good for products but also reducing manufacturing cost. Moreover, manufacturing of mold is often difficult and spent many time in design mold, the mold can be manufactured by CNC machine or by using an electrical discharge machining process.. Fig.1. 3 Main systems in the mold. 3.
(15) Injection process includes three main steps: The step 1, plastic material is fed from the hopper of an injection machine move to heated barrel. The step 2, plastic material is slowly moved forward by a screw-type plunger and the plastic is forced into a heated chamber, which is melted. In the final step, the melt plastic is forced through a nozzle that it connects between injection molding machine and mold. Runner system and gate, which allows melt plastic to flow enters the mold cavity to make product share. The Fig.1.4 shows three basic steps of the injection molding process.. Fig.1. 4 Three basic steps of the injection molding process [2]. Every injection process cycle has five stages. They are closing mold, filling, packing, cooling, and opening mold & ejecting part. The Fig.1.5 shows distribution time of packing and cooling stages are longest. Therefore, packing and cooling stages important influence to product quality.. 4.
(16) Fig.1. 5 Distribution time of five stages in the injection process cycle [2] 1.1.2 The general introduction process of producing in the plastic mold company For each manufacturing plastic mold company to make completion of a mold, that it is tight cooperation between all departments in the company. However, there are only several departments directly manufacture molds involved Research and development department, Design mold department, Technology injection molding department, Quality Assurance department, Mechanical machining department. Tasks of departments are described as follows: Research and development department: Tasks of the department such as research, development, and creating new products. Improvement old products to be more suitable for the requirements. Making and management 2D&3D CAD drawings of products, and send these drawings to the Design mold department to create molds of product. Cooperation with other departments to receive mold orders. Design mold department: Design mold for products. Management, maintenance, and repairmen mold. Cooperation with other departments to improve the quality of product.. 5.
(17) Technology injection molding department: Management plastic material for the injection molding processing. Creating sets of the best parameters for injection molding process to make products. Cooperation with the Design mold department to find out good method design structure mold. For example, change the design of a cooling system, runner system to get product with high quality. Mechanical machining mold department: This department directly creates mechanical machining processing and manage quality and progress of this process. Directly maintenance, repairmen mold. The department has a close relationship with the Design mold department. Quality Assurance department : Based on inspection standards to check the defect of products such as weight, color, dimensions, assemble, etc. If products are substandard, the department sends test results to design department to repair mold. The department manages export and import products. 1.2 Objective of the study The objective of this study is to optimize parameters in injection molding process that has greatly influence to the quality of the dental floss box. In this research, Taguchi method is combined with Finite Element Method (FEM) simulation using Moldex3D software to find out an optimal set of parameter in injection molding process to reduce the defects of product and increasing quality of product. Moreover, the above method can be used in the real injection molding process to reduce manufacturing cost, product cost, and save material. The reason is that, if using the conventional injection molding process, it is needs to spend much money for so. 6.
(18) many times of trial injections in the fact. These trial injections are replaced by simulation on the computer due to develop technology. The results of simulation process carry out the defects of the product, that must be reduced before applied to production. Furthermore, based on the simulation results, the initial of design condition are predicted to give a good methodical design for product with high quality. The object of the research on the influence of process parameters in the injection molding process is the dental floss box product. Dental floss box is a plastic product using in daily life to contain dental floss. So the requirements of product are non-toxic substances for human health, and quality of the product should be ensured: product shape is beautiful models, weld line and air trap are reduced minimum, minimize warpage and shrinkage to ensure the quality opening/closing of product. Based on, these requirements of the dental floss box above, the study present process from design product to optimization minimum warpage and shrinkage of product using Finite Element Method to get high quality dental floss box. The Fig.1.6 shows the components of dental floss box product include dental floss box, roll dental floss part, dental floss, and cutting floss part. Only dental floss box part is studied in the thesis, other components are not mentioning. The Fig.1.7 presents 3D CAD model of the dental floss box using SolidWorks software drawing.. 7.
(19) Fig.1. 6 Component of dental floss box product. Fig.1. 7 3D CAD model of the dental floss box using SolidWorks software drawing. 8.
(20) Chapter 2 Literature Review The chapter 2 presents three main parts: The first part presents the influence of warpage and shrinkage to quality of product in the injection molding process. The second part is investigation prior research warpage and shrinkage in the plastic injection molding process. The final part shows the structure of the thesis. 2.1 The influence of warpage and shrinkage to quality of product In an injection molding process, the plastic material is heated to melt plastic completely, and melt plastic is injected into a cavity of a mold to create products shape. Therefore, research on the injection molding process is an investigation about the behaviors of melted plastic run into a mold such as heat change, pressure change, velocity distribution, density distribution, and solidification process, and so on.c The results of influence to the quality of product in the injection molding process are appeared on defects of product such as warpage, shrinkage, weld lines, short short, burn marks, etc. Among them, Warpage and shrinkage problem are major effect to quality of product. It is researched by many articles to get minimum warpage and shrinkage in the injection molding process to increase quality of product [3]. 2.1.1 Shrinkage Shrinkage is reduction process of volumetric of product, that are calculated volumetric percent of product after the product is cooled down from high temperature, high pressure condition to room temperature, ambient pressure condition. If the. 9.
(21) shrinkage is uniform distribution on all product shapes, the product is deform and change a little of its shape. There are many reasons affect shrinkage value in the injection process. Plastic material and pressure are a main reason affect to it. Each plastic material has difference volumetric shrinkage. To reducing shrinkage value, the first reason understand volumetric shrinkage of each plastic material to choose plastic suitable for each product. If products are injected without pressure then products have about 25% volumetric shrinkage, even product is faulty. Therefore, the application of high pressure can reduce this volumetric shrinkage in injection molding. However, increasing of pressure need to be limited suitable pressure, which is enough to create the minimum shrinkage [4]. 2.1.2 Warpage Warpage results when shrinkage is not uniform, that is calculated displacement dimension of product. If regions of the product shrink unequally, stresses are created within the product which, depending on part stiffness, may cause the product to deform or change shape. In the long term product can even crack. There are main causes make warpage included orientation effects, area shrinkage effects, and differential cooling effects. Orientation effects arise from the difference between parallel and perpendicular shrinkages. These shrinkage differences tend to be useful on a local basis, that is, within some region of the part. The difference in shrinkage can be due to molecular or fiber orientation. For comparing shrinkages from region to region in the part, area shrinkage is a useful concept. Area shrinkage, also called differential shrinkage, is defined to be the change in a area that occurs due to. 10.
(22) parallel and perpendicular shrinkage. Warpage can also be caused by variation in cooling. The most common example is from the difference in temperature on opposing mold faces [5]. 2.1.3 Solutions to reduce warpage and shrinkage There are two ways to reduce warpage and shrinkage value in the injection molding process. The first way, product and mold are suitably designed for reducing warpage and shrinkage value. For example, part and mold designers can improve the dimensional stability of a product by considering: material selection, wall thickness variation, gate position and runner dimensions, molding conditions, cooling line layout. The second way, process parameters are changed with suitable values to get minimum warpage and shrinkage. They process parameters are melt temperature, injection pressure, packing pressure, filling time, packing time, cooling time, mold temperature, coolant condition [3].. 2.2 Investigation previous research about warpage and shrinkage Because warpage and shrinkage are two major reasons affect to larger quality of product, many papers had been researched itself. The following is several articles research about warpage and shrinkage: Mirigul A., [6] researched reducing shrinkage in injection moldings via the Taguchi, ANOVA and neural network methods. The study had designed rectangular specimen (length x width x thickness: 110 x 10 x 3,2mm) for experimental and used two kinds of material which are polypropylene (PP), and polystyrene (PS). These materials. 11.
(23) were injected mold cavity of specimen under various parameters process change included: melt temperature, injection pressure, packing pressure, packing time. According to the analysis results, the research found out the optimal set of parameters, which make minimum shrinkage of specimen. The optimal set of parameters are melt temperature at 260oC, injection pressure at 60MPa, packing pressure at 50MPa, packing time at 15s, which gave minimum shrinkage of 0.937% for PP and 1.224% for PS. Statically, the most significant parameters were found to be as packing pressure and melt temperature for the PP and PS moldings, respectively. Injection pressure had the least effect on the shrinkage of either material. Daniele A et al. [7] had studied a methodology for shrinkage measurement in micro-injection molding. Tuncay E., and Babur O., [8] presented minimization of warpage and sink index in injection-mold thermoplastic parts using the Taguchi optimization method. The objective of this study consist of minimization of the warpage and sink index in terms of. process parameters of the plastic parts have different rib cross-section types, and rib. layout angle using the Taguchi optimization method. Based on, considering the process parameters such as mold temperature, melt temperature, packing pressure, in addition to rib cross-section types, and rib layout angle, a series of mold analyses are performed to exploite the warpage and sink index data. The polymeric materials were selected. 12.
(24) PC/ABS, POM, and PA66. Taguchi optimization method was used by exploiting mold analyses based on three level factorial design. Orthogonal Arrays of Taguchi, the signalto-noise (S/N) ratio, the analysis of variance (ANOVA) are utilized to found the optimal. levels and the effect of process parameters on warpage and sink index. Confirmation. analysis test with the optimal levels of process parameters are carried out in order to demonstrate the goodness of Taguchi method. From this, it can be concluded that Taguchi method is very suitable to solve the quality problem occurring the injectionmolded thermoplastic parts. Subramanian N.R., et al. [9] using the same method presented optimizing warpage analysis for an optical housing. Babur O., and Ibrahim S., [10] had studied warpage and structure analysis of thin shell plastic in the plastic injection molding. Hasan O., Tuncay E., [11] researched application of Taguchi optimization technique in determining plastic injection molding process parameters for a thin-shell part. The results show that warpage and shrinkage are improved by about 2.17% and. 0.7%. A verification test is also performed to prove the effectiveness of Taguchi. 13.
(25) technique after the optimum levels of process parameters are determined. It can be. clearly inferred from this conclusion that Taguchi optimization is sufficient to solve the. warpage problem with shrinkage for thin-shell plastic components of orthose part. Eghbal H., and Abu B.S., [12] using the same method shown analysis of warpage and shrinkage properties of injection-molded micro gears polymer composites using numerical simulation assisted by the Taguchi method. Azaman M.D., [13] with partners have been researched shrinkages and warpage in the processability of wood-filled polypropylene composite thin-walled parts formed by injection molding. In this study, the injection molding of shallow, thin-walled parts (thickness 0.7 mm), composed of lignocellulosic polymer composites (polypropylene (PP) + 50 wt% wood), was simulated. The volumetric shrinkages and warpage in the thin-walled parts were evaluated under different process conditions, with varying postfilling parameters, such as mold temperature, cooling time, packing pressure and packing time. The analysis showed that the cooling time and packing time had less of an effect on the shrinkage and warpage; nevertheless the optimal levels for both parameters are required in the molding process for the thin-walled part to achieve the best results. The volumetric shrinkage was lower near the gate than at the end-of-fill location along the flow path. The results also showed that the volumetric shrinkage correlates with the. 14.
(26) warpage measured on the molded part. The optimum parameters ranges is 40–45oC for the mold temperature, 20–30s for cooling time, 0.85 from injection pressure (Pinject) for packing pressure, and 15–20s for the packing time to achieve the best results with the least amount of volumetric shrinkage and warpage. In addition, Sánchez R., Aisa J., and Martinez A., [14] researched about the relationship between cooling setup and warpage in injection molding. In this study some measurement results are shown, focused on cooling parameters effect on warpage, using non-contact techniques on several part areas. Results allow visualize warpage changes when melt temperature, cooling time or cooling conditions vary.. Babur O., [15]. researched optimization of injection parameters for mechanical properties of specimen with weld line of polypropylene using Taguchi method. Mustafa K., et al. [16] presented influence of cavity pressure and mold temperature on the quality of the final products. In this research, cavity pressure and mold surface temperature have been measured and recorded by pressure and temperature–pressure sensors using a Kistler CoMo 2869A injection-type apparatus. The influences of the measured factors on the quality of the final parts have been investigated experimentally. The results of this experimental study indicate that cavity pressure and mold temperature are the dominant factors determining the quality of the final product in plastic injection molding. Kuo M.T., et al. [17] researched a study of the effects of process parameters for injection molding on surface quality of optical lenses, and the same method, Hamdy H., [18] researched modeling the effect of cooling system on the shrinkage and temperature of the polymer by injection molding.. 15.
(27) 2.3 Structure of the thesis The thesis has six chapters included introduction, literature review, research methodology, analysis result, optimization minimum warpage and shrinkage, and conclusion. Chapter 1 introduces general background of the injection molding process, and objective of the thesis. Then, chapter 2 presents the influence of warpage and shrinkage to quality of product, investigation prior research about warpage and shrinkage in the injection molding process, and structure of the thesis. The next chapter shows research methodology includcing material for simulation, FEM method, and Taguchi method. The chapter 4 shows influence results of hot runner system to quality of the product, process parameters to warpage and shrinkage, process parameters to deformation of the product dimension. Analysis and computing mean S/N, and results of dental floss box quality using the optimal set of parameters are shown in the chapter 5. Finally, conclusion and future works are presented in chapter 6. The Fig.2.1 shows the structure of the thesis.. Chapter 1 Introduction. Chapter 2 Literature Reviews. 1.1General introduction of molding plastic process 1.2Objective of the thesis. 2.1 The influence of warpage and shrinkage to quality of product 2.2 Investigation prior research about warpage and shrinkage 2.3 Structure of the thesis 16. Chapter 3 Research. injection. 3.1 Material for simulation 3.2 Finite Element Method 3.3 Taguchi method.
(28) Fig.2. 1 The structure of thesis. 17.
(29) Chapter 3 Research Methodology This chapter clearly describes the research methodology used in this study including material for simulation, Finite Element Method (FEM), and Taguchi method. The purpose of the chapter is to build 3D model for simulation process and presents Taguchi method to apply in the thesis. 3.1 Material for simulation Polymer material is selected to make the dental floss box, that base on characteristic requirements of its (as presented in section 1.2 goal and objective of the thesis). Because the dental floss box is a kind of product serve to human daily life, so polymer using for product have to no chemical affect human health, and dental floss box requirement can be many times opening/closing. Polycarbonate (PC) polymer has small toxic, elasticity, and PC usually uses to create products served to human in daily life. Therefore, polycarbonate polymer (PC) is chosen to create the dental floss box, that is suitable for requirement of product in simulation injection molding procecss. Table 3. 1 Summary of polycarbonate (PC) properties [19] 1. Elastic modulus (E). 2e+10 (dyne/cm3). 5. 2. Poison ratio ( ). -0.38. 6. 3. Freeze temperature. 153 (oC). 7. 4. Density. 1.2 (g/cm3). 8. Viscosity Melt temperature range Mold temperature range Ejected temperature range. 88-1500 (g/cm.s) 280 - 330 (oC) 60 - 120 (oC) 133-153 (oC). The Table 3.1 shows properties of polycarbonate. For example, elastic modulus (E) is 2e+10 dyne/cm3, poison ratio ( ) is (-) 0.38. The parameters value range is proposed in. 18.
(30) manufacturing injection molding of the PC such as melt temperature range of 280 330oC, mold temperature range of 60 - 120oC, injected temperature range of 133-153oC, freezer temperature of 153oC. The Fig.3.1 shows the characters of the PC, which based on them to choose suitable parameters for injection molding process. The Fig.3.1 (a) shows relationship between viscosity and shear rate at three level temperature (280oC, 305oC, 330oC), and the Fig.3.1 (b) shows relationship between specific volume and temperature range from 10 oCto 300oC.. (a). (b) Fig.3. 1 The characters of PC [19]. 3.2 Finite Element Method 3.2.1 Introduction Finite Element Method The Finite Element. Method (FEM) is a numerical technique for. finding. approximate solutions to boundary value problems using differential equations. It uses variational methods (the calculus of variations) to minimize an error function and produce a stable solution. Analogous to the idea that connecting many tiny straight lines can approximate a larger circle, FEM encompasses all the methods for connecting many. 19.
(31) simple element equations over many small subdomains, named Finite Elements, to approximate a more complex equation over a larger domain [20]. Modex3D R.12 software is a kind of FEM to analyze defects of products using in the injection molding process field. The software provides a complete solution to help users simulate find out suitable for design mold and process parameters before application to real production environment. Covering a wide spectrum of injection molding processes, Modex3D R.12 help part designers, mold designers, and mold makers detect potential molding problems in advance at early stage of product design process such as weld lines, air traps, short shots, sink mark, burning, warpage, shrinkage, etc. With Moldex3D R.12, design revisions and optimizations can be make much more quickly and more easily. Addition, the software also allows an accurate analysis of quality of polymer flow into complicated mold shapes to reduce defects, create quality of product. Therefore, Moldex3D R.12 is selected to analyse quality of product and specially uses to optimize minimum warpage and shrinkage of dental floss box in this study. 3.2.2 Design 3D model for simulation process Moldex3D software has two modules include Moldex3D Design and Mold3D eDesign. Moldex3D Design project is used to prepare for simulation process such as mold base, runner system, cooling system, meshing, etc. After completing design conditions in Moldex3D Design, process parameters (temperature, pressure, time) are set up to run analysis in Moldex3D eDesign, 3.2.2.1 Mold for dental floss box. 20.
(32) Dental floss box is a small plastic product. The length, width, high of dental floss box dimensions are 105.5mm, 42mm, 35.5mm, respectively, and mass of the dental floss box is 9.549g. The Fig.3.2 shows 2D CAD of the dental floss box. Based on mass and dimension of the dental floss box above, mold dimensions are selected with length of 450mm and width of 350mm suitable for four cavities in the mold (The standards design amount of cavity in the mold depend on dimension of product and amount of product demand production).. The Fig.3.3 shows the cavity plate and core plate. dimension. The Fig.3.3 (a) shows the cavity plate dimension, and Fig.3.3 (b) shows the core plate dimension. Cavity plate and core plate are similar dimension, and value of length, width, high they are 450mm, 350mm, 60mm, respectively.. open mold. B. A. D. C. D. Section: A-A (4:1). C. B. A. Section: B-B (4:1). Requirements of the product: Section: D-D (6:1). Section: C-C (6:1). 1) Dafts not specified shall be 1°30" 2) Material : PC 3) Mass: 9.549(g). Fig.3. 2 Dimension of the dental floss box. 21.
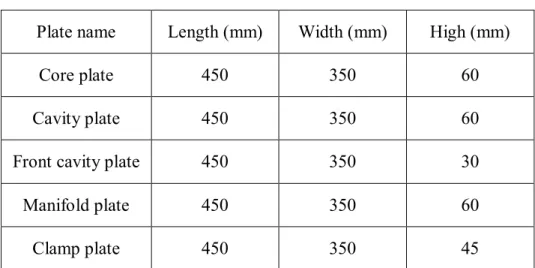
(33) (a). (b). Fig.3. 3 The cavity plate and core plate dimension The Fig.3.4 presents some main plates of the dental floss box mold which are prepared to simulate by moldex3D eDesign. These plates are clamp plate, manifold plate, front cavity plate, and core plate. The dimension of each plate is clearly shown in Table 3.2.. Fig.3. 4 Main plates of the dental floss box mold. 22.
(34) Table 3. 2 The dimension of the plates of the dental floss box mold Plate name. Length (mm). Width (mm). High (mm). Core plate. 450. 350. 60. Cavity plate. 450. 350. 60. Front cavity plate. 450. 350. 30. Manifold plate. 450. 350. 60. Clamp plate. 450. 350. 45. After the dental floss box and the dental floss box mold are completely designed by SolidWorks software, they are installed in Modex3D Design as shown in Fig.3.5. A fixed haft of mold involves clamp force plate, manifold plate, and front cavity plate. So total dimensions of the fixed half of mold is 195mm. A moved half of mold is the core plate dimension whose dimension is 60mm.. Fig.3. 5 Dental floss box and mold base in the Moldex3D Design 3.2.2.2 Runner system. 23.
(35) Normally, there are two main kinds of runner system to use in mold design, they are cold runner system and hot runner system. Cold runner system is usually used in a conventional mold to make normal products, that products are not necessarily high quality. Cooling system is easily design, manufacturing, and low manufacturing mold cost. Oppositely, hot runner system is complexity designed for high quality products, special products, and large products size. Several advantages using hot runner system ensure stability of uniform temperature of melted plastic flow from nozzle of injection machine to mold cavity, make cycle time faster, do not use robot to remove runner, save plastic material. Some disadvantages are high investment for equipments, difficult to change of color plastic material, hard design structure mold, and hot runner system can make cavity plate crack. Normally, hot runner system includes four main parts such as controller, piton-cylinder, manifold, and nozzle. The controller is used to control temperature of plastic to ensure temperature requirement in injection molding process. Piton-cylinder controls to open or close nozzle for melted plastic flowing mold cavity. Manifold provides melted plastic for each gate. The nozzle is directly provides melted plastic into cavity to make product shape. The following are standards of design runner system which is applied to design the hot runner system for dental floss box mold [21]. 1.Runner must be designed to be the shortest path from the nozzle of injection machine to the cavity part. 2. Runner should be designed symmetrically when mold has multiple cavities. 3. Runner dimension is chosen based on the plastic mass of products as shown in Table 3.3. The plastic mass of dental floss box product is 9.549g as presented in Fig. 3.1.. 24.
(36) Therefore, type valve and runner diameter of 4mm are secleted for hot runner system of dental floss box mold. Table 3. 3 Relation between the plastic mass of product and runner dimension [21] Runner dimension (mm). Type of runner diameter. Plastic mass of product (g). Small. Type Tip/ Sprue. Type valve. <85.05 g. From 3.5 to 4. From 4 to 6. Medium. 85.05 340.19 g. From 5 to 6. From 7 to 8. Big. >340.19. From 8 to12. From 9 to15. Large. Lager shape. > 12. > 15. Therefore, two cases of hot runner system are designed for injection molding process. Hot runner system of case (a) is used two gates to inject one cavity, but the hot runner system of case (b) is used one gate to inject one cavity as illustrate in Fig.3.6. Dimensions of the two cases of hot runner are uniform. For example, the diameter of each gate is 0.7mm, length of the nozzle is 195mm, and diameter of the nozzle is 4 mm. The Fig.3.8 shows hot runner system, which is installed in Moldex3D Design to prepare for simulation process. In the chapter 4, section 4.1 analyze influence result of each hot runner system to quality of product. Based on that results, the optimal method of design hot runner is found out to obtain hight product quality.. 25.
(37) Fig.3. 6 Two cases of design hot runner for dental floss box mold (unit: mm). Fig.3. 7 Model of two case hot runners prepare to simulation process 3.2.2.3 Cooling system Cooling system is an important part in the structure mold, that purpose is to cool product from high temperature and high pressure to freeze temperature, then products are injected outside by inject system. For the structure dental floss box mold, cooling system is designed with four cooling lines for each plate (cavity plate, and core plate),. 26.
(38) and two inputs, outputs. Diameter of line each cooling is 8mm. The Fig.3.8 shows the cooling system of cavity plate. The core plate has cooling system same to the cavity plate.. Fig.3. 8 Cooling system of cavity plate (dimension unit: mm). Fig.3. 9 All systems the dental floss box mold The Fig.3.9 shows all systems of the dental floss box mold, they are setup by Moldex3D Design to prepare simulation process. These systems include mold base, hot runner system, cooling system, input and output coolant, connection part of the cooling system. 3.2.2.4 Meshing. 27.
(39) Moldex3D software is provided several meshing methods to analyze model such as Auto Tetrahedral method, Hybrid Mesh method, and Boundary Layer. The following present characters of each meshing method, based on that the suitable method is chosen to mesh product. Auto Tetrahedral meshing method is the simplest method for three-dimensional solid mesh creation. Users can easily create tetrahedral mesh from a closed surface. The disadvantage of this method is that it requires more elements per unit volume to achieve the same mesh quality as other types of solid mesh. The mesh quality described here is defined by the quality tables in Moldex3D Mesh and the element layer count across thickness direction. For Auto Tetrahedral meshing, users do not have full control of the element layer count of parts. Thus, sometimes the CAE analysis cannot provide correct temperature distribution in poor quality regions. On the other hand, the Hybrid meshing is very different from the tetrahedral meshing. People can easily control the mesh quality to meet the solver’s requirement. The disadvantage of this method is that inexperienced users have to spend more time constructing the mesh. The constructing time of hybrid mesh is three times or more than that of the auto tetrahedral mesh. For most users, it is a big drawback despite the possibility of achieving higher mesh quality. Moldex3D Mesh provides the Boundary Layer Mesh (BLM) method. For BLM, users do not have to spend much time in solid mesh generation. In addition, the quality of solid mesh provided by BLM is good enough for analysis to obtain accurate results. Generally, it provides at least five-element layer count across thickness direction for the. 28.
(40) entire part. In that way, the increase in temperature caused by shear heating phenomena at the cavity boundary can be simulated more accurately. Furthermore, the analysis results of the filling pattern, pressure profile, and so on, can be predicted more accurately as well [19]. The Fig.3.11 shows the comparison among different meshing methods in the Modex3D software. For the dental floss box product to ensure good quality mesh for analysis to obtain accurate results, Boundary Layer Mesh method with level 3 is chosen for analysis simulation. The Fig.3.12, Table 3.6 show product be meshed by Moldex3D 2012 software, and mesh summary, respectively.. Fig.3. 10 The comparison difference among meshing methods [19]. 29.
(41) Fig.3.11 The product is meshed by Moldex3D 2012 Table 3.4 Summary of mesh properties Mesh Type. Boundary Layer Mesh (BLM). Level mesh. 3. Cavity(Part) volume. 31.5324 (cc). Hot runner volume. 17.3585 (cc). Element number. 985542. Part elements. 985542. Node number. 748117. In addition, the injection machine is chosen in the catalogue of Moldex3D software to simulation analysis, when mold base, runner system, cooling system, and mesh all of systems are completed design. The main parameters of injection machine to simulation process are clamping force at 490kN, injection pressure maximum at 240MPa, injection rate maximum at 128cm3/sec.. 30.
(42) 3.3 Taguchi method 3.3.1 Introduction The Taguchi method developed by Taguchi consists of three stages which are system, parameters, and tolerance designs, respectively. The system design phase is the determining the suitable working levels of design factors. It includes designing and testing a system based on the engineer’s judgment of selected materials, and nominal product process parameters. The parameter design is used to optimize the setting of the process parameter values for improving performance characteristics and to identify the product parameter values under the optimal process parameter values. Moreover, it is expected that the process parameter values obtained from the parameter design are insensitive to the variation of environmental condition and other noise factors. Therefore, the parameter design and the system design are the key in the Taguchi method to achieving high quality without increasing cost. The tolerance design is used for determining and analysis of the tolerances in optimal settings recommended by the parameter design [22]. The Taguchi method involves reducing the variation in a process through robust design of experiments. The overall objective of the method is to produce high quality product at low cost to the manufacturer. Taguchi developed a method for designing experiments to investigate how different parameters affect the mean and variance of a process performance characteristic that defines how well the process is functioning. The experimental design proposed by Taguchi involves using orthogonal arrays to organize the parameters affecting the process and the levels at which they should be varies.. 31.
(43) Instead of having to test all possible combinations like the factorial design, the Taguchi method tests pairs of combinations. This allows for the collection of the necessary data to determine which factors most affect product quality with a minimum amount of experimentation, thus saving time and resources. The Taguchi method is best used when there are an intermediate number of variables (3 to 50), few interactions between variables, and when only a few variables contribute significantly [22]. Taguchi function has three kinds of functions including the smaller is the best, the nominal is the best, and the large is the better. Depending on the requirement of each issue, each function is chosen to appropriate: 1. The smaller is the best For the case of minimizing the performance characteristic, the following definition of the S/N ratio should be calculated: n 1 S/N = 10 log yi2 n i 1. (3.1). 2. The nominal is the best For the case of nominal the performance characteristic, the following definition of the S/N ratio should be calculated: n 1 S/N = 10 log ( yi m)2 n i 1. (3.2). 3. The larger is the best For the case of maximizing the performance characteristic, the following definition of the S/N ratio should be calculated:. 32.
(44) n 1 1 S/N = 10 log 2 n i 1 yi. (3.3). Where: i: trial number n: number of trials for experiment i y: output value m: target value of output 3.3.2 Methods involve in Taguchi process In the injection molding process, many factors influence to quality of production such as temperature, pressure, time. The result of influences are shown on defects of product such as air trap, weld lines, short shorts, warpage, shrinkage, etc. However, warpage and shrinkage are important defect, which influence to deformation of product, assembling together, incorrect size. Therefore, warpage and shrinkage are reduced to increase quality of product, this section presents the general steps involved in the Taguchi method are as follows for optimal minimum warpage and shrinkage of the dental floss box [23]. 1. Indentify the main objective for optimization: minimum warpage and shrinkage value in the injection molding. 2. Indentify the noise factors, testing conditions, and quality characteristic: melt temperature, injection pressure, packing pressure, packing time, cooling time, mold temperature. 3. Identify the objective function to be optimized: the smaller is the best. 4. The control factors and level: three control factors, that are melt temperature, packing pressure, packing time.. 33.
(45) 5. Selection of the optimal levels of design parameters: three levels 6. Conduct the experiments indicated in the completed array to collect data on the effect on the performance measure. 7. Analysis of the experimental results using the Signal to Noise. 8. Complete data analysis to determine the effect of the different parameters on the performance measure. 3.3.3 Determining parameter Design Orthogonal Array In the injection molding process, there are two main reasons influence to quality of production including design (design part, mold, runner, cooling, plates of mold) and process parameters (temperature, pressure, time). The results of influences are shown on defects of product such as air trap, wield line, short shorts, shrink mark, warpage, shrinkage, etc. However, warpage and shrinkage are important defects which relationship to deformation of product, assembly together, incorrect size. Therefore, warpage and shrinkage should be reduced to increase quality of product in the injection molding industry. In this study, the design issues are considered good for simulation process, and the process parameters are appropriately varied to find out set of optimal parameters in the injection molding of the dental floss box. There are many parameters effect to characteristic warpage and shrinkage of product such as melt temperature, injection pressure, packing pressure, packing time, cooling time, mold temperature, water temperature, and ect. However, according to research previous and based on trial simulation using moldex3D eDesign demonstrate melt temperature, packing pressure, and packing time which major affect to warpage. 34.
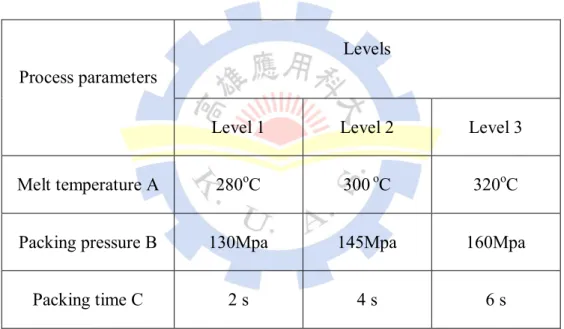
(46) and shrinkage of dental floss box value in the injection molding. Therefore, melt temperature, packing pressure, packing time are chosen for design experiment via Taguchi method to optimal warpage and shrinkage in injection molding dental floss box process. The effects of several process parameters based on the Taguchi's orthogonal design could be determined effectively from matrix experiments. The process parameters and levels are presented Table 3.5. Table 3. 5 The process parameters and levels using plan testing Levels Process parameters Level 1. Level 2. Level 3. Melt temperature A. 280oC. 300 oC. 320oC. Packing pressure B. 130Mpa. 145Mpa. 160Mpa. Packing time C. 2s. 4s. 6s. A planning testimg were organized in using Taguchi's L9 (33) Orthogonal Array based on data in Table 3.5. An experimental plan of three parameters with three levels are organized by the Taguchi method in Table 3.6, and nine-simulations with detail value of Orthogonal Array of Taguchi method shows in Table 3.7. Parameters value of level 2, they are calculated equal average value of these two levels. Other injection. 35.
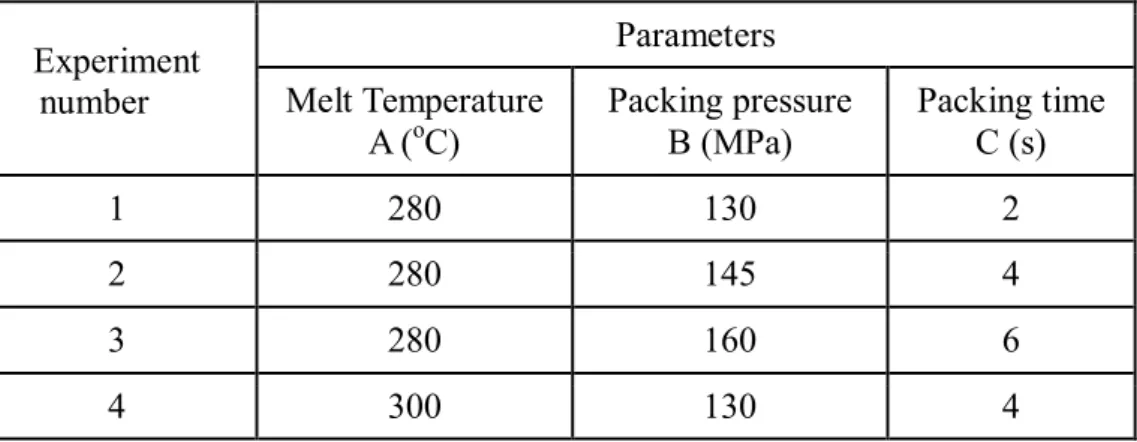
(47) parameters such as injection pressure, mold temperatures, water temperature are constants and their values are 180MPa, 91.5oC, and 25oC, respectively.. Table 3. 6 The experimental layout using an L9 (33) Orthogonal Array of Taguchi Process parameters Experiment number. Melt Temperature A (0C). Packing pressure B (MPa). Packing time C (s). 1. 1. 1. 1. 2. 1. 2. 2. 3. 1. 3. 3. 4. 2. 1. 2. 5. 2. 2. 3. 6. 2. 3. 1. 7. 3. 1. 3. 8. 3. 2. 1. 9. 3. 3. 2. Table 3.7 Nine- simulations with detail value of Orthogonal Array L9 Experiment number. Parameters Melt Temperature A (oC). Packing pressure B (MPa). Packing time C (s). 1. 280. 130. 2. 2. 280. 145. 4. 3. 280. 160. 6. 4. 300. 130. 4. 36.
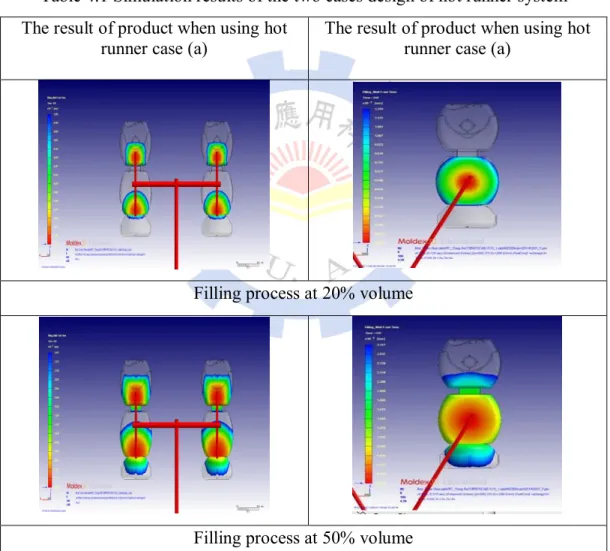
(48) 5. 300. 145. 6. 6. 300. 160. 2. 7. 320. 130. 6. 8. 320. 145. 2. 9. 320. 160. 4. Chapter 4 Analysis Result The chapter 4 presents three main parts. The first part research influence of hot runner system to quality of the product, the second part presents influence of process parameters to warpage and shrinkage of the product, influence of process parameters to dimension deformation of the product is shown in third part. The parameters of simulation process are gotten in the Table 3.7. In addition, serve to the research influence of parameter to warpage and shrinkage, the process parameters range are chosen melt temperature range at 280-320oC, packing pressure range at 100-160MPa, and packing time at 2-6s. The quality of product depends on following parameters: Tm – melt temperature, Pk – packing pressure, Pj – injection pressure, tp – packing time, tc – cooling time, Tmd – mold temperature, Tnc - water temperature. 4.1 Influence of hot runner system design to quality of product According to the chapter 3 presented the two cases design of hot runner system (shown in the Fig.3.6 in the chapter 3), this section analyzes results of influence of the two cases design of hot runner system to quality of product. Based on that result, the best method of design hot runner is chosen for simulation process to get high quality of product and small warpage-shrinkage value.. 37.
(49) The Table 4.1 shows simulation results of the two cases design of hot runner system. The case (a) (two gates inject a cavity) using set of parameters are melt temperature at 280oC, packing pressure at 160MPa, injection pressure at 180MPa. The case (b) (one gate inject a cavity) using set of parameters are melt temperature at 2800C, packing pressure at 180MPa, injection pressure at 200MPa. Other parameters as packing time at 6s, mold temperature at 91.5oC, cooling time at 15s are fixed value. Table 4.1 Simulation results of the two cases design of hot runner system The result of product when using hot runner case (a). The result of product when using hot runner case (a). Filling process at 20% volume. Filling process at 50% volume. 38.
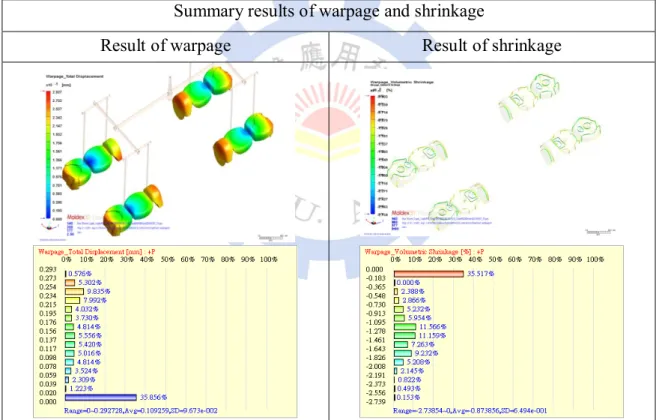
(50) Filling process at 100% volume Although injection pressure and packing pressure value in the case (b) is higher than that in the case (a), the results in the Table 4.1 showed the product of the case (b) incompletely filled when the filling process finish simulation. The short short problem appeared on the product surface. Oppositely, the product of the case (a) is completed filling and the short short problem did not appear on the product surface. Therefore, design hot runner of the case (a) is chosen for simulation process in the optimization of warpage and shrinkage process. Because, If using the hot runner system of case (b) must increase pressure or temperature value, that it is main causes create stress in the mold, abrasion of mold, appear flash on the product, and low mold life. 4.2 Influence parameters process to warpage and shrinkage The section presents influence of melt temperature, packing pressure, packing time to warpage and shrinkage value. The value of each parameter is researched to influence of warpage and shrinkage make changing warpage and shrinkage, that value are varied with each level, other parameter are fixed value in the simulation process. 4.2.1 Influence of melt temperature to warpage and shrinkage. 39.
(51) The melt temperature is a main factor influence to quality of the product such as weld line, burning material, etc. The purpose of this section is research of influence of melt temperature to warpage and shrinkage value of the product, melt temperature value is changed from 280oC to 320oC, other parameters are constant value such injection pressure 180MPa, packing pressure at 160MPa, packing time at 6s, cooling time at 15s, and mold temperature at 91.5oC. The Table 3.4 shows influence results of melt temperature to warpage and shrinkage value. Table 4.2 Influence results of melt temperature to warpage and shrinkage Summary results of warpage and shrinkage Result of warpage. Result of shrinkage. The value of warpage and shrinkage at 280oC of melt temperature. 40.
(52) Value of warpage and shrinkage at 290oC of melt temperature Summary results of warpage and shrinkage Result of warpage. Result of shrinkage. Value of warpage and shrinkage at 300oC of melt temperature. 41.
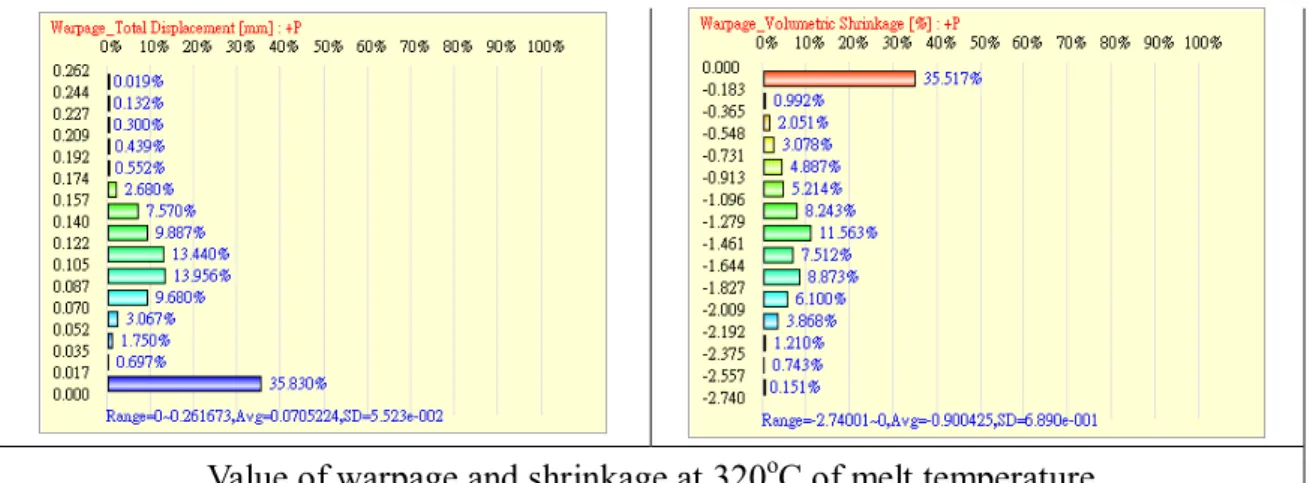
(53) Value of warpage and shrinkage at 310oC of melt temperature Summary results of warpage and shrinkage Result of warpage. Result of shrinkage. 42.
(54) Value of warpage and shrinkage at 320oC of melt temperature The Table 4.3 shows summary of warpage and shrinkage value at different melt temperature. The Fig.4.1 illustrate relation between temperature and warpage-shrinkage value. According to the results, when using low or high melt temperature make warpage and shrinkage value increase. Melt temperature at 280oC creates biggest warpage, its value is 0.293mm. Melt temperature at 320oC creates biggest shrinkage value. Warpage and shrinkge value are smallest when melt temperature at 300oC, that value are 0,199mm and 1.695%, respectively.. Table 4. 3 Summary of warpage-shrinkage value at different temperature levels Factor. Levels of melt temperature. Melt temperature (oC). 280. 290. 300. 310. 320. Warpage value (mm). 0.293. 0.291. 0.199. 0.256. 0.262. Volumetric shrinkage value (%). 2.739. 1.944. 1.695. 2.101. 2.74. 43.
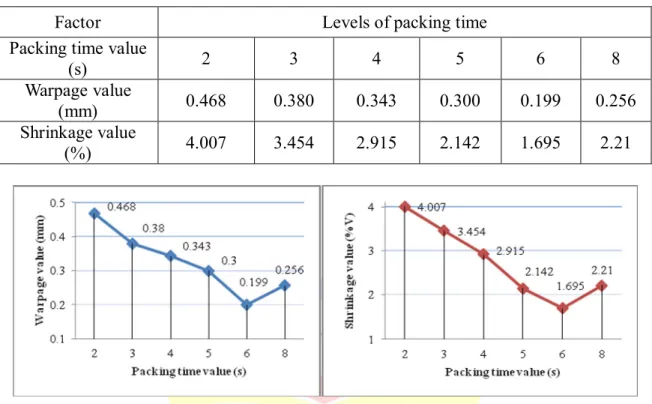
(55) Fig.4. 1 Relation between melt temperature and warpage-shrinkage value 4.2.2 Influence of packing time to warpage and shrinkage Using the same method at section 4.2.1 above, the packing time is changed different level from 2s to 6s, other parameters are constant value such as melt temperature at 300oC, injection pressure 180MPa, packing pressure at 160MPa, cooling time at 15s, and mold temperature at 91.5oC. The collection Warpage and shrinkage result present in the Table 4.4. Based on the results in the Table 4.4, the graph is drawn to present relation between packing time and warpage-shrinkage value as shown in Fig.4.2. Packing time at 2s make biggest warpage and shrinkage value. Packing time at 6s creates smallest warpage and shrinkage value. If packing time continuous increases to 8s then the graph of warpage and shrinkage has upward direction. Therefore, the result also demonstrates when packing time has long enough value in injection molding to get small warpage and shrinkage. In addition, the graph of Fig.4.2 presents the packing time creates 1s for every experiment, that makes warpage and shrinkage value significantly change. Hence , the degree of influence of packing time to warpage and shrinkage is significant in the injection molding process.. 44.
(56) Table 4. 4 Summary of warpage and shrinkage value using different packing time. Factor Packing time value (s) Warpage value (mm) Shrinkage value (%). Levels of packing time 2. 3. 4. 5. 6. 8. 0.468. 0.380. 0.343. 0.300. 0.199. 0.256. 4.007. 3.454. 2.915. 2.142. 1.695. 2.21. Fig.4. 2 Relation between packing time and warpage- shrinkage value 4.2.3 Influence of packing pressure to warpage and shrinkage This section presents influence of packing pressure to warpage and shrinkage of the product. Value of packing pressure is changed from 100MPa to 160MPa with four levels as Table 4.6, other parameters are constant value such as melt temperature at 300oC injection pressure at 180MPa, packing time at 6s, cooling time at 15s, and mold temperature at 91.5oC. Table 4. 5 Summary of warpage-shrinkage value using different packing pressure levels Factor. Levels packing pressure. Packing pressure value (MPa). 100. 130. 145. 160. Warpage value (mm). 0.444. 0.306. 0.256. 0.199. 45.
(57) Shrinkage value (%). 3.016. 2.74. 2.205. 1.695. Fig.4. 3 Relation between packing pressure and warpage-shrinkage value The Table.4.5 shows summary of warpage and shrinkage using different packing pressure levels. Based on the results, the graph is drawn in the Fig.4.3 that presents relation between packing pressure and warpage-shrinkage value. The warpage and shrinkage value has biggest when using packing pressure at 100MPa, their values are 0.444mm and 3.016%, respectively. The packing presure at 160Mpa get smallest warpage and shrinkage, their values are 0.199mm and 1.695%, respectively. 4.3 Influence of process parameters to deformation of the product This section evaluates displacement of the product length, and tests several curve profiles on the product. The section has two parts, the first parts is building model for testing process, and the second part shows results analysis including the displacement of the product length, and displacement of several curve profiles of the product. 4.3.1 Building model for testing process Because the dental floss box include three small parts assembled together, deformation of product dimensions have major influence to assembly process. Hence,. 46.
(58) building model to test displacement of the product dimension and displacement of several curve profiles of the product are important to improve quality of the product. The Fig.4.4 shows some positions of the product tested deformation in the injection molding process. D1, D2, D3 are dimension 1, dimension 2, and dimension 3 of the product length at three positions, and several red lines are curve profiles of the product checked in the injection process.. Fig.4. 4 Several positions of the product in testing process The Fig.4.5 shows model for testing process to check displacement of the product length, and displacement of several curve profiles. There are total 34 measurement nodes established on the product like the Fig.4.5 (a). The nodes have numbers from 1 to 28 using test displacement of several curve profiles on the product. The curve profiles of the product are tested by nodes as follows: node 1 to node 7 used to test left curve of part 1, node 7 to node 14 used to test right curve of part 1, node 15 to node 21 used to. 47.
(59) test left curve of part 2, and node 22 to node 28 used to test right curve of part 2. The nodes have numbers from 29 to 34 used to test the displacement of the product length. The distance of the node 29 and node 32, node 30 and node 33, node 31 and node 34 are D1, D2, D3, respectively. The Fig.4.5 (b) presents measurement nodes that are set up to prepare for the simulation process in the Moldex3D 2012 software.. part 1. 29 30. right. 1. 14. 2 3 4 5 6. 13 12 11 10 9 7. part 2. 31. 31. 32. 8. 22 23 24 25 26. 15 16 17 18 19 20. 107.5. D1 D2 D3. left. 27. 21. 28. part 3 Z. 32 33 Y. 34. X. (a) (b) Fig.4. 5 Model for testing process of the product 4.3.2 Analysis result The value of X, Y, Z coordinate of measurement nodes in initial state and final state in the injection molding process is shown in the Fig.4.6 when the simulation process is completed in the Moldex3D. The comparison of difference X, Y, Z value of measurement nodes at two states presents deformation the product dimension depended on changing process parameters.. 48.
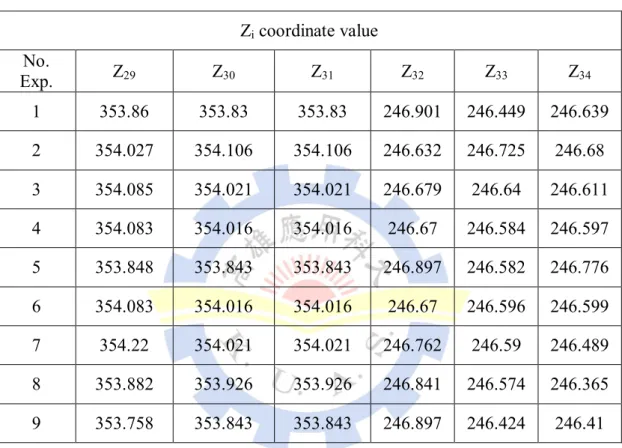
(60) X, Y, Z coordinate of measured nodes at initial states. X, Y, Z coordinate of measured nodes at final states. Displacement of measured nodes at final states. Fig.4. 6 Data of measure nodes in the injection molding process 4.3.2.1 Measurement D1, D2, D3 dimension Three D1, D2, D3 dimensions are calculated based on comparison of difference of the node's value in Z value at final states. So equations calculated for D1, D2, D3 are: D1 = Z29 – Z32 (Dimension 1). (4.1). D2 = Z30 – Z33 (Dimension 2). (4.2). D3 = Z31 – Z34 (Dimension 3). (4.3). D =. D1 D 2 D 3 (Average dimension of D1, D2, D3) 3. 49. (4.4).
(61) =. ( DTC D) 100% (the error percent of the product length) DTC. (4.5). DTC = 107.5 mm (Standard of the product length shows on Fig.3.1) Table 4.6 Zi value of the each experiment Zi coordinate value No. Exp.. Z29. Z30. Z31. Z32. Z33. Z34. 1. 353.86. 353.83. 353.83. 246.901. 246.449. 246.639. 2. 354.027. 354.106. 354.106. 246.632. 246.725. 246.68. 3. 354.085. 354.021. 354.021. 246.679. 246.64. 246.611. 4. 354.083. 354.016. 354.016. 246.67. 246.584. 246.597. 5. 353.848. 353.843. 353.843. 246.897. 246.582. 246.776. 6. 354.083. 354.016. 354.016. 246.67. 246.596. 246.599. 7. 354.22. 354.021. 354.021. 246.762. 246.59. 246.489. 8. 353.882. 353.926. 353.926. 246.841. 246.574. 246.365. 9. 353.758. 353.843. 353.843. 246.897. 246.424. 246.41. Table 4. 7 Summary of D1, D2, D3, D , DTC, and value of each experiment. No. Exp. D1=(Z29-Z32) D2=(Z30-Z33) D3=(Z31-Z34). D. DTC. DTC- D (%). 1. 106.959. 107.381. 107.19. 107.177 107.5 0.323. 0.301. 2. 107.395. 107.381. 107.412. 107.396 107.5 0.104. 0.097. 3. 107.406. 107.453. 107.426. 107.428 107.5 0.072. 0.067. 4. 107.413. 107.432. 107.418. 107.421 107.5 0.079. 0.073. 50.
(62) 5. 107.413. 107.421. 107.416. 107.417 107.5 0.083. 0.078. 6. 106.961. 107.261. 107.064. 107.095 107.5 0.405. 0.376. 7. 107.458. 107.431. 107.470. 107.453 107.5 0.047. 0.044. 8. 107.041. 107.352. 107.294. 107.229 107.5 0.271. 0.252. 9. 107.427. 107.419. 107.430. 107.425 107.5 0.075. 0.069. Based on results in the Table 4.7, the error percent of the product length ( ) can be changed from 0.044% to 0.376%. The values of experiments 1, 6, 8 which has short packing time (packing time at 2s) gotten value high are 0.301%, 0.367%, 0.252%, respectively. Oppositely, the other experiments that were long packing time (packing time at 4s or 6s) get value smaller. Therefore, the results demonstrated packing time that has largely affected to deformation of the product length. 4.3.2.2 The results of displacement of curve profiles of the product This section presents displacement results of several curve profiles testing after the simulation process is completed by Modex3D software.. Their values of the. displacement are got from the comparison between measurement nodes at initial state (the initial state is the states before simulation) and measurement nodes at final state (the final state is the completed state of the simulation process in the injection molding process). The Moldex3D software automatically calculated to get the displacement value of measurement nodes in X Y Z value which is shown in the Fig.4.6. The Table 4.8 only shows the total displacement value of measurement nodes of nine experiments, their values are drawn out like the graph in the Table 4.8. Table 4. 8 The total displacement value of the curve profiles of the product. 51.
(63) No. Exp. Total displacement value (mm) Min. Max. Average. 1. 0.08. 0.145. 0.113. 2. 0.028. 0.133. 0.08. No. Exp. Total displacement value (mm) Min. Max. Average. The graph shows total displacement of each experiment. The graph shows total displacement of each experiment. 52.
(64) 3. 0.04. 0.113. 0.076. 4. 0.023. 0.134. 0.08. 5. 0.037. 0.135. 0.09. No. Exp. Total displacement value (mm) Min. Max. Average. The graph shows total displacement of each experiment. 53.
(65) 6. 0.076. 0.143. 0.12. 7. 0.03. 0.139. 0.084. 8. 0.081. 0.145. 0.113. No. Exp. Total displacement value (mm) Min. Max. Average. The graph shows total displacement of each experiment. 54.
(66) 9. 0.03. 0.12. 0.075. The results of Table 4.7 presents influence of process parameters to displacement of measurement nodes value for every experiment. The experiment 9 has smaller displacement than other experiments, whose maximum, minimum, average values are 0.03, 0.12, and 0.075mm, respectively. The results also carried out a method to manage deformation of curve profiles of product in injection molding. Based on this method, optimum set of parameters can be found out to get minimum deformation of curve profiles to increase quality assembly in the injection molding industry.. 55.
(67) Chapter 5 Optimization Minimum Warpage and Shrinkage 5.1 Analysis and computing mean S/N ratio (dB) The purpose of the research is to reduce the warpage and shrinkage in the injection molding process, so Taguchi equation (3.1) “the smaller is the best” is applied in the study. The equation shows as follows: S/N = – 10 log ( Where:. 1 n 2 yi ) n i 1. (3.1). y: warpage and shrinkage value i: trial number n: number of trials for experiment i. The warpage and shrinkage value are got from maximum total displacement, volumetric shrinkage in the finished warpage process as shown in Fig.5.1. The Fig.5.1 shows warpage and shrinkage of the experiment 1. The warpage and shrinkage value of other eight experiments are collected like the experiment 1. The table 5.1 shows warpage and shrinkage of nine experiments.. 56.
數據
![Table 3. 1 Summary of polycarbonate (PC) properties [19]](https://thumb-ap.123doks.com/thumbv2/9libinfo/8824340.233176/29.892.167.788.775.971/table-summary-polycarbonate-pc-properties.webp)
![Table 3. 3 Relation between the plastic mass of product and runner dimension [21]](https://thumb-ap.123doks.com/thumbv2/9libinfo/8824340.233176/36.892.151.745.300.576/table-relation-plastic-mass-product-runner-dimension.webp)
+7
相關文件
Graduate Masters/mistresses will be eligible for consideration for promotion to Senior Graduate Master/Mistress provided they have obtained a Post-Graduate
[r]
If a DSS school charges a school fee exceeding 2/3 and up to 2 & 1/3 of the DSS unit subsidy rate, then for every additional dollar charged over and above 2/3 of the DSS
[r]
For the primary section, the additional teaching post(s) so created is/are at the rank of Assistant Primary School Master/Mistress (APSM) and not included in calculating the
• A sequence of numbers between 1 and d results in a walk on the graph if given the starting node.. – E.g., (1, 3, 2, 2, 1, 3) from
The algorithm consists of merging pairs of 1-item sequences to form sorted sequences of length 2, merging pairs of sequences of length 2 to form sorted sequences of length 4, and so
For a 4-connected plane triangulation G with at least four exterior vertices, the size of the grid can be reduced to (n/2 − 1) × (n/2) [13], [24], which is optimal in the sense
