國
立
交
通
大
學
光電工程研究所
博
士
論
文
染料敏化太陽電池的金屬氧化物光電極中電子傳遞機
制之研究
Study on Electron Transport Mechanism in Metal
Oxide Photoanode Electrode for Dye-Sensitized Solar
Cells
研 究 生:邱偉豪
指導教授:謝文峰 教授
染料敏化太陽電池的金屬氧化物光電極中電子傳遞機
制之研究
Study on Electron Transport Mechanism in Metal
Oxide Photoanode Electrode for Dye-Sensitized Solar
Cells
研 究 生:邱偉豪
Student: Wei-Hao Chiu
指導教授:謝文峰 教授
Advisor: Prof. Wen-Feng Hsieh
國立交通大學
光電工程研究所
博士論文
A Thesis
Submitted to Institute of Electro-Optical Engineering College of Electrical Engineering and
Computer Science National Chiao Tung University In Partial Fulfillment of the Requirements
for the Degree of Ph. D.
In
Electro-Optical Engineering June 2011
Hsin-chu, Taiwan, Republic of China
i
染料敏化太陽電池的金屬氧化物光電極中電子傳遞機制之
研究
研究生: 邱偉豪 指導教授: 謝文峰 教授
國立交通大學光電工程研究所
摘要
在 2011 年初,原油的價格突破了每桶 110 美元的價格。人們花
費越來越多的努力來尋找替代能源,以度過接下來的高油價時代。在
這篇論文中主要是探討其中一種替代能源-染料敏化太陽能電池的基
礎研究,進而針對染料敏化太陽能電池光電極的結構以及品質進行研
究以及探討。
本文的第一部分,首先四針錐狀氧化鋅奈米粉體將被使用於染敏
太陽電池之光電極以提供有效率之電子傳遞。在 AM1.5 的光源量測下,
以厚度為 42 微米之氧化鋅作為光電極的電池表現出最高效率 4.9%,
而其短路電流、開路電壓以及填充因子分別為 12.3 mA cm
-2、0.6 V
和 0.65。藉由交流阻抗分析技術,我們發現四針錐狀氧化鋅奈米結構
ii
之光電極有 46 微米的有效電子擴散長度,此結果也與短路電流之相
關量測結果一致。另外一方面,對於高黏度之離子液體,我們觀察到
四針錐狀氧化鋅奈米結構之光電極相對於一般傳統之光電極結構,也
提供了更有效率的離子擴散路徑。而對於四針錐狀氧化鋅奈米結構之
光電極這種概念的結構,也適用於其他半導體光電極在 DSC 的未來應
用上。
本文的第二部分將使用透過多次電泳沉積無黏結劑之二氧化鈦
光電極來填補第一次電泳沉積所產生之裂縫。透過較慢的二次電泳沉
積,我們成功地在室溫下製備高品質之二氧化鈦薄膜於 ITO/PEN 塑膠
基板上,此元件達到 5.54%的效率及 0.721 的填充因子。透過交流阻
抗分析技術,我們證實了多次電泳沉積所帶來在元件表現上的效益。
電子擴散常數在較少裂縫之光電極中增加了約 10 倍。透過散射層的
沉積,元件在 AM 1.5 一個模擬太陽光照射下達到的開路電壓、短路
電流、填充因子及光電轉換效率分別為 0.763V, 12.06 mA cm
-2,0.72 及
6.63%。此外,分別使用兩種有機碘化物(TBAI 和 PMII)的塑膠基板染
料敏化電池的實驗結果顯示,含有 TBAI 的 MPN 電解液的塑膠元件比
含有 PMII 的表現出較好的長期穩定性。在攝氏 60 度及可見光 1000
小時照射的加速老化測試下,含有 TBAI 的元件維持了 96.9%的元件
效率表現。
iii
Study on Electron Transport Mechanism in Metal Oxide
Photoanode Electrode for Dye-Sensitized Solar Cells
Student: Wei-Hao Chiu Advisor: Prof. Wen-Feng Hsieh
Institute of Electro-Optical Engineering
National Chaio Tung University
Abstract
In early 2011, the oil price broke through 110 U.S. dollars per barrel. People are paying more and more effort to find the alternative energy sources that would suffice in the following high-oil-price era. In this thesis, the works are associated with some fundamental research in one of the solutions to the energy sources, dye-sensitized solar cells. The dye-sensitized solar cell is taken as the system where the effects of the structure and the quality of the photoanode electrodes will be studied and rationalized.
Firstly, the tetrapod-like ZnO (T-ZnO) nanopartipcles (NPs) are employed to construct an efficient electron transport network as the photoanode of the dye-sensitized solar cells (DSCs). The best performance of DSCs based on 42 μm terapod-like ZnO film showed high energy conversion efficiency of 4.9% with high short-circuit current density of 12.3 mA cm-2, open-circuit voltage of 0.6 V, and filling
iv
factor of 0.65 under AM 1.5 irradiation. High efficient electron transport may be also ascribed by long effective electron diffusion length of 46 μm determined from the electrochemical impedance spectroscopy (EIS) which is consistent with thickness dependent JSC measurement. On the other hand, from time-response photocurrent
transient analysis and EIS studies on the ionic diffusion dynamics of the high-viscosity electrolyte, we observed the presence of a tetrapod-like framework as the photoanode provides more efficient ionic diffusion pathway than the conventional photoanode made of C-ZnO (commercial spherical ZnO) nanopowders. And the concept of tetrapod structure is also suitable for other semiconductor photoanode in DSCs for future applications.
In the second part of this thesis, a multiple electrophoretic deposition (EPD) of binder-free TiO2 photoanode has been developed to successfully fill the crack
occurring after air-drying on the first EPD-TiO2 film surface. With the slow 2nd EPD,
high quality TiO2 thin films are acquired on flexible ITO/PEN substrates at room
temperature and the device efficiency of the dye-sensitized solar cell achieves 5.54% with a high fill factor of 0.721. EIS measurements analyze the great enhancement of the photovoltaic performance through the multiple EPD. The electron diffusion coefficient improved by about 1 order of magnitude in crack-less multiple-EPD TiO2
v
6.63% under AM 1.5 one sun irradiation, having a short circuit current density, open circuit voltage, and filling factor of 12.06mA cm-2, 0.763V and 0.72, respectively. Moreover, the durability of dye-sensitized plastic solar cells using two organic iodides (TBAI and PMII) are investigated. Plastic DSCs with MPN-based electrolyte containing TBAI provide good long-term stability than PMII ones. They maintain 96.9 % of baseline efficiency after 100 h under a prolonged visible light irradiation and thermal (60 oC) stress aging. We will also report the effects of organic iodides, cell-sealing conditions, and the sheet resistance of indium tin oxide coated polyethylene naphthalate substrate on device durability using the EIS.
vi
誌 謝
我常以為,學如逆水行舟,而今輕舟已過萬重山。一路行來,點滴在心,雖 然這不是一部完美的論文,但這本論文的完成,要感謝的真的人很多,僅以此文 表達我的誠摯謝意。 首先衷心的感謝我的指導老師 謝文峰 教授在碩士班兩年以及博士班六年 的期間給予的指導與協助。除了在學業上,提供良好的學習環境,對於我們的問 題也是不厭其煩的解答,此外在待人處事上,也成為了我的榜樣。 在這八年實驗室的日子中也有許多實驗室的夥伴幫助我很多。阿政學長˴ 維 仁學長˴ 志賢學長˴ 黃董˴ 楊松學長也不管在實驗上或是生活上給予許多協助及 關心。當然這幾年來也有許許多多的學弟妹一起辛苦的作實驗以及幫忙完成了許 多實驗室的雜務以及瑣事。 另外,也要謝謝信民學長帶我進入染料敏化太陽能電池的研究領域,也讓我 認識了一群作染敏的高手,使得我的實驗進度可以加快!所以在這也要感謝工研 院綠能所的蔡松雨副組長及童永樑博士對我的實驗的強力支持。感謝坤穆˴ 佳樺 ˴ 明德˴ 孟晉˴ 思萍及曜杉在實驗上給予指導與討論,也謝謝壬安˴ 欣怡和竹筠 在許多地方上的協助! 最後,也感謝所上的張振雄老師˴ 陳方中老師˴ 盧廷昌老師˴ 台大何國川 老師以及中央大學吳春桂老師撥冗參加我的口試,並給我十分寶貴的指導與建議, 使得這本論文更加的完善。vii
當然,還有要在這感謝工研院材化所˴ 綠能所對於我的實驗的支持,以及國 科會提拱的實驗經費,讓我的實驗得以順利完成。
viii
Table of contents
摘要... i
Abstract ... iii
誌謝... vi
Table of contents ... viii
List of figures ... x
List of tables ... xii
Nomenclatures ... xiii
Chapter 1 Introduction ... 1
1.1 Climate change and energy sources ... 1
1.2 Solar cells – A recent story... 4
1.3 Objectives of the current work and Organization of dissertation ... 7
Chapter 2 Background ... 9
2.1 Structure, operation, and physical limits of dye-sensitized solar cell ... 9
2.1.1 Sensitizer dyes ... 10
2.1.2 Electrolyte ... 13
2.1.3 Metal oxide photoanode electrode ... 13
2.1.4 Counter electrode ... 17
2.1.5 Charge loss ... 18
2.2 Characterization methods of solar cells ... 19
2.2.1 The solar resource and Air Mass ... 19
2.2.2 IV-measurement ... 21
2.2.3 Incident proton to current conversion efficiency ... 26
2.2.4 Electrochemical impedance spectroscopy and model of the equivalent circuit ... 27
Chapter 3 Experimental setups and procedures ... 32
3.1 Materials ... 32
3.1.1 Commercial materials ... 32
3.1.2 Synthesize tetrapod-like ZnO nanoparticles ... 35
3.1.3 Formation of TiO2 Nanoscale Materials ... 36
3.2 Preparation of dye-sensitized solar cell ... 36
3.2.1 Photoanode electrode ... 37
3.2.2 Electrolyte ... 40
3.2.3 Counter electrode ... 41
ix
4.1 Physical properties ... 50
4.2 Sintering effect ... 55
4.3 Optimization of photoanode electrode thickness ... 56
4.4 Efficient electron transporting in tetrapod-like ZnO photoanode ... 60
4-5 Influence of photoanode thickness on the photovoltaic performance of ionic liquid device ... 62
4.5 Ionic diffusion dynamics of ionic-liquid electrolyte ... 67
4.6 Summary ... 73
Chapter 5 Multiple electrophoresis deposited crackless TiO2 photoanode for flexible DSCs ... 75
5.1 Compress effect on photovoltaic performances ... 75
5.2 Photovoltaic characteristic of multiple electrophoresis deposition ... 79
5.3 Effect of light scattering layer ... 86
5.4 Long-term stability testing ... 89
5.5 Summary ... 95
Chapter 6 Conclusions and Perspectives ... 97
6.1 Conclusion ... 97
6.2 Perspectives... 99
Reference ... 100
x
List of figures
Fig. 1-1. World marketed energy used by fuel types, 1990-2035 ... 2
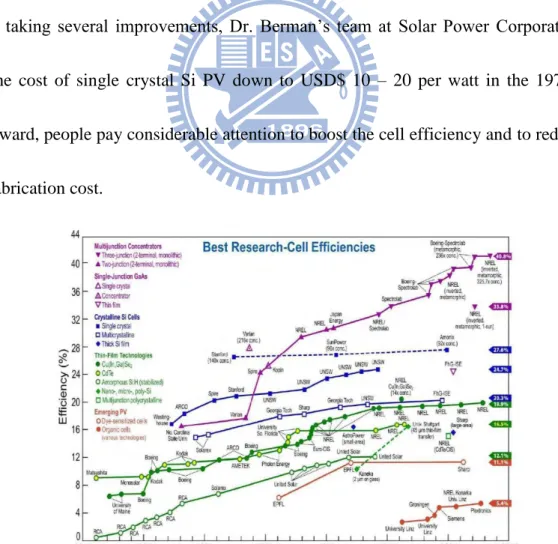
Fig. 1-2. Thirty years evolution in conversion efficiencies of different photovoltaic technologies. ... 4
Fig. 2-1. Structure and operation principle of dye-sensitized solar cell . ... 11
Fig. 2-2. The common TiO2 crystal structures ... 14
Fig. 2-3. ZnO wurtzite structure. ... 16
Fig. 2-4. Solar irradiance spectrum above the atmosphere and at the surface. ... 19
Fig. 2-5. Photovoltaic performance of a laboratory N-719-senistized P-90 TiO2 solar cell ... 23
Fig. 2-6. The effect of shunt and series resistances on PV performance through computing simulation... 25
Fig. 2-7. Typical Nyquist and Bode plots of impedance spectra for a DSC. ... 28
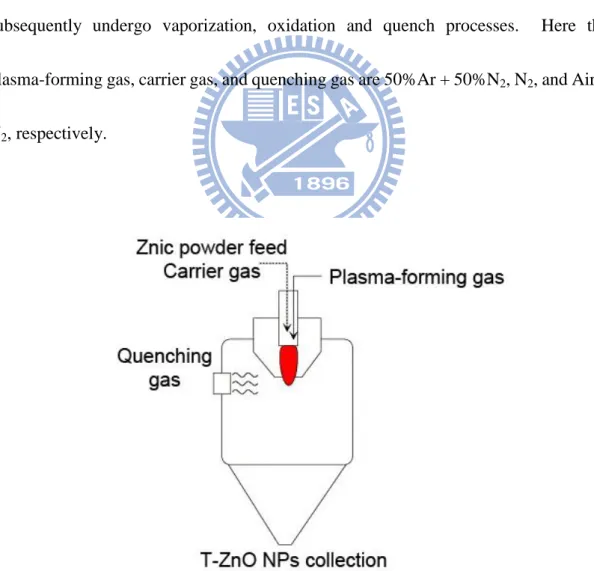
Fig. 3-1 . Schematic of the DC plasma reactor. ... 35
Fig. 3-2. Configuration of the dye sensitized solar cells... 37
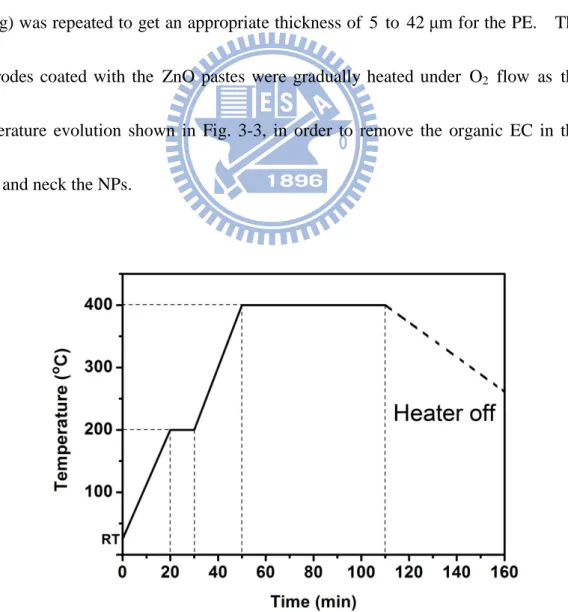
Fig. 3-3. Heating curve for ZnO photoanode electrode. ... 38
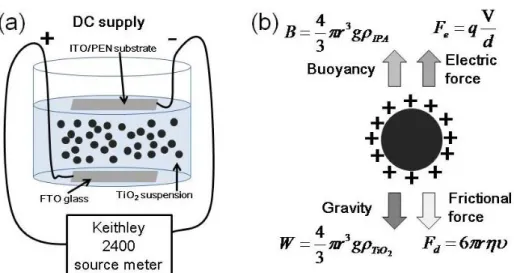
Fig. 3-4. Sketch schemes of the electrophoretic cell, the preparation of TiO2 electrodes, and the significant parameters in EPD process... 39
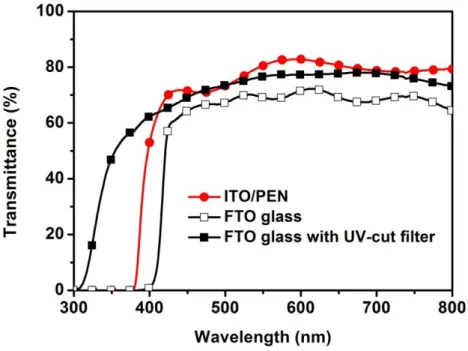
Fig. 3-5. The transmittance spectra of the substrates used in this study. ... 43
Fig. 3-6. The uniformity of the white light source. ... 45
Fig. 3-7. The standard AM 1.5 spectrum compared with the spectrums from the white light source ... 46
Fig. 3-8. The output variation of the white light source. ... 46
Fig. 3-9. Emission spectrum of the white LED array. ... 47
Fig. 3-10. Measured spectral transmittance for ND filters used in this study. ... 48
Fig. 4-1. FESEM and FETEM images of the tetrapod-like ZnO NPs ... 51
Fig. 4-2. XRD patterns of the tetrapod-like ZnO NPs. ... 52
Fig. 4-3. SEM image of T-ZnO and C-ZnO film on FTO/glass ... 53
Fig. 4-4. Optical properties of D149. ... 55
Fig. 4-5. Thickness dependent photovoltaic characteristics of the T-ZnO DSCs with D149 dye.. ... 57
Fig. 4-6. J-V curve and IPCE spetra obtained with DSSCs based on D149 and CDCA absorption ... 60
Fig. 4-7. Nyquist plot of tetrapod-like ZnO DSCs sensitized by Di49 dye ... 61
Fig. 4-8. Dependences of AN-based and IL-based cell performances on film thickness ... 63 Fig. 4-9. Cell performances of AN-based and IL-based DSCs based on C-ZnO and
xi
T-ZnO photoanodes ... 66 Fig. 4-10. The photocurrent transient dynamics of IL-based D149-sensitized solar
cells ... 68 Fig. 4-11. The EIS characteristics of the IL-based D149-sensitized solar cells ... 70 Fig. 5-1. The correlation between the compression pressure of the electrophoretic
deposited TiO2 thin film and device performance. ... 77
Fig. 5-2. The correlation between the compression time of the electrophoretic deposited TiO2 film and the current density and conversion efficiency. ... 78
Fig. 5-3. The microscopy pictures of electrophoretically deposited P-90 TiO2 film on
ITO/PEN film ... 79 Fig. 5-4. The effect of different 2nd EPD TiO2 photoanode on J-V curve of DSC .. 82
Fig. 5-5. The Nyquist plots of DSC device with the different 2nd EPD TiO2
photoanode. ... 84 Fig. 5-6. Cross-section SEM image of an EPD film for 100 nm TiO2 and P90 TiO2
and its IPCE spectra. ... 87 Fig. 5-7. PV characteristics of nanocrystalline TiO2 DSCs with TiO2 photoanode
deposited multiply by P-90 and 100nm NPs... 89 Fig. 5-8. The relationship between the sheet resistance of ITO/PEN and the
immersion time in electrolyte at 60 oC. ... 90 Fig. 5-9. Photovoltaic parameters for plastic DSC with TBAI or PMII after visible
light soaking (1 sun) at 60 oC ... 92 Fig. 5-10. EIS results of plastic DSCs with different iodides under one sun light
xii
List of tables
Table 1-1. Current use and current potentials of selected renewable energy sources. ... 2 Table 3-1. The compositions of the electrolytes used in different chapter of this thesis. ... 40 Table 3-2. Class AAA Standards and Specifications ... 47 Table 4-1. Cell performance of the DSC with hierarchical 20 μm T-ZnO photoanode electrode sintered at different temperature... 56 Table 4-2. Photovoltaic performance of IL-based DSCs and corresponding properties of photoanode determined by electrochemical impedance spectroscopy under full sunlight irradiation. ... 72 Table 5-1. Dye-sensitized solar cell performances with one-step or two-step EPD
preparation methods. ... 80 Table 5-2. Dye-sensitized solar cell performances with two-steps EPD preparation
methods by various EPD currents and time. ... 81 Table 5-3. Parameters determined from fitting EIS data of plastic DSC with
xiii
Nomenclatures
Abbreviations
AM Air mass AN Acetonitrile (C2H3N) BET Brunauer-Emmett-TellerBTU British thermal unit, equal to about 1,055.05585 joules C-ZnO Commercial ZnO
CB Conduction band CDCA Chenodeoxycholic acid CE Counter electrode
GIGS Copper indium gallium (di)selenide (CuInxGa(1-x)Se2)
CPE Constant phase element DC Direct Current
DSC Dye-sensitized solar cell EC Ethyl cellulose
EIS Electrochemical impedance spectroscopy EMAA Ethylene-co-methacrylic acid
EL Electrolyte
EPD Electrophoretic deposition
FESEM Field emission scanning electron microscopy FETEM Field emission transmission electron microscopy FF Filling factor
FTO Fluorine-doped tin oxide (SnO2:F)
HOMO Highest occupied molecular orbital HPLC High-performance liquid chromatography HTM Hole transport material
ICT Intramolecular charge transfer IL Ionic liquid
IPA Isopropyl alcohol
IPCE Incident photon-to-electron conversion efficiency ITO Indium tin oxide (tin-doped indium oxide)
JCPDS Joint committee on powder diffraction standards LUMO Lowest unoccupied molecular orbital
MLCT Metal-to-ligand charge transfer MO Metal oxide
xiv
NP Nanoparticle NW Nanowire OC Open circuit
PE Photoanode electrode PEN Polyethylene naphthalate
PMII 1-methyl-3-propyl imidazolium iodide PV Photovoltaic
Redox Reduction-oxidation RT Room temperature SC Short circuit t-BuOH tert-butyl alcohol T-ZnO Tetrapod-like ZnO
TBAI Tetrabutylammonium iodide TBP 4-tert-butylpyridine
TCO Transparent conducting oxide UV Ultraviolet V Voltage VB Valence band VIS Visible XRD X-ray diffraction
English Symbols
A Photoanode electrode area cm2 Av Avogadro‟s constant = 6.02×10²³ mol-1
C* Concentration of tri-iodide in the bulk electrolyte mol cm-3 Cμ Chemical capacitance of the photoanode μF/cm-2
CPt CPE at the Pt surface μF/cm-2
CTCO1 CPE at the photoanode and its substrate interface μF/cm-2
CTCO2 CPE at the photoanode substrate and electrolyte interface μF/cm-2 cm Velocity of light in the medium m s-1 d Nernst diffusion layer thickness μm Deff Effective electron diffusion coefficient in photoanode cm2 s-1
D Diffusion coefficient of tri-iodide in electrolyte cm2 s-1
Eg Energy gap eV
h Planck constant = 6.626068 × 10⁻³⁴ m2 kg s-1 m2 kg s-1 [I2] Concentration of iodine mol cm-3
xv
[I3-] Concentration of tri-iodide mol cm-3
Idark Dark current of the diode A
ISC Short-circuit current A
IS Saturation current of the diode (typically 10-7 to 10-9 A) A
Iph Photocurrent that depends on irradiation intensity A
Iinj Flux of charge from sensitized dyes inject to photoanode C m-2 s-1
JSC Short-circuit current density mA cm-2
kB Boltzmann‟s constant = 1.38×10⁻²³ J K-1
keff Effective rate constant for recombination in photoanode s-1
ket Reaction rate constant of the dark current from ZnO to tri-iodide
ions in the electrolyte
s-1 L Thickness of the photoanode film μm Ln Electron diffusion length in the photoanode film μm
ncb Electron concentration in the conduction band of the photoanode cm-3
P Compression pressure MPa Pin The incident light power usually equal to 100 mW cm-2 under
the irradiance of AM1.5 spectrum
mW cm-2 Pout Total output power of the solar cell mW cm-2 q Elementary charge = 1.6×10⁻¹⁹ C
RD DC resistance of diffusion of tri-iodide in the electrolyte Ω
Rk Ω
RPt Resistance at the Pt surface Ω cm2
RS Transport resistance of substrate and external circuits Ω
Rser The series shunt resistance of a solar cell Ω
Rsh The shunt resistance of a solar cell Ω
RTCO1 Resistance at the photoanode and its substrate interface Ω cm2
RTCO2 Resistance at the photoanode substrate and electrolyte interface Ω cm2
RW Ω
rk Charge-transfer resistance related to recombination of
electron at the photoanode and electrolyte interface
Ω cm rW Electron transport resistance in photoanode Ω/cm
S Ground state of dye ─
S+ Oxidized dye ─
S* Excited state of dye ─ T Absolute temperature K VT Thermal voltage that equals kBT/q V
VOC Open circuit voltage V
xvi
ZN Finite Warburg impedance of the electrolyte Ω
ZPE Impedance of the photoanode electrode Ω
ZPt Impedance of the Pt electrode Ω
ZTCO1 Impedance of the photoanode and its substrate interface Ω
ZTCO2 Impedance of the photoanode substrate and electrolyte interface Ω
Z‟ Real part of impedance of the cell Ω Z‟‟ Imaginary part of impedance of the cell Ω
Greek Symbols
η Energy conversion efficiency of the solar cell % ηCOL The electron collection efficiency of the solar cell %
ηING The electron injection efficiency of the solar cell %
ηLH The light harvesting efficiency of the solar cell %
λ Wavelength of the light nm π Transcendental constant ≈ 3.14159 ─ τd Transporting time of electrons in photoanode s
τeff Effective lifetime of electrons in photoanode s
Φ The photon flux s-1
Ω Solid angle sr
1
Chapter 1 Introduction
1.1 Climate change and energy sources
From the historical period of global industrialization to the present, the energy consumption was growth explosively. U.S. Energy Information Administration predicted in 2005 that the annual world primary energy consumption would increase 49% from 2007 to 2035. Total world energy use rises from 495 quadrillion British thermal units (BTU) in 2007 to 590 quadrillion BTU in 2020 and 739 quadrillion BTU in 2035 [1] Presently, the energy economy is still highly dependent on three forms of fossil fuels- oil, natural gases and coal with high percentages (see Fig. 1-1). The fossil fuels have contributed to the increase in carbon dioxide (CO2) in the
atmosphere from 313 ppm in 1960 to about 390 ppm in 2010. The greenhouse effect of combustion-produced carbon dioxide has been become seriously. Until now, people have seen mild effects from global warming caused by the greenhouse effect. The global warming not only melts the ice volume at South Pole led to several meters of sea level rise but also changes the climate to affect the agriculture (food production).
In addition to the fossil fuels, nuclear power is one of the carbon-free energy resources. But notably form the Three Mile Island nuclear accident (1979),
2
Chernobyl nuclear disaster (1986) and Fukushima nuclear accidents (2011), people learned that the nuclear power isn‟t 100% safe to operate. So people pay more attention to find clean and safe renewable energy to replace the fossil fuel and nuclear power.
Fig. 1-1. World marketed energy used by fuel types, 1990-2035 (quadrillion BTU) [1]
Table 1-1. Current uses and current potentials of selected renewable energy sources. [2]
Resource Current use (in 2000) Technical potential (exajoule/yr) Theoretical potential (exajoule/yr) Hydropower 9 50 147 Biomass energy 50 >276 2900 Solar energy 0.1 >1575 3900000 Wind energy 0.12 640 6000
On the other hands, oil might run out in around 40 years at current reserves-to-production (R/P) ratio with a daily consumption of 82.5 million barrels. A better synopsis is for natural gases that can last for about 60 years and coal, being
3
the most abundant, for 150 years. [1] Much interesting in renewable energy sources appeared in the wake of the oil crisis in 1970s. Table 1.1 lists the potential of the selected renewable energy sources. Solar power has great potential with more than thousand times comparing to other renewable energy sources, but in 2000 supplied less than 0.1% of the world's total energy supply. As we know, sun is just like a forever-burning fire due to its lifetime (about 15 x 106 years) comparing to human‟s life (100 years). The earth receives about 105 TW of solar power at its surface. The sun is a free and unlimited energy source. This is a huge energy source that means harvesting the total solar energy for one hour would supply the energy need of the humanity for one year. Many solar photovoltaic power stations with < 100 MW peak power have been built, mainly in Europe. Nowadays, several large photovoltaic electric plants are under planning to construct. Ordos Solar Project in China plans to build a CdTe thin film solar plant with DC peak power of 2 gigawatts (GW) and is scheduled completion date 2019. Planned installations in USA (Topaz Solar Farm, Desert Stateline, Aqua Caliente Solar Project, California Valley Solar Ranch, etc.) will produce about 200 to 500 MW at peak and will be completed between 2013 and 2015. [3]
4
1.2 Solar cells – A recent story
A solar cell can be described as a device that is able to transform the photon energy to electric energy in form of current and voltage. The photovoltaic effect was first recognized by a French physicist A. E. Becquerel in 1839, [4] but the first photovoltaic cell with around 1% efficiency was built by Charles Fritts until 1883. The modern photovoltaic (PV) cell by using a diffused silicon p-n junction was developed at Bell Laboratories in 1954. [5] The cell produced 1 watt of electric power in bright sunlight cost about USD$ 250, comparing to USD$ 3 for a coal plant. After taking several improvements, Dr. Berman‟s team at Solar Power Corporation cut the cost of single crystal Si PV down to USD$ 10 – 20 per watt in the 1970s. Afterward, people pay considerable attention to boost the cell efficiency and to reduce the fabrication cost.
Fig. 1-2. Thirty years evolution in conversion efficiencies of different photovoltaic technologies. (NREL via Solid State Technology)
5
In parallel, Audubert and Stora discovered the photovoltaic effect in cadmium sulfide (CdS) in 1932, opening up the way of II-VI thin film solar cells. [6] In the following years, p-n junctions with CdS and CdTe were studied for a higher efficiency. Wu X. et al. have achieved a CdTe polycrystalline thin-film solar cell demonstrating total-area efficiency of 10.9% in 2000 which was confirmed by the National Renewable Energy Laboratory (NREL). [7] For III-V solar cells, a 1 cm2 thin-film GaAs device with efficiency of 27.6% has been measured at NREL fabricated by Alta Devices, Inc. [8] A high efficiency of 42.3% has been obtained for the triple junction solar cells consist of indium gallium arsenide (InGaAs, 0.94 eV), gallium arsenide (GaAs, 1.42 eV) and indium gallium phosphide (InGaP, 1.89 eV) under 406 suns concentrated illuminations. [9] Copper indium gallium diselenide (CIGS ; formula : CuInxGa(1-x)Se2) is a direct-bandgap material for thin film PV application,
and its bandgap varies continuously with x from about 1.0 eV (for copper indium selenide) to about 1.7 eV (for copper gallium selenide). A team at the NREL achieved 19.9% new world record efficiency in 2008. [8] However, the materials used in these PV technologies include rare elements, such as indium (Crustal abundance = 0.16 ppm ), selenium (0.05 ppm), cadmium (0.15 ppm), and tellurium (0.001 ppm) [10] , could be a restriction if PV became the main energy supplier.
6
had a breakthrough in the early 1990s in É cole Polytechnique Fédérale de Lausanne (EPFL), Swiss by Prof. Michael Grätzel and Brian O‟Regan. With the discovery of the Ru-based N3 dye and the later panchromatic “black dye”, the electrical conversion efficiency was pushed well over 10%. [11, 12] This cell is extremely promising because it is made of low-cost raw materials, such as TiO2 (Ti of crustal abundance =
6600 ppm [10]) or ZnO (Zn : 79 ppm), and does not need elaborate apparatus to manufacture. Although the Ru-complex dye was widely used in DSC due to its outstanding photovoltaic properties, the Ru element is a rare transition metal belonging to the platinum group of the periodic table and its crustal abundance is only 0.001 ppm. Scientists work on other kind of dye to avoid the lack of Ru element. Several research groups in the world, e.g., Prof. Michael Grätzel in Swiss [13], Prof. Eric Wei-Guang Diau in Taiwan [14], have experimented with a wide variety of Zn-porphyrin dye and reported the efficiency of about 5%. Metal-free organic dyes, such as D149 [15], have also been considerably researched in recent years to replace Ru-dye. [16] Due to several kinds of dyes with different absorption wavelength ranges, DSC is capable of having colorful designs for building-integrated photovoltaic (BIPV) applications.
In 2008, Prof. Grätzel demonstrated 8.2% efficiency DSC consisting of a new solvent-free liquid redox electrolyte, and the device retained over 93% of its initial
7
conversion efficiency under the irradiance of AM 1.5G sunlight during successive full-sun visible-light soaking at 60 °C. Recent achievements of long-time stability under accelerated experiments with non-volatile liquid (e.g., MPN) and ionic liquid electrolyte greatly promote the practical application of this low-cost PV and put it currently right at the start of commercialization stage.
1.3 Objectives of the current work and organization of
dissertation
The thesis is then subdivided into mainly six parts: Chapter 2 gives a brief background of DSC including the structures, the working principles, and the related mechanisms. Chapter 3 addresses all the experimental processes of device fabrication and characterization techniques. Chapters 4 and 5 discussed this dissertation research. It will be focused on realizing the effects of the structure and the quality of the photoanode electrodes. In Chapter 4, a hieratical structure of photoanode electrode (PE) made by tetrapod-like ZnO (T-ZnO) was demonstrated. And its electron dynamics in PE and ionic diffusion mechanism in ionic liquid (IL) film will be discussed. Chapter 5 provides a method to resolve the crack issue of low-temperature flexible DSC. And its long-term stability properties are also tested and discussed. A chapter of general conclusions is then made on the basis of all
8
9
Chapter 2 Background
In this chapter, the structure, the operation and the physical limits of dye-sensitized solar cell (DSC) will be described first. And then the characterization methods of DSC, which were used in this study, will be introduced.
2.1 Structure, operation, and physical limits of
dye-sensitized solar cells
Figure 2-1 shows a schematic representation of the operating principle of DSC including the dye sensitizer, the metal oxide photoanode electrode (PE), the electrolyte, and the counter electrode (CE).
The operation of DSC represents an interesting convergence of photography and photoelectrochemistry, both of which rely on photoinduced charge dynamic at a liquid–solid interface and in pure bulk medium (liquid or solid). These dynamics are listed below and will be discussed in the following:
(I) Dye sensitizers adsorbed on the metal oxide (MO) surface absorb incident photon flux. The dyes are excited from the ground state (S) to the excited state (S∗) via the metal to ligand charge transfer (MLCT) transition.
10
(II) The excited electrons are injected into the conduction band (CB) of the MO, resulting in the oxidation of the dye.
∗ S+ (2-2)
(III) The injected electrons transported between MO nanoparticles (NPs) with diffusion toward the back contact TCO.
(IV) The oxidized dye (S+) accepts electrons from the ion redox mediator, regenerating the ground state (S), and is oxidized to the oxidized state, .
(2-3) (V) Catalyze the redox couple viz. regeneration reaction at counter electrode.
(2-4) (VI) Interfacial charge recombination
(2-5) (VII) Back-reaction electron recombination
(2-6)
2.1.1 Sensitizer dyes
The current obtained from a DSC is determined by the energy difference between the HOMO and the LUMO of the dye, which is just like the energy bandgap (Eg) for
inorganic semiconductor materials. Due to the utilization of the long-wavelength region in the solar spectrum, the smaller the HOMO–LUMO energy gap, the larger the current will be obtained.
11
Fig. 2-1. (a) Structure and (b) operation principle of dye-sensitized solar cell (DSC).
Charge separation in the DSC is achieved by photoinduced electron injection (~fs) from the dye molecular excited state of the sensitizer to semiconductor nanoparticles (NPs). For example, for efficient dye molecular, such as Ru-complex dye N719, absorbed on nanocrystalline TiO2 film, these complexes undergo strong MLCT under
visible irradiation and the injecting molecular orbital is the π* wave function of the carboxylated bipyridyl ligand. The interaction between carboxylate groups with the surface Ti(IV) ions results in good electronic coupling of the π* wave function with
12
the 3d orbital manifold of the conduction band of the TiO2, leading to very rapid
injection dynamics. [17]
The energy level of the LUMO must be sufficiently negative with respect to the CB of MO (∆E1) to inject electrons effectively. On the other hand, The HOMO
level of the sensitizer must be sufficiently more positive than the redox potential (∆E2)
of the electrolyte (commonly is ) to accept electrons effectively and to regenerate excited dye in order to re-absorb photon. And it is reported that the energy gaps (∆E1 and∆E2) should be larger than approximately 200 meV to give a
suitable driving force for each of the electron-transfer reactions.
Fast dye regeneration is a prerequisite for an efficient DSC due to fast re-absorption of light. In the pure solvent system, the lifetime of dye cation can be as long as milliseconds. [18] However, dye cation quenching of down to microseconds has been observed by introducing redox couples that the most widely used . Dye regeneration is faster with increasing concentrations. On the contrary, dye regeneration in DSCs with solid-state hole conductor system or high viscosity ionic liquid system has not been thoroughly studied and demands further pertinent work.
13 2.1.2 Electrolyte
The electrolyte plays the important role of regenerating dye-cations, see Eq. 2-3 with characteristic time ~ μs, produced by the injection (~fs) of electrons from photo-excited dyes to metoal oxide (MO) and transporting the positive charge to the counter electrode (CE). Nowadays, redox system is still the best electrolyte for DSCs. Efficiencies of more than 11% with AN-based electrolyte [19] and 8% long-term stability at 80 °C with a low volatile electrolyte [20], such as MPN-based system, have been achieved. The liquid electrolyte has some potential problems, such as the leakage and volatilization of solvents, possible desorption and photodegradation of the attached dyes, and the corrosion of Pt counterelectrode that limits the long-term performance and practical use of DSCs [18, 21, 22]. The room temperature ionic liquids (ILs) have attracted considerable interests as a potential candidate for replacing the volatile organic solvents due to their negligible vapor pressure, stable chemical properties, and high ionic conductivity. Therefore, researchers pay much attention to improve the performance of DSC with IL electrolytes.
2.1.3 Metal oxide photoanode electrode
14
purposes of collecting and transporting (~ ms) photoinduced electrons injected (~fs) from the photoexcited dye via MO conduction band to the TCO substrate then to the external circuit. High porosity and suitable pore sizes of the porous MO layer increase the dye adsorption capacity and light harvesting ability. The recombination reactions also occur at the surface of PE that will be discussed at the end of this section. Typically, two kinds of semiconductors, TiO2 and ZnO, are commonly used
in DSC and will be discussed later.
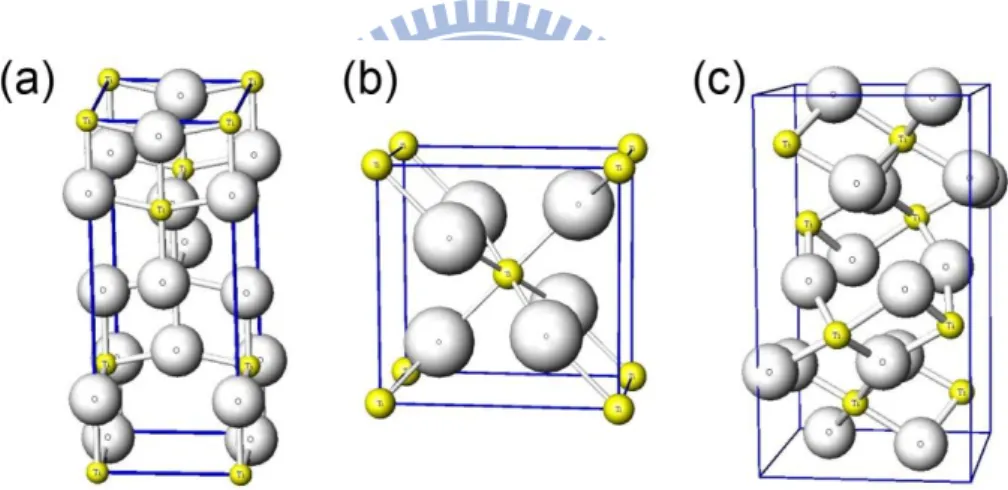
Fig. 2-2. The common TiO2 crystal structures : (a) Anatase structure with space group I41/amd or
Pearson symbol tI12. (b) Rutile structure or C4 type structure with space group P42/mnm Or Pearson
symbol tP6. (c) Brookite structure or C21 type structure with space group Pbca or Pearson symbol
oP24.
Titanium dioxide (TiO2), also known as titanium(IV) oxide or titania,has two
crystalline forms that are anatase and rutile, shown in Fig. 2-2. Anatase appears as pyramid-like crystal and is stable at low temperature, whereas needle-like rutile crystal is dominantly formed at high temperature process. Single crystal of TiO2 also has
15
rutile structure. The densities are 3.89 g cm-3 and 4.26 g cm-3for anatase and rutile respectively. Rutile absorbs ca. 4% of the incoming light in the near-UV region, and band gap excitation generates holes that act as strong oxidants reducing the long-term stability of the dye-sensitized solar cells. The third crystalline form of TiO2, brookite,
is difficult to produce and is therefore not of practical interest for DSC. The band-gaps of the crystalline forms are 3.2 eV (the absorption edge at 388 nm) for anatase and 3.0 eV (the absorption edge at 413 nm) for rutile. However, DSC with pur rutile TiO2 PE exhibited only 30% smaller short circuit current (ISC) than that with
pure anatase TiO2 PE, and had the same open circuit voltage (VOC). [23] In addition
to the good chemical stability of nontoxic and inexpensive TiO2, anatase TiO2 has
been the most popular material of study in DSCs compared to other metal oxide material until now.
Zinc oxide is an inorganic compound with the formula ZnO. It usually appears as a white powder, nearly insoluble in water. Zinc oxide crystallizes in three forms: hexagonal wurtzite, cubic zinc blende, and the rarely observed cubic rocksalt. The hexagonal wurtzite structure shown in Fig. 2-3 is the most stable at ambient conditions and thus the most common. The hexagonal wurtzite structure has a point group 6 mm in Hermann-Mauguin notation or C6v in Schoenflies notation, and the
16
ratio c/a ~ 1.60 is close to the ideal value for hexagonal cell c/a = 1.633.
Fig. 2-3. ZnO wurtzite structure, also called B4 type structure. Space group is P63mc. Pearson symbol
is hP4. Wurtzite is hexagonal stacking of ZnO.
The versatile ZnO is a wide-bandgap (3.37 eV) semiconductor of the II-VI semiconductor group, which is similar to TiO2 of 3.2eV. The native doping of ZnO
(due to oxygen vacancies) is n-type. This semiconductor has several favorable properties: good transparency, high electron mobility (about 155 cm2V-1s-1 for high quality thin film [24]), wide bandgap, strong room-temperature luminescence, etc. Those properties are already used in emerging applications for transparent electrodes, heat-protecting windows, electronic applications, acoustic devices or solar energy devices. [25-29] ZnO also can be tailored to various nanostructures (such as
17
nanowire [30, 31], nanosheet [32-34], nanodendrite [35, 36], popcorn [37, 38], tetrapod [39-41], etc.) as compared to TiO2, which provides a promising means for
improving the performance of the photoelectrode in DSCs. [42]
2.1.4 Counter electrode
Tri-iodide ions, , formed by the reduction of dye cations with ion, are re-reduced to I− ions at the counter electrode (CE). To reduce the tri-iodide ions, the
counter electrode must have high electrocatalytic activity. Pt-coated (5–10 μg cm-2) on TCO substrates are usually used as the CE. Pt-free counter electrodes for the DSC include carbonaceous materials such as graphite [43, 44], carbon black [45, 46], carbon nanotubes [47, 48], activated carbon [49], and organic ion-doped conducting polymers of poly(3,4-ethylenedioxythiophene) (PEDOT) [50, 51] on both indium tin oxide (ITO) and FTO-glass. The electrocatalytic activity of CE directly affects the fill factor of the device. A desirable exchange current density corresponding to the electrocatalytic activity for the reduction of ions is 10 to 200 mA cm−2. [52, 53] The obtained counter electrode was optically transparent and of highly dispersed platinum particles for catalyzing redox reaction.
18 2.1.5 Charge loss
Due to the relatively small electron diffusion coefficient Deff (~10-5 cm2s-1 for
TiO2) and slow electron diffusion process (~ms for TiO2), electrons in TiO2 porous
film may recombine with dye cation S+, see Eq. (2-5) with ~ ms, and/or the oxidized form of the redox couple in the electrolyte [Eq. (2-6), ~ ms], typically . These two interactions of molecular species with the surface of metal oxide can affect the solar cell performance in two principal ways. First, they can alter the recombination kinetics of photo-excited electrons with by passivating the metal oxide. Second, they can charge the surface (either positively or negatively), which will lead to movement of the metal oxide conduction band with respect to the electrochemical potential of the redox couple. Both effects will change Voc of the cell and affect the recombination, as has been shown for pyridine and ammonia. [54, 55]
The transfer of electrons from TCO to the triiodine ions in solution (charge recombination) results in another important loss (back-reaction) in DSCs. The charge recombination can be significantly mitigated by using thin compact blocking layers of TiO2 [56] or other blocking layers such as Nb-doped TiO2 [57], Al2O3 [58],
19
2.2 Characterization methods of solar cells
The dye-sensitized solar cell is a complex device with several interfaces between the components. In this section, some of the most relevant techniques, such as I-V measurement, incident photon-to-electron conversion efficiency (IPCE), electrochemical impedance spectroscopy (EIS), and photocurrent transient measurement, are presented.
2.2.1 The solar resource and Air Mass
Fig. 2-4. Solar irradiance spectrum above the atmosphere and at the surface. [59]
The solar spectrum is a broad-band light source with different wavelengths, ranging from ultraviolet, visible and infrared regions of the electromagnetic spectrum. According to the black-body radiation, the energy density per wavelength deγ/dλ can be
20
expressed as a function of λ by the equation shown below.
, (2-7)
where dΩ is solid angle element, cmis the velocity of light in the medium, KB and h is
the Boltzmann constant and Planck constant, respectively. The maximum power of the sun is at a wavelength of about 500 nm by taking d2eγ/dλ2 = 0 (at about 5,800 K).
The power density at the sun‟s surface is a huge value of 62 MW m-2
and it reduces to 1353 W m-2 at the point just outside the Earth‟s atmosphere since the solid angle subtended by the sun, Ωs, is as small as 6.8 × 10⁻⁵
sr. On passing through the atmosphere, the spectrum is partially attenuated by the absorption of oxygen, ozone in the ultraviolet region and water vapor, carbon dioxide, methane in the infrared.
The „Air Mass‟ factor describe the attenuation from the absorption increases with the mass of air through which the radiation passes. For a thickness of l0 of the
atmosphere, the path length l through the atmosphere for radiation at an incident angle α relative to the normal to the earth‟s surface is given by
. (2-8) The ratio l/l0 is called the Air Mass factor. The spectrum outside the atmosphere is
denoted as AM0 and AM1 means that sun light perpendicular incidence on the surface of the earth. The standard spectrum for moderate weather is AM 1.5, which corresponds to a solar incident angle of 48o relative to the surface normal ( ) and gives a mean irradiance of 1,000 W m-2
21
with seasons, climates, day time and the different altitude area on the earth. For the laboratory measurement, the specification requirements of the solar simulator must been met for ASTM E927-05 standard and will be described in Section 3-3 in detail.
2.2.2 IV-measurement
The photovoltaic (PV) performance of DSCs is estimated from the current-voltage (I-V) measurements, and the photovoltaic parameters, such as open circuit potential (VOC), short circuit current (ISC), fill factor (FF), and efficiency (η), are also obtained.
These parameters are typically measured under the standard condition of cell temperature 25 oC, incident light radiation of 100 mW cm-2, and the spectral power distribution of AM1.5.
Under illumination, the current-voltage characteristics follow the well-know equation below,
=
, (2-9)
where Idark is the dark current of the diode, Is is the saturation current of the diode
(typically 10-7 to 10-9A), and V is the voltage applied on the terminals of the cell. Iph
is the photocurrent that depends on irradiation intensity and VT is often referred to as
the thermal voltage that equals KBT/q with q being the elementary charge. For
non-ideal devices, an ideality factor ( ) is also used here to describe the weaker dependence of dark current on voltage. Figure 2-1 depicts an experimental
22
I-V characteristics of a DSC made with N719-sensitized TiO2 (degusa P90)
photoanode with 2 cm2 active area, and together with the power curve. The following parameter can be derived with the I-V curve.
The VOC is measured under the condition when there is no external load connected,
i.e., the circuit is broken or open. In this condition, there is no external current flow between the two terminals of the device, i.e., I = 0 and V =Voc. From Eq. 2-9,
, (2-10)
. (2-11) Voc increases logarithmically with the photocurrent and the light intensity and it is also associated with the dark current. For the ideal diode (m=1), the diode has the minimum dark current and gets the maximum VOC.
The Isc is measured at the condition when the applied voltage, V, equals zero. From
Eq. 2-9,
, (2-12)
23
Fig. 2-5. Photovoltaic performance of a laboratory N-719-senistized P-90 TiO2 solar cell: I-V curve and
parameters of DSCs output current (-■-) and power (-□-) as function of voltage measured under AM 1.5 standard test condition.
Fill factor (FF) is the most important parameters of a PV cell. It is defined as the ratio of maximum power output ( ) and the product of VOC and ISC.
Therefore, from Fig. 2-1,
. (2-13)
Combining Eqs. 2-8 and 2-12, we obtain the approximation for FF in Eq. 2.13,
. (2-14)
Typically, FF of DSC ranges from 0.5 to 0.8 depending on the individual device and usually increases with the decreasing light intensity.
24
desired FF. Finally, comparing the ratio of total output power (Pout) with the solar
power input (Pin), the conversion efficiency (η) can be measured,
. (2-15)
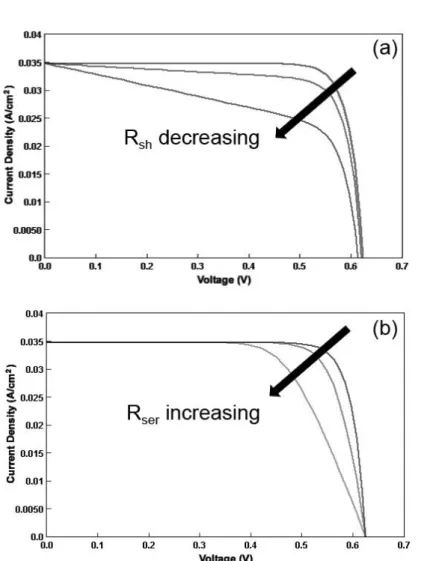
The series (Rser) and shunt (Rsh) resistances of a solar cell are also important
parameters to its PV performance. In a DSC, Rsh stands for the leakage path across
the dye/semiconductor interface, induced by defects in the semiconductor bulk and at the surface of the oxide. Rsh was calculated by the slope of the tangent line at Isc. [60]
Rser is mainly series connected to the bulk resistances of semiconductor films, TCO
substrate, metallic contacts, and electrolyte. It is determined by following methods: (a) Different illumination level method
The method proposed by Wolf and Rauschenbach [61] is calculated from two I-V curves illuminated by two closed light intensities (P1 and P2). Series resistance was
determined by using the given formula below:
, (2-16)
, (2-17) where V1 and V2 are the voltages at light intensities P1 and P2, respectively, and I1 is
the current at light intensity P1.
(b) Constant illumination level method
25
curve of the solar cell. Rser is determined from the slope of the plot of as a
function of by using the polynomial approximation.
Fig. 2-6. The effect of (a) shunt and (b) series resistances on PV performance through computing simulation. The area of the solar cell is 1 cm2.
The main impact of series and shunt resistances is to reduce the fill factor, although excessively high values may also reduce the short-circuit current. In addition, low shunt resistance causes power loss in solar cells by providing an alternate current path
26
for the light-generated current, the so-called dark current. Such a diversion reduces the voltage from the solar cell. The effect of the series and shunt resistances on the IV curve is shown. [62]
2.2.3 Incident proton to current conversion efficiency
Incident proton to current conversion efficiency (IPCE) is the measurement of spectral response of the cell that contains the partial information of quantum efficiencies of photocurrent generation processes such as the light harvesting (ηLH),
electron injection (ηINJ), and charge collection efficiency (ηCOL) as
, (2-18)
where JSC is the short circuit current density of the DSCs at incident monochromatic
light with wavelength λ; q and Φ are the elementary charge and photon flux, respectively. [63] Following each step of conversion, ηLH is associated with the
ability of the dye in absorbing photons. ηINJ represents the excited electron injected
from the LUMO of dye molecule to the conduction band of metal oxide. Finally, the electron collection efficiency (ηCOL) is the amount of electrons that effectively reach
the electron collector (eg. FTO or ITO substrate) avoiding recombination. It should be noted that IPCE measurement is performed under short circuit condition, where electron lifetime is higher. It is noteworthy that the high fraction of IPCE is most
27
important for efficient DSCs and the mesoporous metal oxide with high surface area is the prerequisite for higher IPCE value.
2.2.4 Electrochemical impedance spectroscopy and model of the equivalent circuit
Electrochemical impedance spectroscopy (EIS) is one of the most powerful methods to probe DSCs and that can provide sufficient information about the electrochemical reactions in the devices. In EIS experiment, the device is under illumination or dark, and controlled by an applied harmonically modulated bias, , as a small perturbation. An increase of on the device will cause
a current flow, , with a phase delay θ. The impedance of the device is thus given by
. (2-19)
Recently, the interpretation of the EIS spectrum of a DSC has been thoroughly discussed by several models. In this thesis, a transmission line model is used to describe the typical Nyquist and Bode plots of EIS in the system, as shown in Fig. 2-7. This model is explained by the multiple trapping proposed by J. Bisquert, who assumed that the electron diffusion and recombination occur only via the conduction band of metal oxide and by trapping and detrapping events. [64-67] Accordingly, the RC time constants of three peaks are shown in the Bode plot.
28
Fig. 2-7. Typical Nyquist and Bode plots of impedance spectra for a DSC. Experimental data are plotted in black squares and the fitting is in solid lines by the transmission line model of equivalent
circuit.
In the transmission line model, the whole metal oxide porous film is treated as an interconnected network. Under a modulated bias, electrons are injected from the TCO substrate into the metal oxide and the electron propagates through individual particles with a transport resistance of rW. Some of the electrons recombine with the
oxidized species in the electrolyte, such as commonly, characterized by a charge transfer resistance of rK and a capacitance of cμ, and the rest of the electrons are then
29
voltage modulation. Assume the thickness of metal oxide porous film is L, the electron transport resistance is , the interfacial charge recombination resistance is and the chemical capacitance of the film is , where the lower case letters represent that the resistances and the capacitance are normalized to the film thickness. The diffusion−recombination model based on the following three assumptions: (1) electrons in the conduction band diffuse, (2) there is no trap, and (3) an irreversible first-order reaction is assumed for the recombination. [67] The impedance of the metal oxide porous PE can be obtained as follow:
, (2-20)
where ωK is the recombination rate. The equation can be further classified into the
following three cases:
(a) , the limiting case leads to the simple diffusion case,
. (2-21)
Thus, the real part, , of impedance ZPE approaches ( RW /3) and the imaginary part,
, of impedance Z
PE becomes ∞.
(b) : When the reaction resistance, Rk, is finite, Eq. 2-19 is expressed by
Eq. 2-21:
. (2-22) This equation means that there is a small increase part along the straight line of
30
= − at high frequency and a large arc at low frequency. The latter corresponds to the recombination process, which is much slower than diffusion through the metal oxide PE in this case. And two important relationships can be derived. The peak frequency of an arc in a Nyquist plot, ωmax, is given as
. (2-23)
The dc resistance, Rdc, at ω = 0 is given as
. (2-24)
(c) leads to the following equation:
. (2-25)
This case must be avoided for attainment of the highly efficient cells. The following two relationships are also derived.
, (2-26) . (2-27)
From the shapes of the Nyquist plot of the PE impedance (in the 10−100 Hz range), and are estimated from the peak frequency, ωmax, and the diameter by using
Eqs. 2-22, 2-23, 2-25 and 2-26, respectively. The effective electron diffusion coefficient in metal oxide porous film can be calculated by the following equation:
. (2-28)
The electron diffusion length in metal oxide porous film, Ln, is given by
31
Regeneration of at the counter electrode (CE) is characterized by RPt and CPt,
which are the charge transfer resistance and double layer constant phase element (CPE, stands for an imperfect capacitor) at the platinized TCO, respectively. RTCO1 and
CTCO1 are the resistance and the CPE at the TCO and photoanode contact, respectively.
The subscript “TCO2” stands for the interface at the exposed TCO/electrolyte, and the resistance and the CPE change with surface conditions (blocking layer and cleanliness). The impedances at these three interfaces can be described approximately by the following simple RC circuit,
. (2-30)
The finite Warburg impedance of the low frequency arc (in the mHz range) describes the diffusion of tri-iodide ions in the electrolyte,
, ∗ , (2-31) ,
where DI and δ represent the diffusion coefficient of and the thickness of the
liquid film, respectively. The number of electrons transfer in each reaction, m, is 2 in redox case. AV and C* are Avogadro's constant and the concentration of
32
Chapter 3 Experimental setups and
procedures
3.1 Materials
3.1.1 Commercial materials
Here, the materials and regents used in our experiments without further purification are listed below.
Name Chemical Formula Supplier Note Acetonitrile (AN) C2H3N J.T. Baker HPLC grade Chenodeoxycholic acid (CDCA) C24H40O4 Sigma-Aldrich
Chloroplatinic acid hexahydrate H2PtCl6∙6H2O Showa
D149 indoline dye C42H35N3O4S3 Mitsubishi Paper Mills Limited 1,2-dimethyl-3- propylimidazolium iodide (PMII) C8H15N2I Merck
33
Ethyl cellulose (EC)
[C6H7O2(OH)3n (C2OH5)n]x Fluka 5–15 mPa s, #46070 30–70 mPa s, #46080 Fluorine-doped tin oxide glass
(FTO glass) ─
Nippon Sheet Glass Co. Ltd.
8-10 Ω/□ 3 mm thick Indium tin oxide coated
polyethylene naphthalate film (ITO/PEN)
─ Tobe, Inc 10 Ω/□ 120 μm thick Iodine I2 Sigma-Aldrich 99.8%
Isopropyl alcohol (IPA)
(CH3)2CHOH
Merck Analysis Grade Lithium iodide LiI Merck
3-methoxypropionitrile (MPN) C4H7NO Alfa Aesar N-methylbenzimidazole (NMBI) C8H8N2 Sigma-Aldrich N719 Ruthenium dye C58H86N8O8RuS2 Solaronix (Aubonne, Switzerland) 1-Octyl-3-methylimidazolium hexafluorophosphate (C8MImPF6) C12H23N2PF6 Surlyn DuPont Random copolymer poly (EMAA)
34
Sodium borohydride NaBH4
tert-butyl alcohol (t-BuOH)
C4H10O Sigma-Aldrich 4-tert-butylpyridine (TBP) C9H13N Sigma-Aldrich Terpineol C10H18O Fluka Anhydrous, #86480 Tetrabutylammonium iodide (TBAI) C16H36NI ACROS Titanium isopropoxide C12H28O4Ti P90 TiO2 TiO2 Degussa AG,
Germany a kind gift
Tetramethylammonium hydroxide (TMAH)
C4H13NO
Sigma-Aldrich
Zinc powder Zn Alfa Aesar 10 μm size Commercial ZnO
(C-ZnO) NPs ZnO
Seedchem, Australia
35 3.1.2 Synthesize tetrapod-like ZnO nanoparticles
In this study, a novel DC plasma reactor was used to synthesize tetrapod-like ZnO (T-ZnO) nanoparticles (NPs) at 70 kW operation power and atmospheric pressure. The synthesis rate of the T-ZnO NPs could be over 1 kg hr-1 easily. Here, the briefly synthesis procedure is described as the following. Commercial zinc powder (Alfa Aesar) with an average particle size of 10 μm with less than 50 ppm impurities of Cr, Fe and Pb were used as the raw material. In the plasma flame, the zinc powders subsequently undergo vaporization, oxidation and quench processes. Here the plasma-forming gas, carrier gas, and quenching gas are 50%Ar + 50%N2, N2, and Air +
N2, respectively.
36 3.1.3 Formation of TiO2 Nanoscale Materials
Through sol-gel growth in a basic solution, the scattered TiO2 NPs with ca. 100 nm
diameter were synthesized. Mixing 58.6g titanium isopropoxide with 290 mL distilled water yielded a colloidal suspension, which was then filtered and placed in an autoclave containing 20mL tetramethylammonium hydroxide (TMAH) at 250℃ for 12 hours. Finally, the solution in the autoclave was washed by DI water and centrifuged.
3.2 Preparation of dye-sensitized solar cell
The dye-sensitized solar cell is basically sandwiched together with the photoanode electrode (PE), electrolyte, and counter electrode (CE), shown in Fig. 3-2. The internal space of the PE and CE was separated by a hot-melting spacer, such as Surlyn, and was filled through a hole with an electrolyte solution. Finally, the hole was sealed with a cover glass (0.1 mm thickness) by using a hot-melt film or UV adhesive cured by OPAS RS-300. In this section, the preparations of the electrodes and the composition will be detail described.
37
Fig. 3-2. Configuration of the dye sensitized solar cells.
3.2.1 Photoanode electrode
ZnO photoanode electrode
Both for tetrapod-like ZnO (T-ZnO) and commercial ZnO (C-ZnO), the ZnO pastes for screen-printing were prepared typically by mixing ZnO powder, ethyl cellulose (EC), and terpineol, and the detailed procedure is as follows. EC (5–15 mPa s,#46070, Fluka) and EC (30–70 mPa s, #46080, Fluka) were dissolved in ethanol to yield 10 wt% solution, individually. 12g EC (5–15) and 12g EC (30–70) were added to a round bottomed rotavap flask containing 12g ZnO powders, and 25g terpineol. The mixture paste was dispersed in an ultrasonic bath. And a rotary-evaporator (BUCHI V850) is used to remove the ethanol and water in the mixture paste. Finally, the paste was made with a three-roll mill (EXAKT E50).
38
To prepare the ZnO photoanode electrode (PE), the NSG FTO glass used as current collector was first cleaned in a detergent solution using an ultrasonic bath for 15 min, and then rinsed with water and ethanol. After UV-O3 treatment for 20 min, a layer of
ZnO paste with 0.238cm3 area was coated on the FTO glass by screen-printing without blocking layer on the substrate. And then, the substrate was kept in a clean box for 10 min so that the paste can relax to reduce the surface irregularity and then dried for 10 min at 90 °C. This screen-printing procedure with ZnO paste (coating, storing and drying) was repeated to get an appropriate thickness of 5 to 42 μm for the PE. The electrodes coated with the ZnO pastes were gradually heated under O2 flow as the
temperature evolution shown in Fig. 3-3, in order to remove the organic EC in the paste and neck the NPs.
39
After cooling to room temperature (RT), the ZnO PE was immersed into a solution made of 0.5 mM D149 organic sensitizer and 1 mM CDCA in AN/t-BuOH mixture (v/v = 1 : 1) at 65 °C for 30 min, and the PE was then rinsed with AN to remove excess dye molecular on it.
Flexible TiO2 photoanode electrode
Fig. 3-4. Sketch schemes of the electrophoretic cell, the preparation of TiO2 electrodes, and the
significant parameters in EPD process.
ITO/PEN substrates were cleaned with mild soap and ethanol, thoroughly rinsed with deionized water (18.2 MΩ), then dried by a clean air stream. In this part, electrophoretic deposition (EPD) was used to fabricate the flexible TiO2 photoanode
film on ITO/PEN substrate. The TiO2 suspension for EPD consisted of 0.25g TiO2 in
40
dispersed for 1.5 hrs before adding into the electrophoretic cell as shown in Fig. 3-4 (a). The two electrophoretic electrodes of fluorine-doped tine oxide (F:SnO2, FTO)
conductive glass, and ITO/PEN film were separated by 1.5 cm, and served as the cathode and anode electrode, respectively. The dispersed TiO2 NPs, that have
positive electric surface charge, are forced by an external electric field to overcome the gravity and the friction force, and deposited onto the ITO/PEN substrate. A Keithley 2400 Source Meter was applied as a power supply for different currents and deposition durations at the constant current mode which was more effective and controllable than the constant voltage mode [68]. After drying TiO2-deposited
ITO/PEN substrate at RT and one atmospheric pressure, high pressure treatment enhanced the photovoltaic performance of the device.
The EPD TiO2 PE was immersed in a solution of 0.5 mM N719 dye solution in
AN/t-BuOH (v/v=1:1) binary solvent at 40 oC for 4 hrs to adsorb sufficient N719 dye for light harvesting. To remove the remaining dye, the dye-sensitized photoanode was rinsed with AN, and dried under atmosphere condition at RT.
3.2.2 Electrolyte
The electrolyte plays an important role in the process of dye regeneration or the so-called hole-transport material (HTM). For different functions or optimization for
41
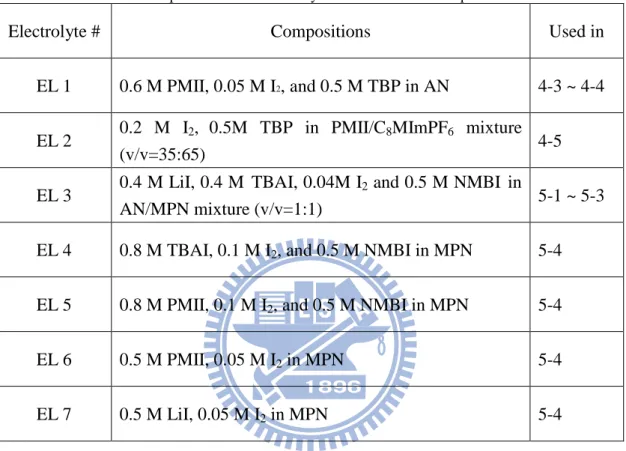
different cells, the composition of the electrolyte will be quite different. In this research, we used several electrolytes listed in Table 3-1.
Table 3-1. The compositions of the electrolytes used in different chapter of this thesis.
Electrolyte # Compositions Used in EL 1 0.6 M PMII, 0.05 M I2, and 0.5 M TBP in AN 4-3 ~ 4-4
EL 2 0.2 M I2, 0.5M TBP in PMII/C8MImPF6 mixture
(v/v=35:65) 4-5
EL 3 0.4 M LiI, 0.4 M TBAI, 0.04M I2 and 0.5 M NMBI in
AN/MPN mixture (v/v=1:1) 5-1 ~ 5-3 EL 4 0.8 M TBAI, 0.1 M I2, and 0.5 M NMBI in MPN 5-4
EL 5 0.8 M PMII, 0.1 M I2, and 0.5 M NMBI in MPN 5-4
EL 6 0.5 M PMII, 0.05 M I2 in MPN 5-4
EL 7 0.5 M LiI, 0.05 M I2 in MPN 5-4
3.2.3 Counter electrode
High-temperature process
To prepare the counter Pt-electrode, two holes (< 1 mm diameter) were drilled in the FTO glass by a drilling machine. The perforated substrate was washed in a detergent solution using an ultrasonic bath for 15 min, and then rinsed with water and ethanol. After removing residual organic contaminants by heating in air for 20 min at 400 °C, the Pt catalyst was deposited on the FTO glass by dip-coating with the H2PtCl6
42
solution (2 mg Pt in 1 ml IPA) with repetition of the heat treatment at 400 °C for 20 min.
Low-temperature process
The screen-printing paste prepared by dissolving H2PtCl6·6H2O (0.6, 1.2, and 1.8
w.t.%) in terpineol solution were screen-printed on the substrate using a 250 mesh screen and then dried at 60 °C for 20 min. Then the Pt ions on the electrodes were reduced by immersing it in 10mM NaBH4 aqueous solution at 40 °C. And the
reduced reaction is shown below. After 2 h, the electrodes were rinsed with distilled water and then dried at 60 °C for 20 min. Then, the UV-O3 post-treatment were
applied for 20 min:
. (3-1)
3.2.3 Sealing and additional materials
A sealing material prevents the leakage and the evaporation of the electrolyte solvent. Chemical stability and mechanical strength of the sealing material against the chemical components in the electrolyte and the cell-broken is required. Surlyn (Du Pont), a copolymer of ethylene and acrylic acid, meets the chemical requirements. For mechanical strength requirements, the additional UV-gel is used in this study.
![Table 1-1. Current uses and current potentials of selected renewable energy sources. [2]](https://thumb-ap.123doks.com/thumbv2/9libinfo/8531496.187245/20.892.155.767.765.959/table-current-current-potentials-selected-renewable-energy-sources.webp)
![Fig. 2-4. Solar irradiance spectrum above the atmosphere and at the surface. [59]](https://thumb-ap.123doks.com/thumbv2/9libinfo/8531496.187245/37.892.232.692.511.912/fig-solar-irradiance-spectrum-atmosphere-surface.webp)