中國醫藥大學機構典藏 China Medical University Repository, Taiwan:Item 310903500/32450
90
0
0
全文
(2) 致謝 兩年的研究所學習生涯,非醫管領域的我,因此接觸了醫管相關 知識,開闊了學習領域與視野,回顧這些學習的過程,有著許多嘗試、 突破與成長,而這些寶貴的經驗都將成為我人生中最珍貴的收藏,期 許自己未來能更精益求精,做為爾後研究工作的開端,並持之以恆。 首先要感謝我的兩位指導教授:林正介院長及李采娟老師,因有他們 耐心及細心的予以解惑及煞費苦心指導,使我獲益良多,我心中只有 滿滿的感謝與愧疚,僅此致上最誠摯的謝意。口試期間承蒙中山醫學 大學邱政元老師及亞洲大學龔佩珍老師於百忙之中對我的論文深入 修正及指導,使本論文更加嚴謹及完整,在此致上最大的謝意。 再者,由衷感謝蔡文正所長及所上所有的老師,開闊了我的醫管 視野;感謝班上所有的同學,豐富了我的求學生涯;感謝醫事室所有 的學長姐提供我撰寫論文過程中所需的資料,謝謝親愛的佳霙姐姐、 幸玉寶貝、俊華學長及冠馨學姐、人豪弟弟、美慈、錢玲、懿諄、麗 娜、龍飛夫婦、黃俊傑、謝清弘、周祈宏等等。 最後感謝我的家人,我最親愛的爸爸、媽媽、虧欠最多的姐姐、 弟弟、俐明對我的關懷,謝謝爸媽的支持與付出、謝謝姐姐的包容與 鼓勵,謝謝我身邊所有的好友,七百多個日子來,非常感謝所有的師 長、同學、好友給予學業上的指導及心靈上的扶持,有你們的支持與 鼓勵,論文才得以順利完成,謝謝大家!我愛你們! 至宜. i. 謹誌. 2010.07.
(3) 中文摘要 研究目的:探討台灣 2000 年至 2007 年間糖尿病及其併發症的盛行 率、發生率的時間趨勢;及利用時間趨勢分析評估 1997 年至 2007 年 間各項檢查的糖尿病病人的受檢率。 研究方法:利用健保資料庫之承保抽樣歸人檔定義糖尿病病人及糖 尿病病人的急性、小血管及大血管併發症,以及檢查項目。並利用 分層分析探討不同年齡、性別、納保金額和都市化程度下之盛行率 及發生率;羅吉斯迴歸分析糖尿病及其併發症及受檢率之時間趨勢 及其 95%信賴區間。受檢率則進一步利用線性迴歸分析比較加入「論 質計酬改善方案」實施前後受檢率的時間趨勢是否有顯著不同。 結果:第二型糖尿病的粗盛行率由 2000 年的 6.22% 上升至 2007 年 的 11.03%,其每兩年盛行率的調整勝算上升 14.6% [OR:1.146; 95% CI 1.142-1.149]。粗發生率則由 2000 年的 9.46 每千人年上升至 2005 的 10.96 每千人年,無顯著的時間趨勢。併發症其盛行每兩年 間的調整勝算比除了腎衰竭減少了 2%以外,其餘均呈上升的趨勢: 高血糖上升了 30%,酮酸中毒上升 15%,截肢上升 24%,視網膜病上 升 20%,腎臟病上升 6.6%,神經病上升 6%,心肌梗塞上升 52%,中 風上升 24%,慢性心臟病上升 20 % 及周邊動脈疾病上升 69%。實施 「論質計酬改善方案」之後,第二型糖尿病病人的受檢率在蛋白尿 肌酐酸比值、糖化血色素值、空腹血脂、血清麩胺酸丙酮酸轉胺基 脢及微量白蛋白在 2003- 2007 間有顯著的上升趨勢。 結論: 2000 年到 2007 年,台灣的第二型糖尿病盛行率持續上升, 其發生率則於 2000 年些微上升至 2005 年,而往後則上下波動直到 2007 年。糖尿病併發症的盛行率亦呈上升的趨勢,而發生率則呈反 向趨勢。糖尿病「論質計酬改善方案」是為了提高糖尿病照護品質的 ii.
(4) 給付政策,本研究亦發現在實施「論質計酬改善方案」之後,糖尿病 病人的受檢率有上升的趨勢。. 關鍵字:第二型糖尿病、併發症、照護品質、盛行率、發生率. iii.
(5) Abstract Aim The purpose of the this study is to determine the trends of prevalence and incidence of type 2 diabetes and its complications in Taiwan between 2000 and 2007, and to evaluate the trends of prevalence of laboratory tests of type 2 diabetes between 1997 and 2007. Methods Retrospective population-based study of 1,000,000 residents from Taiwan National Health Insurance Research Database (NHIRD) was used to identify patients with type 2 diabetes, those with diabetic complications and those with laboratory tests. Prevalence and incidence of type 2 diabetes were estimated according to various groups of age, gender, insurance premium and urbanization degree. Prevalence and incidence of complications in patients with type 2 diabetes were determined. Logistic regression model was used to estimate odds ratio and its 95% confidence interval (CI). Linear regression model was used to analyze whether the trends of prevalence of laboratory tests before (1997-2002) and after pay-for-performance (P4P) program (2003-2007) were different. Results The crude prevalence of type 2 diabetes increased from 6.22% to 11.03% between 2000 and 2007. In the population of age >=30 years, the multivariate-adjusted per 2 years increase in odds was 14.6% [OR: 1.146; 95% CI 1.142-1.149]. The crude incidence increased from 9.46 per 1000 in 2000 to 10.96 per 1000 in 2005 and then fluctuated until iv.
(6) 2007. Prevalence rate of renal failure in type 2 diabetic patients was declining, with a 2% decrease in odds in 2007. Prevalence odds of hypoglycemia, ketoacidosis, diabetes retinopathy, renal disease, neuropathy, amputation, MI, stroke, CHD and peripheral artery disease in type 2 diabetic patients increased, with 30%, 15%, 24%, 20%, 6.6%, 6% , 52%, 24%, 20% and 69% increase in odds for every 2-year period in 2007, respectively. After implementation of P4P, the prevalence of laboratory tests of type 2 diabetes in 2003 - 2007 increased significantly in ACR, HbA1C, fasting lipid profile, SGPT and microalbumin. Conclusions The prevalence of type 2 diabetes increased in Taiwan between 2000 and 2007. The incidence increased slightly in 2000-2005 and then fluctuated until 2007. The prevalence rates of diabetes-related complications continued to increase, but the incidence rates of most complications were decreasing. The P4P program for diabetes care in Taiwan was designed to increase the quality of care. The prevalence rates of laboratory tests for the period of after implementation of the P4P program were rising faster than those for the period of before implementation of the P4P program.. Key words: type 2 diabetes, complications, quality of care, prevalence, incidence. v.
(7) Tables of Contents 致謝........................................................................................................................... i 中文摘要.................................................................................................................. ii Abstract ................................................................................................................... iv Chapter 1 Introduction ............................................................................................. 1 1.1 Background ................................................................................................ 1 1.2 Study purposes ........................................................................................... 5 Chapter 2 Literature Review .................................................................................... 6 1.1 Definition of Diabetes ................................................................................ 6 2.2 Prevalence and incidence of diabetes in Taiwan ...................................... 10 2.3 Prevalence and incidence of complications in patients with type 2 diabetes .................................................................................................... 15 2.4 The importance of time trend studies....................................................... 20 2.5 Pay-for-Performance program for diabetes care in Taiwan ..................... 27 Chapter 3 Methodology ......................................................................................... 28 3.1 Conceptual framework of the study ......................................................... 28 3.2 Data sources ............................................................................................. 30 3.3 Study subjects .......................................................................................... 32 3.4 Measurements .......................................................................................... 33 3.5 Statistical analysis .................................................................................... 37 Chapter 4 Results ................................................................................................... 39 Chapter 5 Discussion ............................................................................................. 61 Chapter 6 Conclusion and Recommendations ....................................................... 67 6.1 Conclusion ............................................................................................... 67 6.2 Recommendations .................................................................................... 68 6.3 Research Limitations ............................................................................... 69 Chapter 7 Bibliographies ....................................................................................... 70 Appendix 1- ........................................................................................................... 76. vi.
(8) List of Tables Table 1 Criteria for Diagnosis of Diabetes by American Diabetes Association, World Health Organization, National Diabetes Education Program and International Diabetes Federation ............................................................. 9 Table 2 Previous studies estimated prevalence and/or incidence of type 2 diabetes in Taiwan, 1993-2010 ................................................................ 13 Table 3 Previous studies estimated prevalence and/or incidence of complications in patients with type 2 ...................................................... 18 Table 4 Previous studies of time trend in diabetes ................................................ 23 Table 5 The codes of items for physical assessment and laboratory tests ............ 36 Table 6 Prevalence and incidence rates of type 2 diabetes in Taiwan, 20002007 ......................................................................................................... 46 Table 7 Adjusted odds ratios of type 2 diabetes prevalence rates for sex, age, time, insurance premium and urbanization degree .................................. 48 Table 8 Adjusted odds ratios of type 2 diabetes incidence rates sex, age, time, insurance premium and urbanization degree ........................................... 49 Table 9 Prevalence cases, rates and trends of complications in patients with type 2 diabetes in Taiwan, 2000-2007 ..................................................... 50 Table 10 Incidence cases, rates and trends of complications in patients with type 2 diabetes in Taiwan, 2000-2007 ..................................................... 52 Table 11 Trends in prevalence of laboratory tests in patients with type 2 diabetes in 1997-2007 ............................................................................. 54 Table 12 Multivariate-adjusted ORs of prevalence laboratory tests in patients with type 2 diabetes for calendar year ..................................................... 59 Table 13 Multivariate linear regression model that examined whether the annual prevalence rates of laboratory tests were different during 1997-2002 and 2003-2007....................................................................... 60. vii.
(9) List of Figures Figure 1 Conceptual framework ........................................................................... 29 Figure 2 Trends in prevalence of type 2 diabetes stratified by age in females ..... 47 Figure 3 Trends in prevalence of type 2 diabetes stratified by age in males ........ 47. viii.
(10) Chapter 1 Introduction 1.1 Background World Health Organization (WHO) estimates that more than 220 million people worldwide have diabetes. This number is likely to more than double by 2030 without intervention (WHO, 2010). The prevalence of diabetes all over the world was increasing from 1995 to 2025 (King, et al., 1998), and the prevalence and incidence rates of diabetes increased in different age, gender and race groups (Riste, et al., 2001). The global prevalence of diabetes was 2.8% in 2000, projecting an increase to 4.8% in 2030. Total number of people with diabetes is projected to rise from 171 million in 2000 to 366 million in 2030 (Wild, et al., 2004). In a similar study, it indicated the world prevalence of diabetes among adults (aged 20–79 years) is 6.4% in 2010 and will increase to 7.7% by 2030 (Shaw, et al., 2010). Diabetes causes a heavy health-care burden worldwide and presents major challenges to patients and health-care systems (Ambady Ramachandran, 2010). Estimate of the global cost of diabetes accounts for 2-3% of the total health care budget in every country (Jonsson, 1998); An American study reported the total estimated cost of diabetes in 2007 was $174 billion, and the budget attributable to treatment in complications of diabetes accounts for 11% ("Economic costs of diabetes in the U.S. in 2007," 2008). Type 2 diabetes and its complications are leading causes of morbidity and premature mortality, imposing a heavy burden at the individual and societal level (Jonsson, 2002; Lipscombe, et al., 2007; 1.
(11) Wild, et al., 2004). The excess global mortality attributable to diabetes in the year 2000 was estimated to be 2.9 million deaths, equivalent to 5.2% of all deaths (Roglic, et al., 2005). The trend in mortality from diabetes is increasing in Taiwan (Tseng, et al., 2000). Based upon the data of leading causes of death in Taiwan during 1987-2009 from the Department of Health, Executive Yuan, R.O.C, it showed diabetes as a cause of death ranked as the 5th during 1987-2001, the 4th during 2002-2007, the 5th since 2008 (DOH, 2010). As lifestyle behaviors westernized, prevalence of type 2 diabetes has rapidly increased in Asian populations (WHO, 2004). Diabetes develops at a younger age in Asian populations than in western countries, and the morbidity and mortality associated with diabetes and its complications are also common in young Asian people (Ambady Ramachandran, 2010; Koopman, et al., 2005). In developing countries, the majority of people with diabetes are in the age range of 45–64 years. In the developed countries, the majority of people with diabetes aged 65 years and over (King, et al., 1998). In the Chinese population, type 2 diabetes has also become an important public health challenge, especially living in Taiwan, mainland China, Hong Kong, and Singapore, which accounts for at least one-fifth of the global population (Chang, et al., 2000; Gu, et al., 2003; Janus, et al., 2000; Wong, et al., 2006). With the westernization of diet behaviors, the prevalence and incidence of type 2 diabetes increased dramatically in Taiwan. In Taiwan, the studies estimated the prevalence of diabetes were limited. According to a systematic review study, it showed the prevalent rates of diabetes in Taiwan established between 1985 and 1996 were between 4.9 and 9.2% (Chang, et al., 2000). The prevalence of 2.
(12) diabetes increased with age and varied by gender, race, and ethnicity. The findings of Nutrition and Health Survey in Taiwan (NAHSIT) showed that the prevalence rates of type 2 diabetes estimated in the population aged 19-44, 45-64, >=65years were 0.6%, 11.4%, 22% in female and 1.1 %, 7 %, 7.2 % in male during 1993-1996, respectively (Chang, et al., 2002). And the findings of the second wave of NAHSIT showed the prevalence rates of type 2 diabetes in the corresponding age groups were less than 5%, more than 10%, 24.5% in female and less than 5%, more than 15%, 28.2% in male between 2005 and 2008, respectively. Regarding the incidence of type 2 diabetes in Taiwan, the overall 5-year incidences for men and women were 187.1 and 218.4 per 100,000 persons from 1992–1996, respectively (Tseng, et al., 2006). However, these estimates were based on relatively small population studies with limited nationwide representativeness or these estimates reflected the condition at least 10 years from now. Although a recent study evaluated annual prevalence and incidence of type 2 diabetes during 1999-2004, more recent data needed to be updated. Type 2 diabetes causes serious problems such as acute complications (including hypoglycemia and ketoacidosis), microvascular disease (including renal disease, retinopathy and neuropathy), and macrovascular disease (including amputation, myocardial infarction, stroke, and peripheral artery disease) (Braun, et al., 2009; Potluri, et al., 2009; Shera, et al., 2004). These complications and diabetes itself have already created significant burden to the health care system. To improve the quality of diabetes care, the pay-for-performance (P4P) program had been implemented by the DOH, Taiwan in November 2002. This resulted in increased 3.
(13) intensive monitoring and aggressive management of diabetes, which may have impact on diabetic complications. Studies investigating the prevalence and incidence rates of complications of type 2 diabetes were scarce. Most studies in Taiwan regarding complications of diabetes only focused on one or two complications of diabetes but not all of them. In addition, time trend analysis was not carried out to describe the prevalence and incidence of complications in patients with type 2 diabetes. This study conducts time trend analyses regarding the prevalence and incidence of all complications in type 2 diabetes during 2000-2007 in Taiwan based on Taiwan National Health Insurance Research Database (NHIRD).. 4.
(14) 1.2 Study purposes Using a random sample of nationwide dataset, the major goal of the present study is to describe the annual probability that general population have type 2 diabetes, annual probability that individuals without type 2 diabetes will develop type 2 diabetes, and annual prevalence of process and outcome measures for diabetes care in the Taiwan during 2000 to 2007. The specific objectives of this study are as follows: 1. To estimate annual prevalence and incidence rates of type 2 diabetes, and to describe their secular trends in different gender, age, insurance and urbanization degree during 2000-2007. 2. To estimate annual prevalence and incidence rates of complications in type 2 diabetes during 2000-2007. 3. To measure annual prevalence rates in laboratory tests, to describe their secular trends according to groups of different gender, age, insurance and urbanization degree during 1997-2007, and to examine the effect of Pay-for-performance (P4P) program on these secular trends.. 5.
(15) Chapter 2 Literature Review 1.1 Definition of Diabetes WHO describes diabetes as “a chronic disease that occurs when the body cannot effectively use the insulin it produces, or when the pancreas does not produce enough insulin.” Hyperglycaemia or raised blood sugar is a common effect of uncontrolled diabetes. Over time it leads to serious damage to many of the body's systems, especially the nerves and blood vessels (WHO, 2010). There are three types of diabetes, and they are as follows: 1. Type 1 diabetes (insulin-dependent, IDDM; or juvenile diabetes): Type 1 diabetes is a polygenic disease, and it is usually diagnosed in children and young adults. In type 1 diabetes, the body does not produce insulin. The subsequent lack of insulin leads to increased blood and urine glucose. The classical symptoms consist of polyuria (frequent urination), polydipsia (increased thirst), polyphagia (increased hunger), and weight loss result. Only 5-10% of people with diabetes have this form of the disease. 2. Type 2 diabetes (non-insulin-dependent diabetes mellitus, NIDDM; or adult-onset diabetes): In type 2 diabetes, either the body does not produce enough insulin or the cells ignore the insulin. It comprises 90% of people with diabetes around the world, and it is more common in the world, as well as the aged population. Symptoms may be similar to those of type 1 diabetes, but are often less marked. 6.
(16) 3. Gestational diabetes: Gestational diabetes is a condition in which women without previously diagnosed diabetes exhibit high blood glucose levels during pregnancy. The cause is unknown, but it is thought that some hormones from the placenta increase insulin resistance in the mother, causing elevated blood glucose levels. Gestational diabetes is most often diagnosed through prenatal screening, rather than symptoms. This study focuses on the type 2 diabetes. Thus, 4 criteria of diagnosing type 2 diabetes proposed by four associations were introduced (Table 1). First, American Diabetes Association (ADA) recommended 4 tests for diagnosing diabetes (ADA, 2010): (1) diabetes symptoms: polyuria, polydipsia, polyphagia, increased fatigue, weight loss, blurred vision and casual plasma glucose 200 mg/dl (or 11.1 mmol/l), casual is defined as any time of day without regard to time since last meal or (2) fasting plasma glucose (FPG) >126 mg/dl (or 7.0 mmol/l) or (3) plasma glucose 200 mg/dl (or 11.1 mmol/l) during an oral glucose tolerance test (OGTT). If any of these test results occur, testing should be repeated on a different day to confirm the diagnosis. Second, WHO recommended for 2 tests diagnosing diabetes (WHO, 2006): (1) FPG ≥7.0mmol/l (or 126mg/dl) or (2) 2-h plasma glucose ≥ 11.1mmol/l (or 200 mg/dl), one of the above should exit. Third, National diabetes education program (NDEP) recommended 2 tests for diagnosing diabetes (NDEP, 2010): (1) A1C ≥ 6.5% or (2) FPG > 126 mg/dl or (3) 2-hr plasma glucose > 200 mg/dl post 75g oral glucose challenge or (4) random plasma glucose > 200 mg/dl and the symptoms of type 2 diabetes include polyuria, polydypsia and unexplained weight loss. For criteria of (1) to (3), 7.
(17) repeat test to confirm unless symptoms are present. It is preferable that the same test be repeated for confirmation. If two different tests are used and both indicate diabetes, consider the diagnosis confirmed. If the two different tests are discordant, repeat the test above the diagnostic cut-point. Last, International Diabetes Federation (IDF) recommended two tests for diagnosing diabetes: (1) FPG>7.0 mmol/l (or >126 mg/dl) or (2) 2–h plasma glucose >11.1 mmol/l (or >200 mg/dl), one of the above should exist.. 8.
(18) Table 1 Criteria for Diagnosis of Type 2 Diabetes by American Diabetes Association, World Health Organization, National Diabetes Education Program and International Diabetes Federation American Diabetes Association. World Health Organization. ≧126mg/dl (7.0 mmol/l). ≧126mg/dl (7.0 mmol/l). Glycated hemoglobin (HbA1C) Fasting plasma glucose (FPG). National Diabetes Education Program 6.5% > 126mg/dl (7.0 mmol/l). Oral glucose tolerance 200 mg/dl test (OGTT) (11.1 mmol/l). > 200 mg/dl. Casual plasma glucose 200 mg/dl (11.1 mmol/l). > 200 mg/dl (11.1 mmol/l). > 126mg/dl (7.0 mmol/l). (11.1mmol/l). 9. 2-h plasma glucose. International Diabetes Federation. 200 mg/dl (11.1 mmol/l). > 200 mg/dl (11.1 mmol/l).
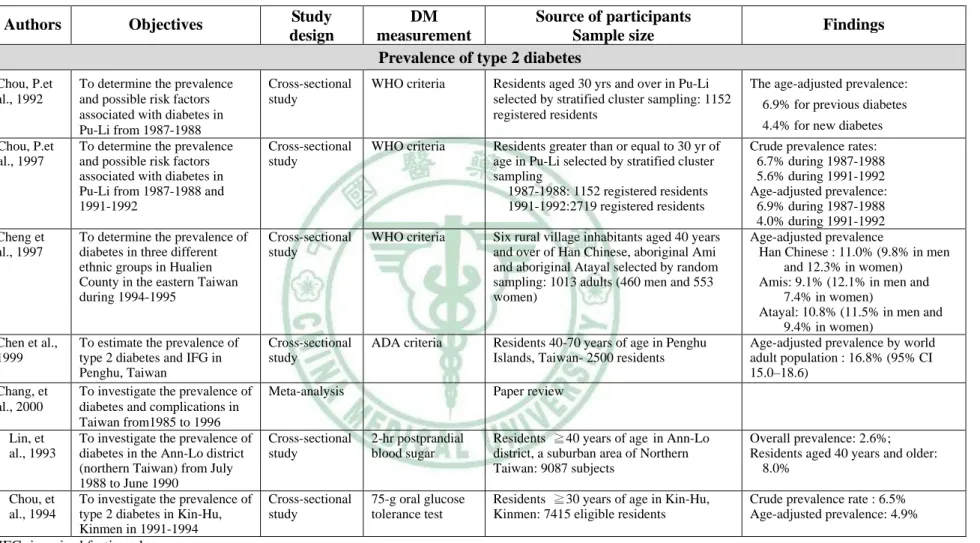
(19) 2.2 Prevalence and incidence of diabetes in Taiwan After thorough reviewing literature, a total of 14 articles estimating prevalence or incidence of type 2 diabetes in Taiwan had been reported (Table 2). Among them, a total of 10 studies, including a meta-analysis, reported prevalence rates whereas a total of 4 studies estimated incidence rates. These prevalence estimates had been conducted in populations of Pu-Li during 1987-1988 (Chou, et al., 1992; Chou, et al., 1997), Hualien County during 1994-1995 ( Chen, et al., 1997), Ann-Lo during 1988-1990 ( Lin, et al., 1993), Kinmen during 1991-1994 (Chou, et al., 1994), Tainan in 1996 (Lu, et al., 1998) and Shonsun during 1996-1997 (Chen, et al., 2001). These studies had been conducted in various age groups, such as participants aged 20 years and over (Lu, et al., 1998), 30 years and over (Chou, et al., 1992; Chou, et al., 1997; Chou, et al., 1994), 40 old and over (Chen, et al., 1997; Lin, et al., 1993) and 50-79 years (K. T. Chen, et al., 2001). All of them were community-based studies with either random sampling or recruiting all eligible residents. The diabetes measurement used fasting glucose tolerance test ( Chen, et al., 2001; Wang, et al., 1997), 2-hr postprandial blood sugar ( Lin, et al., 1993), 75-g oral glucose tolerance test (Chou, et al., 1994; Lu, et al., 1998; Tseng, et al., 2000), WHO criteria (Chen, et al., 1997; Chou, et al., 1992; Chou, et al., 1997), ADA criteria (Chen, et al., 1999) and ICD-9-CM in outpatient and inpatient claim data (Chang, et al., 2010). The prevalence of diabetes was different according to age, gender and races. These studies conducted before 1990 reported crude prevalence rates ranged from 2.6% to 6.9% (Chou, et al., 1992; Lin, et al., 1993) and those after 1990 ranging from 5.6% to 11.0% (Chang, et al.,. 10.
(20) 2010; Chou, et al., 1997; Chou, et al., 1994; Lu, et al., 1998; Tseng, et al., 2006; Wang, et al., 1997). In studies comparing prevalence rates of various race groups, one reported age-adjusted prevalence during 1994-1995 for Han Chinese was 9.8% in men and 12.3% in women; for aboriginal groups was 11.5% in men and 8.5% in women (Chen, et al., 1997); the other reported the age-standardized prevalence during 1996-1997 for Hakaas was 17.9% in men and 15.5% in women; for Fukienese was 14.5% in men and 12.8% in women; for aborigines was 10.0% in men and 13.3% in women (Chen, et al., 2001). For incidence estimates, they had been determined in Chu- Dung and Pu-Tzu townships during 1993-1996 (Wang, et al., 1997), in Pu-Tai (Tseng, et al., 2000), in the entire Taiwan during 1992-1996 (Tseng, et al., 2006) and during 1999-2004 (Chang, 2010). All of these studies were community-based (Chang, et al.,2010; Tseng, et al., 2000; Tseng, et al., 2006; Wang, et al., 1997). The source of participants were 35-74 years (Wang, et al., 1997), ≧35 years (Tseng, et al., 2006). The diabetes status had been determined by FPG and self-report diabetic medication (Wang, et al., 1997), OGTT (Tseng, et al., 2000), self-report or ICD-9-CM in outpatient and inpatient claim data (Chang, et al., 2010). Two of these studies reported cumulative incidence and two reported incidence density. Two studies reporting cumulative incidence had been conducted in the same time period but they had different estimates. One reported a cumulative incidence of 9.8 per 1000 persons per year in men and 9.0 per 1000 persons per year in women during 1993-1996 (Wang, et al., 1997). The other reported a cumulative incidence of 1.871 per 1000 persons per year in men and 2.184 per 1000 persons per year in women (Tseng, et al., 2006). The other two studies reporting incidence density were different in their sample size. The one with small sample size 11.
(21) reported an overall incidence density rate of 27.4 per 1000 person-years (Tseng, et al., 2000), whereas the one with large sample size reported the age-standardized incidence density rate of approximately 7.6 per 1000 person-years in men and 7.7 to 6.9 per 1000 person-years in women during 1999-2004 (Chang, et al., 2010).. 12.
(22) Table 2 Previous studies estimated prevalence and/or incidence of type 2 diabetes in Taiwan, 1993-2010 ©. Authors. Objectives. Study design. (Chou, et al., 1992). DM Source of participants measurement Sample size Prevalence of type 2 diabetes. Findings. (Chou, et al., 1992). Chou, P.et al., 1992 ( C h o u ,. To determine the prevalence and possible risk factors associated with diabetes in Pu-Li from 1987-1988 To determine the prevalence and possible risk factors associated with diabetes in Pu-Li from 1987-1988 and 1991-1992. Cross-sectional study. Cross-sectional study. Cheng et al., 1997. To determine the prevalence of diabetes in three different ethnic groups in Hualien County in the eastern Taiwan during 1994-1995. Chen et al., 1999. To estimate the prevalence of type 2 diabetes and IFG in Penghu, Taiwan To investigate the prevalence of diabetes and complications in Taiwan from1985 to 1996 To investigate the prevalence of diabetes in the Ann-Lo district (northern Taiwan) from July 1988 to June 1990 To investigate the prevalence of type 2 diabetes in Kin-Hu, Kinmen in 1991-1994. Chou, P.et al., 1997. e t a l . , 1 9 9 7 ). ( H . D . C h e n , e t a l . , 1 9 9 7 ). 13 (K. T. Chen, et al., 1999). (C. Chang, et al., 2000). Chang, et al., 2000 ( J .. Lin, et al., 1993. D . L i n , e t a l . , 1 9 9 3 ). ( C h o u , e t a l . , 1 9 9 4 ). Chou, et al., 1994. IFG: impaired fasting glucose;. WHO criteria. Residents aged 30 yrs and over in Pu-Li selected by stratified cluster sampling: 1152 registered residents. The age-adjusted prevalence:. WHO criteria. Residents greater than or equal to 30 yr of age in Pu-Li selected by stratified cluster sampling 1987-1988: 1152 registered residents 1991-1992:2719 registered residents. Cross-sectional study. WHO criteria. Six rural village inhabitants aged 40 years and over of Han Chinese, aboriginal Ami and aboriginal Atayal selected by random sampling: 1013 adults (460 men and 553 women). Cross-sectional study. ADA criteria. Residents 40-70 years of age in Penghu Islands, Taiwan- 2500 residents. Crude prevalence rates: 6.7% during 1987-1988 5.6% during 1991-1992 Age-adjusted prevalence: 6.9% during 1987-1988 4.0% during 1991-1992 Age-adjusted prevalence Han Chinese : 11.0% (9.8% in men and 12.3% in women) Amis: 9.1% (12.1% in men and 7.4% in women) Atayal: 10.8% (11.5% in men and 9.4% in women) Age-adjusted prevalence by world adult population : 16.8% (95% CI 15.0–18.6). Meta-analysis. 6.9% for previous diabetes 4.4% for new diabetes. Paper review. Cross-sectional study. 2-hr postprandial blood sugar. Residents ≧40 years of age in Ann-Lo district, a suburban area of Northern Taiwan: 9087 subjects. Overall prevalence: 2.6%; Residents aged 40 years and older: 8.0%. Cross-sectional study. 75-g oral glucose tolerance test. Residents ≧30 years of age in Kin-Hu, Kinmen: 7415 eligible residents. Crude prevalence rate : 6.5% Age-adjusted prevalence: 4.9%.
(23) Table 2 Previous studies estimated prevalence and/or incidence of type 2 diabetes in Taiwan, 1993-2010 (Continued) ©. Study design. DM measurement. Source of participants Sample size. Authors. Objectives. Findings. Lu, et al., 1998. To investigate the prevalence of diabetes in southern Taiwan in 1996. Cross-sectional study. 75-g oral glucose tolerance test. Chen, et al., 2001. To compare the prevalence of diabetes in three racial groups in Taiwan from1996 to 1997. Cross-sectional study. Fasting plasma glucose. Chang, et al., 2010. To evaluate annual prevalence and incidence of type 2 diabetes and to examine possible trends among adults in Taiwan from1999 to 2004. Retrospective nationwide longitudinal study. ICD-9-CM diagnostic codes. Wang, et al., 1997. To determine type 2 diabetes incidence in Taiwan; The first survey: 1990-1993, The second survey: 1993-1996 To investigate the incidence of type 2 DM in Taiwan. Cohort Study. First survey : FPG; Second survey: diabetic medication Oral glucose tolerance test. Residents aged 35-74 years free from diabetes of two townships selected by random sampling (Chu-Dung and Pu-Tzu): 2190 subjects (995 men and 1195 women) Non-diabetic residents in Pu-Tai for a period of up to four years: 446 residents. Crude incidence rates: Men: 9.8 per 1000 per year Women: 9.0 per 1000 per year. Tseng, et al., 2006. To assess the yearly incidence of type 2 diabetes in Taiwan from1992 to 1996. Cohort study. To evaluate annual prevalence and incidence of type 2 diabetes and to examine possible trends among adults in Taiwan from1999 to 2004. Retrospective nationwide longitudinal study. Patients aged ≧35 years selected from Taiwan NHIRD, Population from household registration system Insurers aged ≧20 years from Taiwan NHIRD: 15,270,726-16,709,375 insurers. Incidences Men: 87.1 per 100,000 persons Women: 218.4 per 100,000 persons. Chang, et al., 2010. Telephone interviews of 93,484 diagnosed diabetic patients ICD-9-CM diagnostic codes. ( L u , e t a l . , 1 9 9 8 ). (K. T. Chen, et al., 2001). (C. H. Chang, 2010). Residents aged ≧20 years in Tainan city selected by stratified systematic cluster sampling: 1638 subjects (780 men and 858 women) Residents aged 50-79 years in three townships of Shonsun, Kuanhsi and Fushin selected by random sampling: 1293 persons (468 Hakaas, 440 Fukienese, and 385 Aborigines). 14. Insurers aged ≧20 years from Taiwan NHIRD: 15,270,726-16,709,375 insurers from 1999 to 2004. Crude prevalence :9.0% (10.3% men and 7.9% women) Age-adjusted prevalence: 9.2% 10.4% men and 8.1% women). Age-adjusted prevalence Hakaas: 17.9% in men and 15.5% in women Fukienese: 14.5% in men and 12.8% in women Aborigines: 10.0% in men and 13.3% in women The age-standardized prevalence Men: 4.7%-6.5% Women: 5.3%-6.6%. Incidence of type 2 diabetes ( W a n g , e t a l . , 1 9 9 7 ). (Tseng, et al., 2000). (Tseng , et al., 2006). (C. H. Chang, 2010). Tseng, et al., 2000. Cohort Study. NHIRD: National Health Insurance Research Database; FPG: fasting plasma glucose;. Incidence density rate: 27.4 per 1000 person years. Age-standardized incidence rates Men: 7.6 per 1000 person-years and then remain stable Women: 7.7 to 6.9 per 1000 person-years.
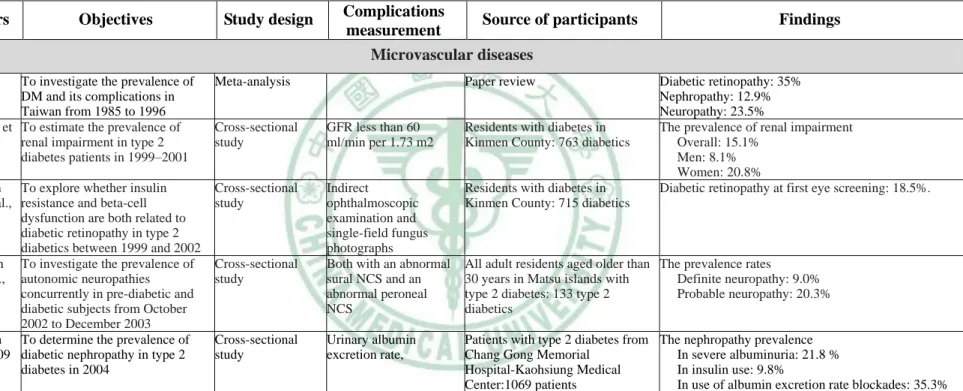
(24) 2.3 Prevalence and incidence of complications in patients with type 2 diabetes Type 2 diabetes is an important cause of complications (Lusignan, et al., 2005), the consequences of which include blindness, kidney damage, and foot ulcers that can result in amputation (IDF, 2010). Diabetic retinopathy is an important cause of blindness (Haik, et al., 1989), and it occurs as a result of long-term accumulated damage to the small blood vessels in the retina. After 15 years of diabetes, approximately 2% of people become blind, and about 10% develop severe visual impairment. Diabetes is among the leading causes of kidney failure and 10-20% of people with diabetes die of kidney failure. Diabetic neuropathy is damage to the nerves as a result of diabetes, and affects up to 50% of people with diabetes. Many different problems can occur as a result of diabetic neuropathy. Its common symptoms are tingling, pain, numbness, or weakness in the feet and hands. The overall risk of dying among people with diabetes is at least double the risk of their peers without diabetes (WHO, 2010). Diabetes increases the risk of heart disease and stroke, and 50% of people with diabetes die of cardiovascular disease, primarily heart disease and stroke. The studies investigating the prevalence and incidence of complications in type 2 diabetes can be divided into acute complications, microvascular diseases and macrovascular diseases (Fasanmade, et al., 2008; Kar, et al., 2008; Rosolova, et al., 2008). In Taiwan, the studies invested the prevalence and incidence of complications in type 2 diabetes (Table3). There were five and five articles, reporting prevalence and/or incidence of amicrovascular diseases, and macrovascular diseases, respectively.. 15.
(25) Ketoacidosis is an acute complication of diabetes. A retrospective cohort study analyzed the occurrence of diabetic ketoacidosis in Chinese adults from 1992 to 1997 and it showed 54.6% of type 2 diabetes had events of ketoacidosis (Yan, et al., 2000). Previous studies reporting the prevalence and incidence of the microvascular disease included diabetic retinopathy (Chang, et al., 2000; Tung, et al., 2007), renal disease (Chang, et al., 2000; Lin, et al., 2007; Shen, et al., 2009), neuropathy (Chang, et al., 2000; Hsu, et al., 2009). Among these studies, there were 5 studies estimating prevalence. However, these prevalence studies were based upon small size of samples and most of them were conducted in outlying islander. In Lin’s study, they estimated that the prevalence of renal impairment in patients with diabetes in Kinmen County in 1999-2001 was 15.1% ( Lin, et al., 2007); the prevalence of diabetic retinopathy in Kinmen County was 18.5% in 1999-2002 (Tung, et al., 2007); the prevalence of neuropathy in Mastu islanders with type 2 diabetes was 9.0% (Hsu, et al., 2009). The nephropathy prevalence was 21.8 % in severe albuminuria, 9.8% in insulin use and 35.3% in use of albumin excretion rate blockades in 2004 (Shen, et al., 2009). Previous studies reported prevalence or incidence of the macrovascular diseases included amputation (Chen, et al., 2006), myocardial infarction (Hsiao, et al., 2009), stroke (Hsiao, et al., 2009; Tseng, et al., 2000; Tseng, et al., 2005), coronary heart disease (Chang, et al., 2000) and peripheral artery disease (Chang, et al., 2000). Two of them reported prevalence of ischemic heart disease, stroke, leg vessel disease and large vessel disease and their prevalence rates were 15.8%, 0.4-11.8%, 1.7% and 20%, respectively (Chang, et al., 2000; Tseng, et al., 2005). In Chen’s study, they found the incidence density of non-traumatic 16.
(26) lower-extremity amputation for diabetic men and women were 4.103 and 3.170 per 1,000 patient-years from 1997 to 2002, respectively (Chen, et al., 2006). The estimated incidence that had been reported were 6-year cumulative incidence of 2.10% and 1.68% in hemorrhagic stroke for diabetic men and women (Chen, et al., 2009), of 12.71% and 8.89% in MI and 0.80 and 0.41 in stroke for patients with rosiglitazone monotherapy and pioglitazone monotherapy, respectively (Hsiao, et al., 2009).. 17.
(27) Table 3 Previous studies estimated prevalence and/or incidence of complications in patients with type 2 diabetes in Taiwan, 1992-2005 Authors. Authors. (C. Chang, et al., 2000). (C. H. Lin, et al., 2007). © © (Tung, et al.,. 2007). (Hsu, et al.,. 2009). (Shen, et al.,. 2009). Objectives. Chang et al., 2000. Study design. Complications Source of participants measurement Microvascular diseases. To investigate the prevalence of DM and its complications in Taiwan from 1985 to 1996 C-H Lin, et To estimate the prevalence of al., 2007 renal impairment in type 2 diabetes patients in 1999–2001. Meta-analysis Cross-sectional study. GFR less than 60 ml/min per 1.73 m2. Residents with diabetes in Kinmen County: 763 diabetics. Tao-Hsin To explore whether insulin Tung et al., resistance and beta-cell 2007 dysfunction are both related to diabetic retinopathy in type 2 diabetics between 1999 and 2002 Wei-Chih To investigate the prevalence of Hsu et al., autonomic neuropathies 2009 concurrently in pre-diabetic and diabetic subjects from October 2002 to December 2003 F-C Shen To determine the prevalence of et al., 2009 diabetic nephropathy in type 2 diabetes in 2004. Cross-sectional study. Indirect ophthalmoscopic examination and single-field fungus photographs Both with an abnormal sural NCS and an abnormal peroneal NCS. Residents with diabetes in Kinmen County: 715 diabetics. Urinary albumin excretion rate,. Patients with type 2 diabetes from The nephropathy prevalence Chang Gong Memorial In severe albuminuria: 21.8 % Hospital-Kaohsiung Medical In insulin use: 9.8% Center:1069 patients In use of albumin excretion rate blockades: 35.3%. Cross-sectional study. Cross-sectional study. NHIRD: National Health Insurance Research Database;. Paper review. Findings. Diabetic retinopathy: 35% Nephropathy: 12.9% Neuropathy: 23.5% The prevalence of renal impairment Overall: 15.1% Men: 8.1% Women: 20.8% Diabetic retinopathy at first eye screening: 18.5%.. All adult residents aged older than The prevalence rates 30 years in Matsu islands with Definite neuropathy: 9.0% type 2 diabetes: 133 type 2 Probable neuropathy: 20.3% diabetics.
(28) Table 3 Previous studies estimated prevalence and/or incidence of complications in patients with type 2 diabetes in Taiwan, 1992-2005 (Continued) Macrovascular diseases Autho rs. (C. Chang , et al., 2000). v. Authors. Objectives. Study design. Chang et al., 2000. To investigate the prevalence of DM and it complications in Taiwan from 1985 to 1996. Meta-analysis. C-H Tseng et al., 2005. To determine the prevalence for stroke in patients with Type 2 diabetes from 1995-1998. Cross-sectional study. (T seng, etal. H-F Chen To investigated the age- and Prospective study ,205 ) et al., sex-specific incidence density of 2006 lower-extremity amputation (LEA) of the diabetic population in Taiwan from 1997-2002 (H .F .C h en Prospective study ,eta H-F. Chen To explore the impact of gender l0.,2 et al., on incidence of hemorrhagic 9) 2009 and ischemic stroke among the diabetic population in Taiwan from 1997 to 2002. (H siao, etal F-Y Hsiao To investigate the association Retrospective .,20 9) et al., between oral cohort study 2009 antihyperglycaemics with MI and stroke from 2000 to 2005. NHIRD: National Health Insurance Research Database;. Complications measurement. Source of participants. Findings. Paper review. Leg vessel disease: 1.7% Large vessel disease: 20% Ischemic heart disease: 15.8% Stoke: 2.5% Diagnosis by a Insurers with type 2 diabetes Prevalence of stroke in type 2 diabetic physician or conform to aged 45 years and over from Women-< 45 years old: 0.4% the definition made by NHIRD: 12,531 type 2 diabetics 45–54 years old: 2.4% the WHO 55–64 years old: 5.1% ≥ 65 years old: 9.1% Men-< 45 years old: 1.4% 45–54 years old: 3.1% 55–64 years old: 7.0% ≥ 65 years old: 11.8% LEA (ICD-9: Insurers aged 30 years and over Estimated incidence density of non-traumatic LEA 84.1 ,84.10–84.18) with diabetes from Taiwan Men: 4.103 per 1,000 patient-years NHIRD: 500,868 diabetic patients Women: 3.170 per 1,000 patient-years Nontraumatic hemorrhagic stroke: ICD-9: 430–432) ischemic stroke: ICD-9: 433–438 MI: ICD-9:410 and 411); Stroke : ICD-9: 433 and 434. Insurers with type 2 diabetes aged 35 years and over from NHIRD: 500,868 diabetic patients. The 6-year cumulative incidence Hemorrhagic stroke-Men: 3.55%; Women: 2.83% Ischemic stroke-Men: 30.46%; Women: 30.06%. Insurers with type 2 diabetes aged 35 years and over from NHIRD: 473 483 with type 2 diabetes. MI incidence rates In rosiglitazone monotherapy: 12.71% In pioglitazone monotherapy: 8.89% Stroke incidence rates In rosiglitazone monotherapy: 0.80%; In pioglitazone monotherapy: 0.41%;.
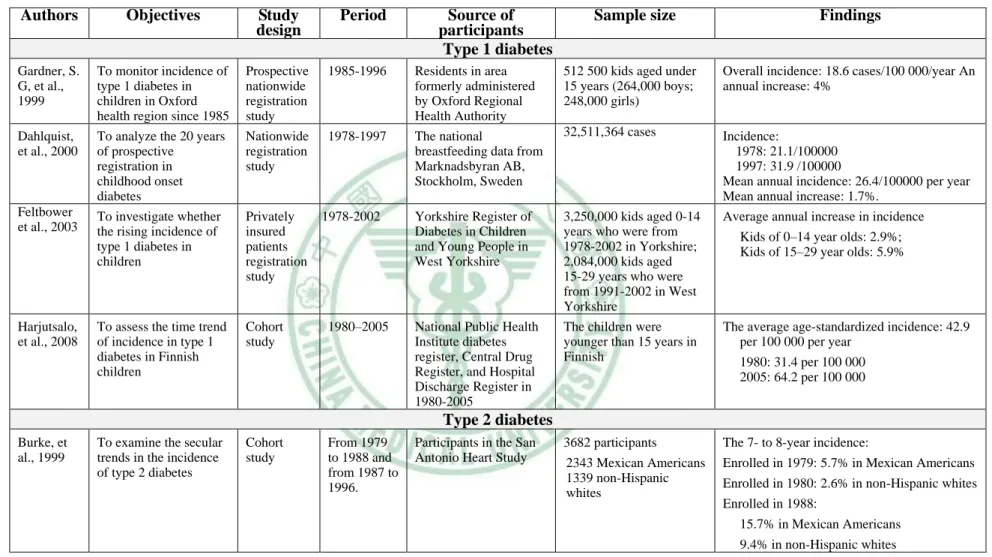
(29) 2.4 The importance of time trend studies Time trend is one of seven uses of epidemiology (Thomas, 2008). It is an important method in epidemiology, which studies past and future trend in human and illness from the rise and fall of disease and changes in their characters. From time trend study we can make useful projections into the future. Several previous studies have examined time trend of diabetes worldwide, and aggregating evidence across studies had shown that incidence (Burke, et al., 1999; Chang, 2010; Dahlquist, et al., 2000; Harjutsalo, et al., 2008; Ishak, et al., 2003; Jansson, et al., 2007; Lipscombe, et al., 2007; Tseng, et al., 2006) and prevalence (Chang, 2010; Cooper, et al., 2000; Jansson, et al., 2007; Lipscombe, et al., 2007; Lusignan, et al., 2005; Mokdad, et al., 2000) of diabetes were increasing annually. We had summarized some scholars who used time trends to describe the trends in prevalence and incidence of either type 1, type 2 or gestation diabetes after 1999 (Table 4). Among them, there were a total of 4 studies reporting type 1 diabetes, including those conducted in Oxford from 1985 to 1996 (Gardner, et al., 1997), in Sweden from 1978 to 1997 (Dahlquist, et al., 2000), in Yorkshire from 1978 to 2000 (Cohen, et al., 2003) and in Finnish from 1980 to 2005 (Harjutsalo, et al., 2008). Using nationwide registration data, an annual increase of 4% was reported from 1985 to 1996 in Oxford (Gardner, et al., 1997), a mean annual increase 1.7% from 1985 to 1996 was observed in Sweden (Dahlquist, et al., 2000), and an average annual increase of 2.9% and 5.9% was reported from 1978 to 2000 in kids aged 0-14 and 15-29 year olds in West Yorkshire (Cohen, et al., 2003). A cohort study in Finnish, including children who were younger than 15 years had an average age-standardized incidence from 31.4 to 64.2 per 100 000 persons per year from 1980 to 2005 (Harjutsalo, 20.
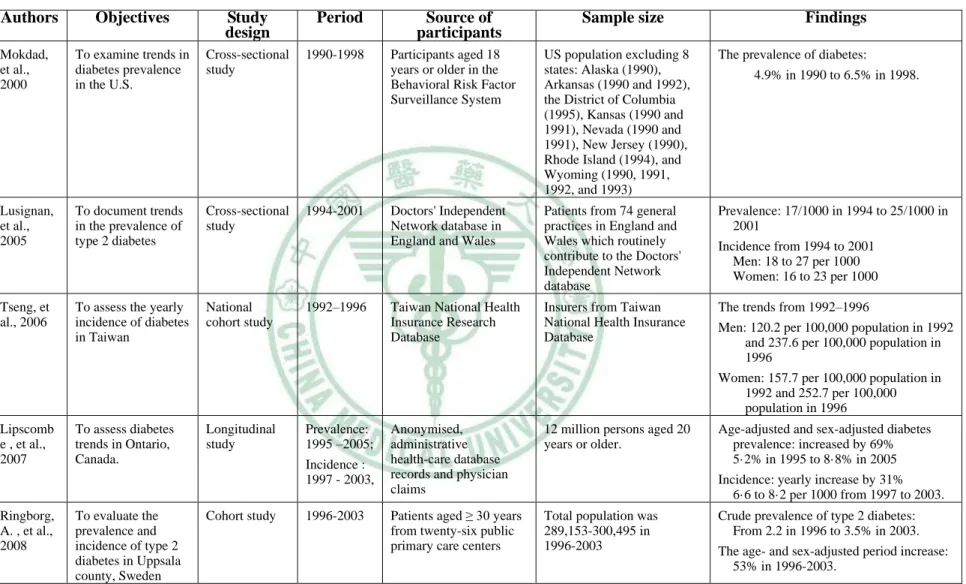
(30) et al., 2008). A total of 7 studies took advantage of time trends to describe trends of type 2 diabetes in San Antonio Heart Study between 1979 and 1996 (Burke, et al., 1999), in USA between 1990 and 1998 (Mokdad, et al., 2000), in England and Whales between 1994 and 2001 (Lusignan, et al., 2005), in Canada between 1997 and 2003 (Lipscombe, et al., 2007), in Sweden between 1997 and 2003 (Ringborg, et al., 2008) and in Taiwan between 1999 and 2004 (Chang, et al., 2010). Among these studies, there were 3 studies estimating prevalence, 2 studies estimating incidence and 2 studies estimating prevalence and incidence. In those studies reporting prevalence, an increase was observed from 4.9% in 1990 to 6.5% in 1998 in USA (Mokdad, et al., 2000), from 0.17% in 1994 to 0.25% in 2001 in England and Wales (Lusignan, et al., 2005), from 5.2% in 1995 to 8.8% in 2005 in Canada (Lipscombe, et al., 2007), from 2.2% in 1996 to 3.5% in 2003 in Sweden (Ringborg, et al., 2008), from 4.7% to 6.5% for men and from 5.3% to 6.6% for women in Taiwan between 1999 and 2004 (J. W. Chang, et al., 2010), age-standardized prevalence increased from 28.3 to 45 per 1,000 for women and 25.9 to 46.3 per 1,000 for men during 1972-1988 in Sweden (Jansson, et al., 2007). The findings of the San Antonio Heart Study reported 7- to 8-year incidence were 5.7%. in participants enrolled in 1979 and 15.7% in. participants enrolled in 1988 in Mexican Americans and 2.6% in participants enrolled in 1980 and 9.4% in participants enrolled in 1988 in non-Hispanic whites in 1979-1996 (Burke, et al., 1999). Similarly, an increase was observed form 1.2 per 1000 in 1992 to 2.4 per year in 1996 for men and from 1.6 per 1000 in 1992 to 2.6 per 1000 in 1996 for men in Taiwan (Tseng, et al., 2006); and from 6.6 in 1997 to 8.2 per 1000 in 2003 in Canada (Lipscombe, et al., 2007). On the contrary, the 21.
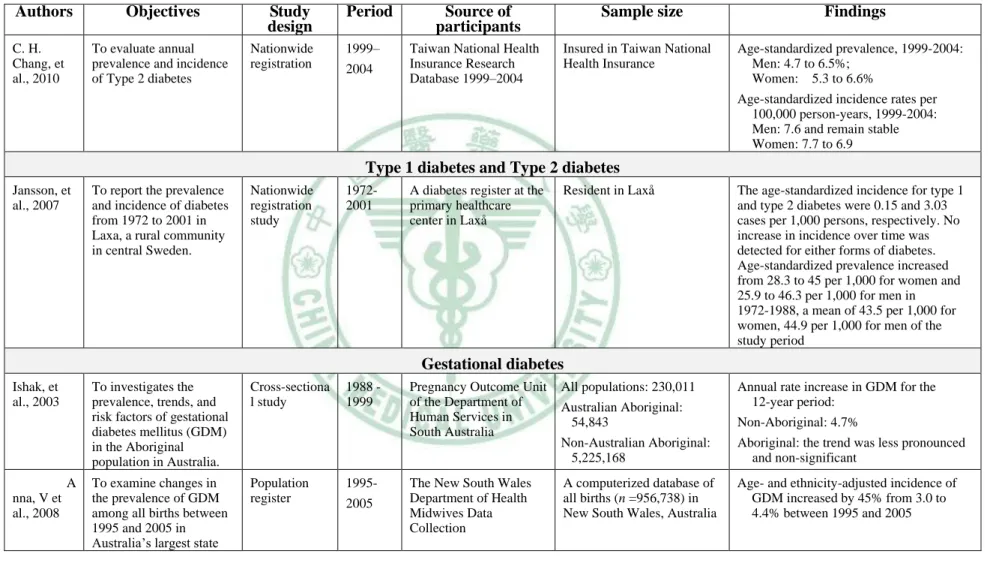
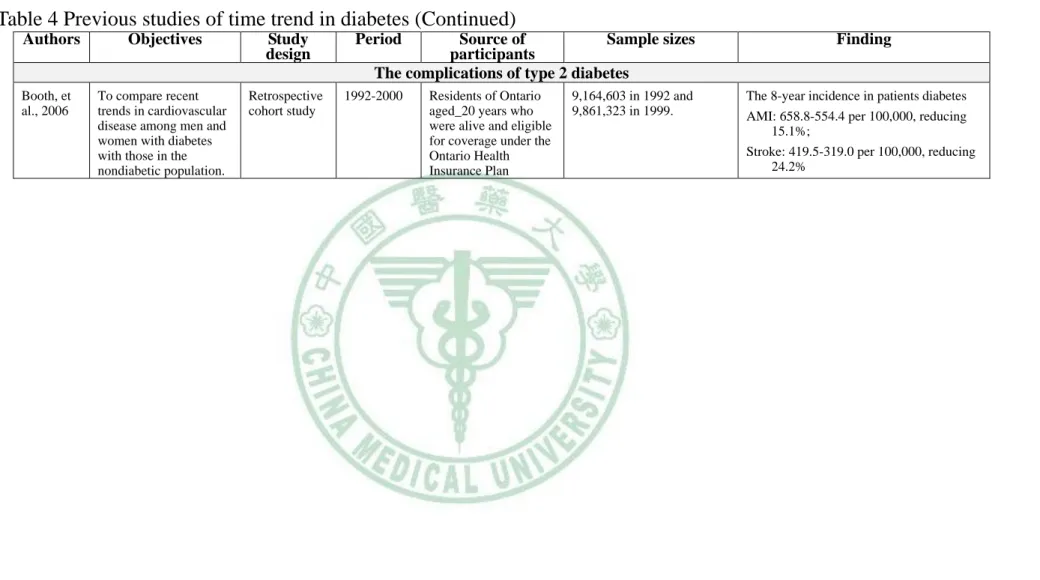
(31) age-adjusted incidence of type 2 diabetes was 7.6 per 1000 person-year in 1999 and remain stable for men, but decreased from 7.7 to 6.9 for women in Taiwan between 1999 and 2004 (Chang, et al., 2010). A total of 2 studies described trends of gestational diabetes. Those studies at the period of 1988–1999 showed annual rate increased by 4.7% for non-aboriginal population (Ishak, et al., 2003) and age- and ethnicity-adjusted incidence increased by 45% from 3.0% to 4.4% during 1995-2005 (Anna, et al., 2008). One study described trends of diabetic complications in Ontario. It reported over an 8-year period, the incidence rate of AMI were 6.6-5.5 per 1000 population reduce 15.1% and stroke were. 4.2-3.2 per 1000. population reduce 24.2% between 1992 and 2000 (Booth, et al., 2006).. 22.
(32) Table 4 Previous studies of time trend in diabetes Authors (G ardne r,et Gardner, S. al., 197) G, et al., 1999 (D ahlqu ist, Dahlquist, etal .,20 et al., 2000 0) (F eltbo w er,e Feltbower tal. et al., 2003 ,20 3). Objectives. Study design. To monitor incidence of type 1 diabetes in children in Oxford health region since 1985 To analyze the 20 years of prospective registration in childhood onset diabetes To investigate whether the rising incidence of type 1 diabetes in children. Prospective nationwide registration study Nationwide registration study. To assess the time trend of incidence in type 1 diabetes in Finnish children. Cohort study. Privately insured patients registration study. Period. 1985-1996. 1978-1997. 1978-2002. Source of participants Type 1 diabetes. (B urke, etal Burke, et .,19 9) al., 1999. 1980–2005. Findings. Residents in area formerly administered by Oxford Regional Health Authority The national breastfeeding data from Marknadsbyran AB, Stockholm, Sweden. 512 500 kids aged under 15 years (264,000 boys; 248,000 girls). Overall incidence: 18.6 cases/100 000/year An annual increase: 4%. 32,511,364 cases. Yorkshire Register of Diabetes in Children and Young People in West Yorkshire. 3,250,000 kids aged 0-14 years who were from 1978-2002 in Yorkshire; 2,084,000 kids aged 15-29 years who were from 1991-2002 in West Yorkshire The children were younger than 15 years in Finnish. Incidence: 1978: 21.1/100000 1997: 31.9 /100000 Mean annual incidence: 26.4/100000 per year Mean annual increase: 1.7%. Average annual increase in incidence. 23 (H arjut salo, Harjutsalo, etal .,20 et al., 2008 8). Sample size. National Public Health Institute diabetes register, Central Drug Register, and Hospital Discharge Register in 1980-2005. Kids of 0–14 year olds: 2.9%; Kids of 15–29 year olds: 5.9%. The average age-standardized incidence: 42.9 per 100 000 per year 1980: 31.4 per 100 000 2005: 64.2 per 100 000. Type 2 diabetes To examine the secular trends in the incidence of type 2 diabetes. Cohort study. From 1979 to 1988 and from 1987 to 1996.. Participants in the San Antonio Heart Study. 3682 participants. The 7- to 8-year incidence:. 2343 Mexican Americans 1339 non-Hispanic whites. Enrolled in 1979: 5.7% in Mexican Americans Enrolled in 1980: 2.6% in non-Hispanic whites Enrolled in 1988: 15.7% in Mexican Americans 9.4% in non-Hispanic whites.
(33) Table 4 Previous studies of time trend in diabetes (Continued) Authors. 24. Objectives. (M okdad ,et Mokdad, al., 200) et al., 2000. Study design. To examine trends in diabetes prevalence in the U.S.. Cross-sectional study. 1990-1998. (L usign an,e Lusignan, tal. ,20 et al., 5) 2005. To document trends in the prevalence of type 2 diabetes. Cross-sectional study. 1994-2001. To assess the yearly incidence of diabetes in Taiwan. National cohort study. (T seng, etal Tseng, et .,20 6) al., 2006. (L ipsco m be,e Lipscomb tal. ,20 e , et al., 7) 2007 (R ingbo rg,e Ringborg, tal. ,20 A. , et al., 8) 2008. Period. 1992–1996. Source of participants. Sample size. Findings. Participants aged 18 years or older in the Behavioral Risk Factor Surveillance System. US population excluding 8 states: Alaska (1990), Arkansas (1990 and 1992), the District of Columbia (1995), Kansas (1990 and 1991), Nevada (1990 and 1991), New Jersey (1990), Rhode Island (1994), and Wyoming (1990, 1991, 1992, and 1993). The prevalence of diabetes:. Doctors' Independent Network database in England and Wales. Patients from 74 general practices in England and Wales which routinely contribute to the Doctors' Independent Network database. Prevalence: 17/1000 in 1994 to 25/1000 in 2001. Taiwan National Health Insurance Research Database. Insurers from Taiwan National Health Insurance Database. The trends from 1992–1996. 4.9% in 1990 to 6.5% in 1998.. Incidence from 1994 to 2001 Men: 18 to 27 per 1000 Women: 16 to 23 per 1000. Men: 120.2 per 100,000 population in 1992 and 237.6 per 100,000 population in 1996 Women: 157.7 per 100,000 population in 1992 and 252.7 per 100,000 population in 1996. To assess diabetes trends in Ontario, Canada.. To evaluate the prevalence and incidence of type 2 diabetes in Uppsala county, Sweden. Longitudinal study. Prevalence: 1995 –2005; Incidence : 1997 - 2003,. Cohort study. 1996-2003. Anonymised, administrative health-care database records and physician claims. 12 million persons aged 20 years or older.. Patients aged ≥ 30 years from twenty-six public primary care centers. Total population was 289,153-300,495 in 1996-2003. Age-adjusted and sex-adjusted diabetes prevalence: increased by 69% 5·2% in 1995 to 8·8% in 2005 Incidence: yearly increase by 31% 6·6 to 8·2 per 1000 from 1997 to 2003. Crude prevalence of type 2 diabetes: From 2.2 in 1996 to 3.5% in 2003. The age- and sex-adjusted period increase: 53% in 1996-2003..
(34) Table 4 Previous studies of time trend in diabetes (Continued) Authors (C .H .C hang, C. H. 2010) Chang, et al., 2010. Objectives To evaluate annual prevalence and incidence of Type 2 diabetes. Study design Nationwide registration. Period 1999– 2004. Source of participants Taiwan National Health Insurance Research Database 1999–2004. Sample size Insured in Taiwan National Health Insurance. Findings Age-standardized prevalence, 1999-2004: Men: 4.7 to 6.5%; Women: 5.3 to 6.6% Age-standardized incidence rates per 100,000 person-years, 1999-2004: Men: 7.6 and remain stable Women: 7.7 to 6.9. (Jans on,e tal. Jansson, et ,20 7) al., 2007. Type 1 diabetes and Type 2 diabetes To report the prevalence and incidence of diabetes from 1972 to 2001 in Laxa, a rural community in central Sweden.. Nationwide registration study. 19722001. A diabetes register at the primary healthcare center in Laxå. Resident in Laxå. 25 (Isha k,et al., Ishak, et 203) al., 2003. (A na, 1.etl.,a2 A 08) nna, V et al., 2008. The age-standardized incidence for type 1 and type 2 diabetes were 0.15 and 3.03 cases per 1,000 persons, respectively. No increase in incidence over time was detected for either forms of diabetes. Age-standardized prevalence increased from 28.3 to 45 per 1,000 for women and 25.9 to 46.3 per 1,000 for men in 1972-1988, a mean of 43.5 per 1,000 for women, 44.9 per 1,000 for men of the study period. Gestational diabetes To investigates the prevalence, trends, and risk factors of gestational diabetes mellitus (GDM) in the Aboriginal population in Australia.. Cross-sectiona l study. To examine changes in the prevalence of GDM among all births between 1995 and 2005 in Australia’s largest state. Population register. 1988 1999. 19952005. Pregnancy Outcome Unit of the Department of Human Services in South Australia. All populations: 230,011. Non-Australian Aboriginal: 5,225,168. Aboriginal: the trend was less pronounced and non-significant. The New South Wales Department of Health Midwives Data Collection. A computerized database of all births (n =956,738) in New South Wales, Australia. Age- and ethnicity-adjusted incidence of GDM increased by 45% from 3.0 to 4.4% between 1995 and 2005. Australian Aboriginal: 54,843. Annual rate increase in GDM for the 12-year period: Non-Aboriginal: 4.7%.
(35) Table 4 Previous studies of time trend in diabetes (Continued) Authors (B oth, etal Booth, et .,20 6) al., 2006. Objectives. Study design. To compare recent trends in cardiovascular disease among men and women with diabetes with those in the nondiabetic population.. Retrospective cohort study. Period. Source of Sample sizes participants The complications of type 2 diabetes. 1992-2000. Residents of Ontario aged_20 years who were alive and eligible for coverage under the Ontario Health Insurance Plan. 9,164,603 in 1992 and 9,861,323 in 1999.. Finding. The 8-year incidence in patients diabetes AMI: 658.8-554.4 per 100,000, reducing 15.1%; Stroke: 419.5-319.0 per 100,000, reducing 24.2%. 26.
(36) 2.5 Pay-for-Performance program for diabetes care in Taiwan If diseases can be discovered in the early stages through testing and then be treated, the progression of disease can be significantly prevented. Also, certain chronic diseases or illnesses which required long-term treatment were controlled if patients take drugs under the doctor’s directions. Based on the concept of “buying health,” the Bureau of National Health Insurance (BNHI) had selected a few common diseases to be handled under P4P programs. Since November 2001, Taiwan’s universal health insurance system operated by the BNHI had implemented P4P programs for 5 diseases: breast cancer therapy, diabetes, asthma, chronic hepatitis B and hepatitis C, and hypertension (BNHI, 2010). This polices primarily focused on encouraging healthcare providers to raise the monitoring and follow-up care of patients (Lee, et al., 2010). The P4P program of NHI for diabetes care provides financial incentives for healthcare providers to increase exhaustive follow-up visits including self-care education, annual eye examinations and laboratory tests such as glycated hemoglobin A1C (HbA1C), FPG, fasting lipid profile, serum creatinine, glutamic-pyruvic transaminase (SGPT), microalbumin and urinalysis (Appendix 1).. 27.
(37) Chapter 3 Methodology 3.1 Conceptual framework of the study This section presents the conceptual framework of the study (Figure 1). The independent variables can be organized into 3 factors, including sociodemographic factors, insurance factors and P4P program. The sociodemographic factors consist of age and gender and insurance factors consist of insurance premium and urbanization degree of the township where an insurer insured his/her NHI program.. Sociodemographic factors Age Sex Insurance factors Insurance premium Urbanization degree. Pay-for-Performance program for diabetes care. The time trend during 2000-2007 1. Prevalence of type 2 diabetes 2. Incidence of type 2 diabetes 3. Healthcare outcome indicators Acute complications Hypoglycemia; Ketoacidosis Microvascular diseases Diabetic retinopathy; Renal disease; Renal failure; Neuropathy Macrovascular diseases Amputation; Myocardial infarction; Stroke; Coronary heart disease; Peripheral artery disease; The time trend during 1997-2007 Healthcare process indicators Lipid; HbA1C; SGPT; Ophthalmologic exam; Albumin/Urine creatinine ratio; Serum creatinine; Urinalysis. 28.
(38) Figure 1 Conceptual framework of the current study When the time trends of prevalence and incidence of type 2 diabetes and its complications during 2000-2007 are analyzed, sociodemographic and insurance factors are taken into account. In addition to sociodemographic and insurance factors, P4P program is considered when the time trends of healthcare process indicators are studied. The complications of type 2 diabetes are categorized into 3 classes: acute complication (hypoglycemia and ketoacidosis), microvascular diseases (diabetic retinopathy, renal disease, renal failure, and neuropathy), and macrovascular diseases (amputation, myocardial infarction, stroke, coronary heart disease, and peripheral artery disease). The healthcare process indicators consist of lipid profiles, HbA1C, SGPT, Ophthalmologic exam, albumin/urine creatinine ratio, serum creatinine, and urinalysis.. 29.
(39) 3.2 Data sources A nationwide health insurance program was launched by the Taiwanese government in March 1995 (Wen, et al., 2008). In 2007, 22.60 million of Taiwan’s 22.96 million persons were enrolled in this program (NHIRD, 2010). By the end of 2008, more than 99% of people in Taiwan were covered in the NHI program (Liu, et al., 2009), and the BNHI contracts with 97% of hospitals and 92% of clinics all over the nation (Department of Health, 2007). Registration and claim datasets of the years 1995-2007 were obtained from Taiwan National Health Insurance Research Database (NHIRD). Files of registry for beneficiaries, ambulatory care by visits, and inpatient care by admission were analyzed. The BNHI performs expert review on random samples of every 50–100 ambulatory and inpatient claims in each hospital and clinic quarterly, and false reports of diagnosis generate a severe penalty (Chen, et al., 2008) We used a random sample of 1,000,000 persons from 2005 in this study. All datasets can be interlinked through each individual personal identification number (PIN). Access to the NHI datasets was approved by the NHRI review committee. We used datasets of ambulatory care claims (1997–2007) and registry for beneficiaries (1997–2007) of the one million insurers, and all inpatient claims (1997–2007) for this study. The data elements of ambulatory care by visits included encounter form-based dataset with date, time of visit, patient demographics (identifier, gender, date of birth), medical facility visited, department visited, prescribing physician, dispensing pharmacist, 3 categories of disease codes, as defined by The International Classification of Diseases,. 30.
(40) Ninth Revision, Clinical Modification (ICD-9-CM) codes, and primary procedure such as drug or diagnostic procedure, etc.. 31.
(41) 3.3 Study subjects According to research purposes there were two study populations: one was for prevalence and incidence of type 2 diabetes, and the other was for prevalence and incidence of complications and items of laboratory tests for process measures of diabetes care quality. They were described as follows: The population for prevalence and incidence of type 2 diabetes consisted of one million individuals who were randomly selected in 2005 from 23 million insured people of Taiwan’s NHI program. The exclusion criteria were those who did not insure and who were younger than 30 years old. We defined the study population for each specific year. The population for prevalence and incidence of complications and items of laboratory tests for process measures of diabetes care quality consisted of those who have type 2 diabetes from the random sample of one million insured individuals. We searched the Taiwan NHIRD for the source population during 1997-2007 to identify who had at least 3 ambulatory claims or at least 1 inpatients claims with a diagnosis of ICD-9-CM codes 250, 2500, 25000, 25002, 2501, 25010, 2502, 25020, 2503, 25030, 2504, 25040, 2505, 25050, 2506, 25060, 2507, 25070, 2508, 25080, 2509 or 25090, or A-code A181 during the specific year period. The patients with diabetes who aged younger than 30 years, had gestation (ICD-9 code of 6480) or had type 1 diabetes (ICD code of 250.x1, 250.x3) were excluded in our study.. 32.
(42) 3.4 Measurements Sociodemographic factors and insurance factors Sociodemographic factors included age, gender and insurance premium. Age was categorized into 4 levels: 30-45, 46-60, 61-75 and >75 years. Gender was categorized into 2 levels: female and male. Insurance premium was categorized into 3 levels: dependent population, insurance premium less than its median value and insurance premium greater than or equal to its median value. The median values of insurance premium were 19,200 dollars in 1997-1999, 2001and 2003-2006; 19,400 dollars in 2000; 16,500 dollars in 2002 and 21,000 dollars in 2007. We adopted urbanization indicator, which was developed by Liu et al. (Liu, et al., 2006). It categorized 365 Taiwan townships into 7 degrees of urbanization corresponding to high density urban area, medium density urban area, newly developed area, general area, aging society area, rural area and non-developed area (seclusion area). The variables used in developing the townships stratification for urbanization level consisting of population density (people/km2), population ratio of people with college or above educational levels, population ratio of elder people over 65 years old, population ratio of people of agriculture workers and the number of physicians per 100,000 people, etc.. Definition of prevalence and incidence of type 2 diabetes The NHIRD was used to estimate rates of prevalence and incidence of clinically diagnosed type 2 diabetes patients between 2000 and 2007. Annual prevalence rates were estimated for groups of age, gender, insurance premium and urbanization degree by dividing the number of 33.
(43) prevalent cases of type 2 diabetes identified at the NHIRD by the total number of residents enrolled in NHIRD in a given year. Annual incidence rates of clinically diagnosed type 2 diabetes were estimated for the same groups by dividing the number of newly diagnosed type 2 diabetes by the total number of insured individuals who did not have type 2 diabetes at the beginning of the year in NHIRD. Annual incidence was expressed as per 1000 residents of the source population in a given year.. Prevalence and incidence of complications Prevalence and incidence rates of amputation (ICD-9 codes 841 and Surgical Procedures Codes 3925, 3929, 3959), myocardial infarction (MI) (A code A270 and CD-9 codes 410-412), stroke (A codes A290-A294, A299 and ICD-9 codes 4329, 431, 433-437), acute and chronic renal failure (A code A350 and ICD-9 codes 584-586, 588), coronary heart disease (CHD) (A code A27 and ICD-9 codes 140-414), renal disease (A code A350 and ICD-9 codes2504, 580-583, 585); diabetic retinopathy (A code A239 and ICD-9 codes 2505, 361, 366), neuropathy (A codes A22903, A22936 and ICD-9 codes 3572, 2506), peripheral artery disease (ICD-9 codes 2507); hypoglycemia (ICD-9 codes 2511, 2512) , ketoacidosis (ICD-9 codes 2501) were calculated using prevalent cases of type 2 diabetes with records of these complication for each specific year as numerator and all patients with type 2 diabetes for each specific year as denominator. Annual incidence rate of each complications was calculated using the number of new events identified in the NHIRD as numerator and the number of patients with type 2 diabetes and without history of the event on 1 January of the studied year as denominator. Rates were expressed as cases per 1000 patients. 34.
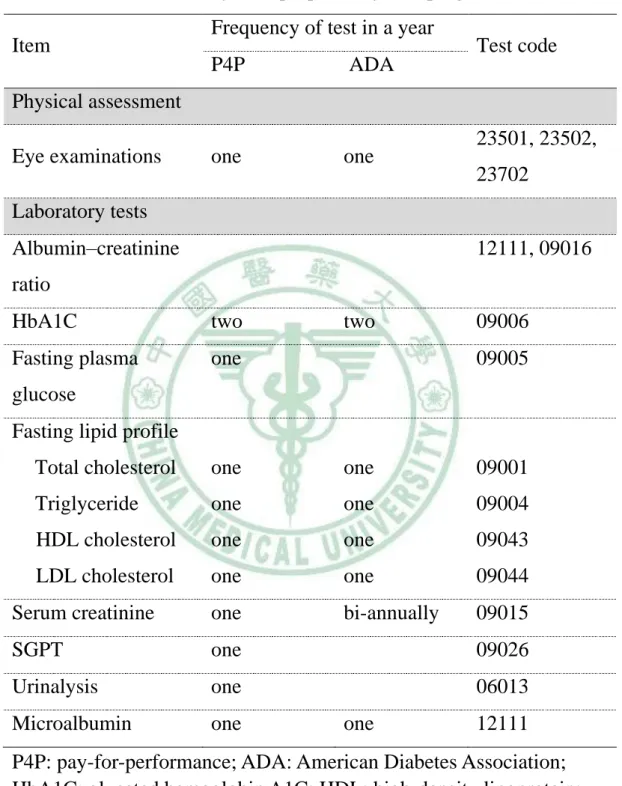
(44) Items of laboratory tests for process measures of diabetes care quality We adopted the items of the laboratory tests for process measures of diabetes care quality proposed by P4P program (BNHI, 2010) and ADA (ADA, 2010). Items of laboratory tests included albumin–creatinine ratio (ACR), HbA1C, fasting lipid profile, serum creatinine, SGPT, microalbumin and urinalysis. Fasting lipid profile consisted of total cholesterol (TC), triglyceride (TG), high-density lipoprotein (HDL), and low-density lipoprotein (LDL). Physical assessment only included ophthalmologic exam. The codes of items and frequency of test in a year for physical assessment and laboratory test proposed by P4P program and ADA are described in Table 5.. 35.
(45) Table 5 The codes of items and frequency of test in a year for physical assessment and laboratory tests proposed by P4P program and ADA Item. Frequency of test in a year P4P. ADA. one. one. Test code. Physical assessment Eye examinations. 23501, 23502, 23702. Laboratory tests Albumin–creatinine. 12111, 09016. ratio HbA1C. two. Fasting plasma. one. two. 09006 09005. glucose Fasting lipid profile Total cholesterol. one. one. 09001. Triglyceride. one. one. 09004. HDL cholesterol. one. one. 09043. LDL cholesterol. one. one. 09044. Serum creatinine. one. bi-annually. 09015. SGPT. one. 09026. Urinalysis. one. 06013. Microalbumin. one. one. 12111. P4P: pay-for-performance; ADA: American Diabetes Association; HbA1C: glycated hemoglobin A1C; HDL: high-density lipoprotein; LDL: low-density lipoprotein; SGPT: serum glutamic-pyruvic transaminase;. 36.
(46) 3.5 Statistical analysis Prevalence and incidence rates of type 2 diabetes and its complications and were adjusted through direct standardization method, which used the age-and gender-specific rates of each year and age and gender distributions of study population for year 2000. Multiple logistic regression models were used analyze trends in prevalence and incidence over time while controlling for changes in the underlying age, sex, insurance premium and urbanization degree distributions. The dependent variable was diabetes prevalence/incidence (case=1; non-case=0) and categorical predictor variables were entered for year (2000 as the reference), age group (31-45 years as the reference), sex (male as the reference), insurance premium (dependent population as the reference and urbanization degree (non-developed area as the reference). If there exists a time trend, rates of change in prevalence were analyzed by replacing the set of categorical variables for calendar year with a continuous variable defined as time (in years). In order to examine the interaction effects between age group and time, the term of age group variable multiplied by variable was added as covariates to investigate whether rates of change over time in prevalence or incidence differed across age groups. A statistically significant interaction effect between time and a given age group indicates that the rate of change in prevalence/incidence differs as compared with the reference age group (60-69 years). Liner regression model was used to analyze whether the trend of prevalence of laboratory tests before implementation of P4P program (1997-2002) and after implementation P4P program (2003-2007) was different. The dependent variable was prevalence rate of laboratory tests, 37.
(47) and the independent variables were year, period [before implementation of P4P program (1997-2002) =0; after implementation of P4P program (2003-2007) =1] and interaction term of year by period.. 38.
(48) Chapter 4 Results A total of 65,730 patients in the NHIRD were identified as prevalent cases between 2000 and 2007. The mean age of prevalent case during 2000-2007 was 62 with a SD of 12.5. The source population for which prevalence was estimated was 466,946 in 2000 and amounted to 595,854 in 2007 A 55% increase (from 6.2% to 11.0%) in the crude annual prevalence of type 2 diabetes took place during 2000-2007 (Table 6). After direct standardization of population of year 2000, the annual prevalence rates slightly decreased and discrepancy between crude and standardization annual prevalence rates increased as time elapsed. The annual prevalence rates were further stratified by age, gender, insurance premium and degree of urbanization, higher annual prevalence rates were observed in groups of older age, dependent population and aging society area. The annual prevalent rates increased from 6.48% to 10.75% for women and from 5.95% to 11.31% for men, and were higher in females before 2003 but they become lower since then. The number of annual incident cases of type 2 diabetes increased from 4,126 to 5,833 during 2000-2007 (Table 6). The mean age of incidence cases during 2000-2007 were 58.5 with a SD of 13. Crude annual incidence increased slightly from 9.46 per 1000 in 2000 to 10.96 per 1000 in 2004, but fluctuated a little since then. After direct standardization of population of year 2000, the annual incidence rates increased gradually during 2000-2004 and then fluctuated up and down after 2004. The annual incidence rates were further stratified by age, 39.
(49) gender, insurance premium and degree of urbanization, higher incidence rates were observed in groups of older age, male, dependent population and aging society area. Significant interactions in annual prevalence rate were observed between time and age groups for both gender (both <0.05) Figures 2 and 3. The annual rates of increase in the prevalence were largest in age group>75 years then next were age groups of 61-75 years, 46-60 years, and 31-45 years, accordingly. Annual prevalence increased by 90.91% (16.72%-31.92%) for females and 94.56% (13.78%-26.81%) for males in population aged 75 years and over, increased by 49.36% (18.07%-26.99%) for females and 68.85% (14.19%-23.96%) for males in the population aged 60-75 years, and 27.67% (7.48%-9.55%) for females and 59.19% (7.67%-12.21%) for males in the population aged 45-60 years, and 30.66% (1.37%-1.79%) for females and 69.94% (1.73%-2.94%) for males in the population aged 30-60 years during 2000-2007. After multivariate adjustment, the odds of increase in prevalence per 2 year was 14.6% [OR (95%CI) =1.146 (1.142-1.49)] (Table 7). As expected, prevalence of type 2 diabetes was significantly associated with age [5.02 (4.97-5.08), 12.26 (12.11-12.41), 13.80 (13.61-14.00) for age groups of 46-60, 61-75 and >75 years, respectively]. It was generally lower in females [0.96 (0.96-0.97)], in individuals with insurance premium <median [0.86 (0.85-0.87)], and ≧median, [0.78 (0.77-0.79)], but higher in individuals living at medium density urban area [1.07 (1.05-1.09)], general area [1.02 (1.00-1.04)] and aging society area [1.08 (1.05-1.11)]. There was no linear trend in annual incidence rate, instead it fluctuated up and down. Thus, when we regard time as an ordinal variable, it was not significant. The incidence rates in women were lower [0.86 40.
(50) (0.84-0.88)], and higher incidence rates were observed in groups of aged 61-75 [6.16 (5.97-6.36)], middle income [1.23 (1.19-1.27)] and aging society area [1.07 (0.98-1.53)] (Table 8). Table 9 showed the annual prevalence cases, rates and time trends of complications in patients with type 2 diabetes in Taiwan during 2000-2007. The complications of diabetes had been organized into 3 categories: acute complications, microvascular diseases and macrovascular diseases. For acute complications, the crude annual prevalence increased 226% (0.46%-1.05%) in hypoglycemia, 72% (1.86%-3.19%) in ketoacidosis. For microvascular diseases, the crude annual prevalence increased 82% (7.84%-14.28%) in diabetes retinopathy, 26% (20.32%-25.54%) in renal disease and 28% (17.52%-22.41%) in neuropathy, but the crude annual prevalence decreased 2% (11.05%-10.80%) in renal failure. For macrovascular diseases, the crude annual prevalence increased 126% (0.50%-1.13%) in amputation, 52% (3.76%-5.71%) in myocardial infarction, 24% (14.78%-18.34%) in stoke, 20% (23.31%-27.94%) in CHD and 69% (5.57%-9.42%) in peripheral artery disease. After direct standardization by population of year 2000, the annual prevalence rates of hypoglycemia, ketoacidosis, renal disease, amputation, myocardial infarction, stoke, CHD and peripheral artery disease were slightly increased and discrepancy between crude and standardization annual rates increased as time passed. Significant increase in odds of adjusted prevalence rates over all time were observed in all complications except renal failure with a significant decline. For acute complications such as hypoglycemia and ketoacidosis, the odds ratios and 95% CI for every 2-year increase were 1.30 (1.26-1.34) and 1.15 (1.13-1.17). For microvascular diseases, the odds ratios and 95% CI for every 2-year 41.
(51) increase were 1.20 (1.19-1.12) for diabetes retinopathy, 1.07 (1.06-1.07) for renal disease and 1.06 (1.05-1.07) for neuropathy of the study period. For macrovascular disease, the odds ratios and 95% CI for every 2-year increase were 1.24 (1.20-1.28) for amputation, 1.10 (1.09-1.12) for myocardial infarction, 1.033 (1.025-1.041) for stroke, 1.04 (1.03-1.05) for CHD and 1.67 (1.57-1.71) for peripheral artery disease (Table 9). Table 10 showed the annual incidence cases, rates and time trends of complications in patients with type 2 diabetes in Taiwan during 2000-2007. For acute complications, the crude annual incidence increased 91% (1.62-3.10 per 1000) in hypoglycemia and decreased 58% (7.59-3.20 per 1000) in ketoacidosis during 2000-2007. For microvascular diseases, the crude annual incidence during 2000-2007 decreased 6% (22.43-21.11 per 1000) in diabetes retinopathy, 45% (52.64-28.81 per 1000) in renal disease, 66% (67.75-23.17 per 1000) in neuropathy and increased 51% (8.18-12.38 per 1000 per year) in renal failure. For macrovascular diseases, the crude annual incidence during 2000-2007 decreased 2% (1.97-1.58 per 1000) in amputation, 9% (8.94-8.10 per 1000) in myocardial infarction, 25% (29.64-22.37 per 1000) in stoke, 35% (54.63-35.63 per 1000) in CHD and 58% (23.15-9.73 per 1000) in peripheral artery disease. After direct standardization of population at risk of year 2000, the annual incidence rates of hypoglycemia and renal failure become slight smaller than crude annual rates, but they still increased from 1.62 to 2.66 per 1000 and 8.18 to 11.45 per 1000 during 2000-2007, respectively. The annual incidence rates of complications remained decreasing from 7.59 to 8.20 per 1000 in ketoacidosis, from 52.64 to 28.81 per 1000 in renal disease, from 67.75 to 23.62 per 1000 in neuropathy, from 29.64 to 20.17 per 1000 in stoke, from 54.63 to 35.29 per 1000 in CHD and from 23.15 to 9.70 per 1000 in 42.
數據


+7
相關文件
2 Center for Theoretical Sciences and Center for Quantum Science and Engineering, National Taiwan University, Taipei 10617, Taiwan..
2 Center for Theoretical Sciences and Center for Quantum Science and Engineering, National Taiwan University, Taipei 10617, Taiwan..
HPM practice in Taiwan: A case study of HPM Tongxun (HPM Newsletter). These articles have documented the process of development and evolution of HPM practice in Taiwan as well
2 Department of Materials Science and Engineering, National Chung Hsing University, Taichung, Taiwan.. 3 Department of Materials Science and Engineering, National Tsing Hua
Department of Physics and Taiwan SPIN Research Center, National Changhua University of Education, Changhua, Taiwan. The mixed state is a special phenomenon that the magnetic field
Taiwan customer satisfaction index (TCSI) model shown in Figure 4-1, 4-2 and 4-3, developed by the National Quality Research Center of Taiwan at the Chunghua University in
Therefore, the focus of this research is to study the market structure of the tire companies in Taiwan rubber industry, discuss the issues of manufacturing, marketing and
After 1995, the competitive environment changed a lot in Taiwan, the cost of employee and land got higher and higher, the medium and small enterprises in Taiwan faced to
