In recent years, the growth rate of health care expenditure has been twice that of the gross domestic product in many countries, and the wide-spread utilization of high-tech medical care is one of the primary underlying reasons.1–3Since
the implementation of National Health Insurance (NHI) in 1995, Taiwan has been facing similar health insurance-associated problems as other countries, the most serious of which is that health care expenditure has been soaring.
Disease Patterns and Socioeconomic Status
Associated with Utilization of Computed
Tomography in Taiwan, 1997–2003
Pei-Tseng Kung,1Wen-Chen Tsai,2* Hsiao-Yun Hu3
Background/Purpose: The utilization of computed tomography (CT) has rapidly grown year after year.
Yet, literature that explores the factors related to CT utilization is limited. We attempted to determine the profiles of populations with high rates of CT usage, and to understand the association of disease patterns and socioeconomic status with CT-involved treatments.
Methods: National Health Insurance medical claim data from the cohort of 200,000 samples representing
23 million insured people during 1997–2003 were used for analysis. Multiple logistic regression analysis was performed to identify factors associated with CT usage.
Results: Annual growth rate in CT usage during 1997–2003 was 7.35% and average use of CT was 28.69 per
1000 people. The diseases associated with the highest CT usage rates were neoplasm (169 per 1000 people), diseases of the circulatory system (33 per 1000 people), and congenital malformations (20 per 1000 people). Disease patterns with high annual growth rate of CT usage were morbidities originating in the perinatal period (29.85%), mental disorders (15.47%), and other disease patterns without clear symptoms and diagnosis (13.33%). Individuals with lower salary used CT more frequently than those with higher salary. Multiple logistic regression analysis showed that cancer patients had significantly higher likelihood (odds ratio [OR], 7.71) of CT use than those with other diseases. Males (OR, 1.64) and elderly (OR, 1.96–7.05) had higher likelihoods of CT use and those with higher salaries had lower likelihood (OR, 0.50–0.89) of CT use.
Conclusion: Neoplasm, diseases of the circulatory system, congenital malformations, and poor
socioeco-nomic status were significantly associated with a higher rate of CT utilization. The distribution of disease patterns varied with gender, age groups, salary levels, and health care region’s household income levels. Further study is needed to better understand the nature of the findings. [J Formos Med Assoc 2008; 107(2):145–155]
Key Words: computed tomography, CT, disease patterns, high-tech equipment, socioeconomic status
©2008 Elsevier & Formosan Medical Association
. . . . 1Department of Healthcare Administration, Asia University, 2Department of Health Services Administration, China
Medical University, and 3Institute of Public Health, National Yang-Ming University, Taipei, Taiwan.
Received: May 31, 2007 Revised: July 27, 2007 Accepted: November 6, 2007
*Correspondence to: Dr Wen-Chen Tsai, Department of Health Services Administration,
China Medical University, 91 Hsueh-Shih Road, Taichung 404, Taiwan. E-mail: [email protected]
Clearly, there are many factors that contribute to the rise in health care expenditure, such as ex-panded insurance coverage, growth of the elderly population, increased aggressiveness in providing medical care, utilization of high-tech equipment, expensive treatment methods, increased preva-lence of chronic diseases, increased income, and economic fluctuations.4–10Among them, techno-logic advance is a key driver of health care spend-ing growth.11–15In recent years, the utilization of high-tech equipment has grown year after year. Focusing on the utilization of computed tomog-raphy (CT) in hospitals during 1998–2001 as an example, the annual growth rate of CT use in hospital outpatients was 4.47%. Expenses asso-ciated with CT use constituted up to 1% of the annual national health care expenditure in each of the 4 years.16
With increasingly intense competition in the health care market in recent years, providing high-tech medical equipment and high-technology has be-come one of the marketing strategies for many hospitals. It is therefore necessary for hospitals to boost the usage rate of such high-tech medical equipment and technology in order to recover the purchase costs. According to statistics of medical claims provided by the Bureau of NHI (BNHI), the expense of both CT and magnetic resonance imaging (MRI) was approximately NT$4.4 billion in 1999, and the growth rate was 17.71%, far ex-ceeding that of the total costs of national health care.17
High-tech equipment was introduced into Taiwan somewhat later than in many other de-veloped countries, but the availability of such equipment has increased at a staggering rate. It has been shown through statistics provided by the Department of Health (DOH) that the number of CT units approved increased from 175 to 495 be-tween 1992 and 2003, wherein the annual growth rate was 9.91%. In 2003, the number of CT units per million population was 21.9 in Taiwan, ranking third among the members of the Organization for Economic Cooperation and Development (OECD).18Prior research in the utilization of high-tech equipment focused mainly on health care
expenditure, without extensive and long-term investigations into the relevant factors that affect the use of CT.11,14,19The relevant factors that in-fluence CT utilization remain unknown. In gen-eral, there is a positive relationship between the availability of technology and health care expen-diture. People without health insurance coverage or who need a high deductible payment would have lower financial ability to use diagnostic im-aging due to its high cost. In publicly funded med-ical delivery systems, the utilization of medmed-ical care services should be equitable, irrespective of socioeconomic status (SES). A previous study in-dicated that the relative rate of diagnostic imag-ing utilization was higher for people with higher income.20 However, literature that explores the association between SES, disease patterns and CT utilization is limited. Previous studies did not specifically address patient characteristics and disease types with high CT usage. Is the relation-ship between SES and CT utilization under the Taiwan NHI different from that determined in previous studies?
This study aimed to explore the features of segments of the population with high CT usage and the associated disease patterns over a multi-year period, and to attempt to understand the association of SES with CT utilization under a comprehensive and universal national health insurance program.
Methods
Study population
To understand health care utilization by the 23 million insured in Taiwan, the BNHI used the Registry for Beneficiaries (RFB) to create a cohort of the sample population, sampling 200,000 par-ticipants from the entire insured population by carefully designed random sampling to form the RFB Sampling File (RFBSF), in which all individ-ual health care-related data (i.e. outpatient clinic visits, emergency department visits, hospitaliza-tions) were collected. The RFBSF is a representa-tive sample of the entire NHI-insured population
and forms a continuous profile of health care information, and is published by the BNHI. The purpose of the RFBSF is to provide current infor-mation about health care for NHI beneficiaries. There were no significant differences in the mean or distributions of age, gender, medical care expenses, and geography between the RFBSF samples and the entire 23 million NHI-insured population. Those insured who used CT in the RFBSF samples between 1997 and 2003 served as the subjects of research in the present study.
Data sources
The data collected in the present study are sec-ondary data; data regarding individual CT utiliza-tion were derived from NHI medical claims data. Patient profiles were derived from the RFBSF in 2003, and included gender, age, location of resi-dence, and monthly premium-based salary. The monthly premium of each insured person is based on 1 month’s salary and classified into eight dif-ferent levels (from NT$15,840 to NT$87,600). It means that individuals with higher monthly salaries would pay a higher monthly insurance premium, but based on a calculation with the salary capped at NT$87,600 before 2004. Spouses and minor children are provided coverage by the insured and are referred to as the insured depen-dants. The DOH divided the national geography according to medical care accessibility into 17 health care regions (HCRs). HCRs are the resi-dential areas in which the health care needs of residents can be conveniently met, and each HCR consists of approximately 20 townships in Taiwan. In the present study, the 17 HCRs were further divided into high- and low-income HCRs accord-ing to the average household income in Taiwan in 1997.18According to the ICD-9-CM, diseases were classified into 18 disease patterns. We used these 18 types of disease patterns to examine the diseases associated with CT utilization.
Statistical methods
The current study included descriptive and mul-tiple logistic regression analyses. Descriptive analy-sis was employed to understand the frequency of
CT usage as it pertained to every variable under scrutiny and the annual growth rate, and to com-pare the distribution of disease patterns among patients with different features and income who used CT. Trend analysis was also employed to examine variations in CT usage per 1000 people during the period between 1997 and 2003. If a person had multiple CT uses within a year, this study counted the multiple uses based on the type of disease patterns for CT use rate per 1000 people.
In order to understand the influence of disease patterns and income on CT utilization when per-sonal features were designated as the controlled factor, this study used the data of the RFBSF in 2003. Multiple logistic regression analysis was used to analyze the factors that influenced CT utilization, in which the presence of CT use was the dependent variable, and gender, age, monthly premium-based salary, type of disease, and living area’s (i.e. HCR’s) average household income were the independent variables.
Results
Descriptive statistical results
Between 1997 and 2003, the frequency of CT use per 1000 people significantly increased from 22.72 to 34.30 (p< 0.05), with a mean of 28.69, and an annual growth rate of 7.1% (Table 1). During the 7-year span, average CT usage among males (32.2‰) was higher than in females (25.0%); however, the 7-year growth rate of female usage (51.2%) was similar to that of males (51.1%). The frequency of CT usage increased with age. Specif-ically, average usage among those ≥ 61 years of age was 108.7 per 1000 people, but the annual growth rate for those ≥ 41 years of age was small (< 3%). The trend of annual increase was statis-tically significant in those aged ≤ 20 and those between 21 and 40 (p< 0.05).
With respect to monthly premium-based sal-ary (Table 1), the insured who had the highest level of CT usage (42.85) per 1000 were those who earned ≤ NT$15,840, which is the lowest
level. Individuals with higher 7-year growth rate were those who earned a premium-based salary ≥ NT$72,801 (224.1%) or NT$45,801–57,800 (122.5%). The average rate of CT usage per 1000 people was 40.15 in low-income HCRs, which was two times higher than that (20.08) in high-income HCRs. In addition, patients who had head CT scans decreased year by year, with an annual growth rate of –24.2% (Table 1).
As shown in Table 2, the top three diseases with the highest rate of CT usage were neoplasm, circulatory diseases, and congenital malformations, in which every 1000 neoplasm patients used
CT an average of 169.14 times annually, and the annual growth rate was 6.54%. Considering the annual growth rate of CT use, the top three dis-eases with the highest annual growth rates were morbidities originating in the perinatal period (29.9%), mental disorders (15.5%), and disease patterns without clear symptoms and diagnosis (13.3%). This study further examined CT utiliza-tion between 1997 and 2003 by trend analysis and found that the rate of CT utilization per 1000 people showed a significant increasing trend for mental disorders, disease patterns without clear diagnosis, skin and epidermal diseases, neoplasm,
Table 1. Frequency of CT utilization per 1000 people, 1997–2003*
7-yr Annual Trend
1997 1998 1999 2000 2001 2002 2003
average growth analysis rate%† p Frequency of use per 1000 22.72 26.72 29.36 27.02 28.12 32.56 34.30 28.69 7.11 0.005 Gender Female 20.03 22.42 24.76 23.61 25.11 28.90 30.30 25.02 7.14 < 0.001 Male 25.29 30.82 33.75 30.27 31.00 36.06 38.22 32.20 7.12 0.017 Age (yr) ≤ 20 5.30 6.47 7.34 6.19 6.72 7.51 7.77 6.76 6.59 0.033 21–40 10.45 11.92 13.08 12.21 12.09 13.70 15.00 12.64 6.22 0.013 41–60 33.36 36.59 39.20 33.58 35.35 38.73 39.49 36.61 2.85 0.194 ≥ 60 95.66 110.87 116.12 106.04 102.98 116.02 113.48 108.74 2.89 0.238 Premium-based salary (NT$) Insured dependants‡ 21.00 23.92 25.56 22.49 22.83 26.03 27.36 24.17 4.51 0.076 ≤ 15,840 34.13 41.19 44.97 40.18 41.32 45.90 52.25 42.85 7.36 0.023 15,841–22,800 24.59 30.22 33.03 33.08 34.30 41.27 42.34 34.12 9.48 < 0.001 22,801–28,800 16.29 16.65 17.73 18.93 19.53 21.09 24.53 19.25 7.06 < 0.001 28,801–36,300 14.42 13.26 21.05 14.77 15.35 20.00 20.24 17.01 5.81 0.159 36,301–45,800 15.50 18.14 19.93 16.98 22.25 24.57 24.37 20.25 7.83 0.006 45,801–57,800 9.68 14.31 17.89 15.78 16.20 18.31 21.54 16.24 14.26 0.010 57,801–72,800 16.87 19.02 21.78 17.18 19.02 26.07 24.51 20.64 6.42 0.059 ≥ 72,801 8.70 6.52 17.39 14.49 29.71 21.01 28.18 18.00 21.65 0.013
Average household income
High-income HCRs 16.50 19.67 21.48 18.42 19.33 22.59 22.56 20.08 5.35 0.054 Low-income HCRs 31.14 36.42 39.97 38.57 39.89 46.05 48.98 40.15 7.84 0.001 CT scan field
Head 15.90 8.72 8.01 4.11 3.05 2.64 3.01 6.49 −24.22 0.007
Part of body 984.10 991.28 991.99 995.89 996.95 997.36 996.99 993.51 0.22 0.007
*Frequency of CT use/1000 (sampled population in RFBSF each year); †annual growth rate = ; ‡insured dependants are spouses and children of the insured. HCR = health care regions.
and diseases of the urinary and reproductive systems (p< 0.05).
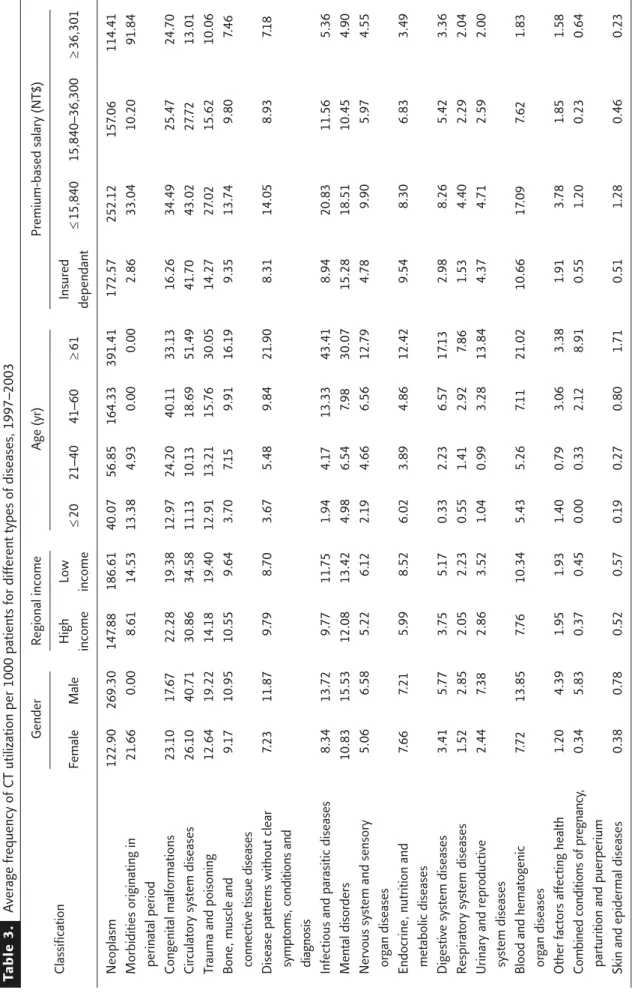
The difference in the disease patterns of CT users based on characteristics was also investigated (Table 3). It was found that the disease patterns with the highest CT use rates in males were neo-plasm (269.3‰), circulatory system diseases (40.7‰) and trauma and poisoning (19.2‰), and for females were neoplasm (122.9‰), circu-latory system diseases (26.1‰) and congenital malformations (23.1‰). By examining the cor-relations between HCRs with different incomes
and distribution of disease patterns, it was found that the highest CT utilization was for cancer (148 per 1000 in high-income HCRs, 186 per 1000 in low-income HCRs), and the second highest was for circulatory system diseases (31 per 1000 in high-income HCRs, 35 per 1000 in low-income HCRs). The third highest was for congenital mal-formations for high-income HCRs and trauma and poisoning for low-income HCRs.
The distribution of disease patterns varied with age group (Table 3). The most frequent disease patterns in CT usage per 1000 people for those
Table 2. CT utilization per 1000 people for different disease patterns, 1997–2003*
7-yr Annual Trend
1997 1998 1999 2000 2001 2002 2003
average growth analysis rate%† p Morbidities originating in 3.31 5.59 1.80 6.32 8.77 46.15 15.87 12.54 29.85 0.133
perinatal period
Mental disorders 7.97 8.51 11.49 11.95 13.11 18.03 18.90 12.85 15.47 < 0.001 Disease patterns without 6.17 6.73 8.88 7.81 9.68 11.47 13.08 9.12 13.33 < 0.001
clear symptoms, conditions, and diagnosis
Skin and epidermal diseases 0.44 0.43 0.54 0.43 0.48 0.76 0.77 0.55 9.70 0.029 Digestive system diseases 4.04 4.34 3.99 3.73 4.13 5.04 6.35 4.52 7.84 0.068 Neoplasm 133.84 153.68 167.02 178.06 171.54 184.20 195.68 169.14 6.54 0.001 Trauma and poisoning 14.92 16.53 15.30 14.04 14.92 21.53 20.46 16.81 5.41 0.091 Combined conditions of 0.26 0.26 0.52 0.00 1.22 0.31 0.33 0.41 4.08 0.662
pregnancy, parturition and puerperium
Respiratory system diseases 2.19 2.16 1.81 1.89 1.82 2.43 2.77 2.15 4.00 0.256 Urinary and reproductive 3.13 2.92 2.98 3.11 3.03 3.51 3.96 3.23 4.00 0.044
system diseases
Nervous system and sensory 5.07 5.89 5.66 6.04 5.15 6.27 6.00 5.73 2.84 0.246 organ diseases
Blood and hematogenic 8.26 9.61 10.17 9.62 10.80 7.16 9.30 9.27 2.00 0.877 organ diseases
Infectious and parasitic 10.12 10.74 13.81 9.06 9.78 11.18 11.34 10.86 1.92 0.956 diseases
Bone, muscle and connective 9.26 10.54 11.06 9.60 9.89 10.16 9.51 10.00 0.45 0.760 tissue diseases
Endocrine, nutrition and 7.09 7.34 9.29 6.43 7.10 7.56 7.21 7.43 0.29 0.797 metabolic diseases
Circulatory system diseases 32.41 33.94 35.29 32.91 30.11 34.11 32.53 33.04 0.06 0.652 Congenital malformations 18.83 19.19 27.70 17.56 18.30 26.72 16.06 20.62 −2.62 0.924 Other factors affecting health 2.72 3.00 1.73 1.55 0.90 1.73 1.84 1.92 −6.31 0.114
Table 3. A ver age fr equency of C T
utilization per 1000 patients for differ
ent types of diseases, 1997–2003
Gender R egional income Age (yr) Pr emium-based salary (NT$) Classification F emale Male High Low ≤ 20 21–40 41–60 ≥ 61 Insur ed ≤ 15,840 15,840–36,300 ≥ 36,301 income income dependant Neoplasm 122.90 269.30 147 .88 186.61 40.07 56.85 164.33 391 .41 172.57 252. 12 157 .06 114.41 Morbidities originating in 21 .66 0.00 8.61 14.53 13.38 4.93 0.00 0.00 2.86 33.04 10.20 91 .84
perinatal period Congenital malformations
23. 10 17 .67 22.28 19.38 12.97 24.20 40. 11 33. 13 16.26 34.49 25.47 24. 70 Cir
culatory system diseases
26. 10 40. 71 30.86 34.58 11 .1 3 10. 13 18.69 51 .49 41 .7 0 43.02 27 .7 2 13.01 Tr
auma and poisoning
12.64 19.22 14. 18 19.40 12.91 13.21 15. 76 30.05 14.27 27 .02 15.62 10.06
Bone, muscle and
9. 17 10.95 10.55 9.64 3. 70 7. 15 9.91 16. 19 9.35 13. 74 9.80 7.46
connective tissue diseases Disease patterns without clear
7.23 11 .87 9. 79 8. 70 3.67 5.48 9.84 21 .90 8.31 14.05 8.93 7. 18
symptoms, conditions and diagnosis Infectious and par
asitic diseases 8.34 13. 72 9. 77 11 .7 5 1 .94 4. 17 13.33 43.41 8.94 20.83 11 .56 5.36 Mental disor ders 10.83 15.53 12.08 13.42 4.98 6.54 7.98 30.07 15.28 18.51 10.45 4.90
Nervous system and sensory
5.06 6.58 5.22 6. 12 2. 19 4.66 6.56 12. 79 4. 78 9.90 5.97 4.55 or gan diseases
Endocrine, nutrition and
7.66 7.21 5.99 8.52 6.02 3.89 4.86 12.42 9.54 8.30 6.83 3.49
metabolic diseases Digestive system diseases
3.41 5. 77 3. 75 5. 17 0.33 2.23 6.57 17 .1 3 2.98 8.26 5.42 3.36 Respir
atory system diseases
1 .52 2.85 2.05 2.23 0.55 1 .41 2.92 7.86 1 .53 4.40 2.29 2.04 Urinary and r epr oductive 2.44 7.38 2.86 3.52 1 .04 0.99 3.28 13.84 4.37 4. 71 2.59 2.00
system diseases Blood and hematogenic
7. 72 13.85 7. 76 10.34 5.43 5.26 7. 11 21 .02 10.66 17 .09 7.62 1 .83 or gan diseases
Other factors affecting health
1 .20 4.39 1 .95 1 .93 1 .40 0. 79 3.06 3.38 1 .91 3. 78 1 .85 1 .58 Combined conditions of pr egnancy , 0.34 5.83 0.37 0.45 0.00 0.33 2. 12 8.91 0.55 1 .20 0.23 0.64
parturition and puerperium Skin and epidermal diseases
0.38 0. 78 0.52 0.57 0. 19 0.27 0.80 1 .71 0.51 1 .28 0.46 0.23
≤ 20 years of age over the 7 years were neoplasm (40.0‰) and morbidities originating in the perinatal period (13.4‰), while the most fre-quent disease patterns among people aged 21–40 and 41–60 years were neoplasm (56.9‰ and 164.3‰) and congenital malformations (24.2‰ and 40.1‰), and those for people aged ≥ 61 years were neoplasm (391.4‰) and circulatory system diseases (51.5‰).
Finally, the distribution of disease patterns for CT use among different premium-based salaries were compared (Table 3). It was found that the disease patterns of CT usage per 1000 people for in-sured dependants and individuals with premium-based salary≤ NT$15,840 or NT$15,841–36,300 were generally the same, in which the disease patterns with the highest CT use were neoplasm, circulatory system diseases and congenital mal-formations. The most frequent disease patterns on average among people with premium-based salary ≥ NT$36,301 were neoplasm, morbidities originating in the perinatal period, and congenital malformations.
Multiple logistic regression results
Multiple logistic regression analysis was used to understand the factors that affect CT utilization (Table 4). If other variables were controlled for, the likelihood of using CT by males was higher than by females, with an odds ratio (OR) of 1.64 (95% confidence interval [CI], 1.53–1.76). The older a person was, the greater the likelihood that he or she used CT. Compared to those aged ≤ 20 years, the ORs of CT use were 1.96, 3.30 and 7.05 for those aged 21–40, 41–60 and ≥ 61 years, respec-tively. With regard to income, all other premium-based salary groups had a lower likelihood (OR, 0.50–0.89) of using CT than the group with the lowest premium-based salary of ≤ NT$15,840 (p< 0.05).
With regard to disease patterns, when people had neoplasm, congenital malformations, infec-tious and parasitic diseases, disease patterns with-out clear symptoms and diagnosis, trauma and poisoning, endocrine, nutrition and metabolic diseases, blood and hematogenic organ diseases,
mental disorders, nervous and sensory organ dis-eases, circulatory system disdis-eases, or digestive system diseases, they had a greater likelihood of using CT. However, those with respiratory system diseases, combined conditions of pregnancy, par-turition and puerperium, or skin and epidermal diseases had a lower likelihood of using CT. The disease patterns that were associated with most frequent CT use were neoplasm (OR, 7.71; 95% CI, 7.13–8.34), congenital malformations (OR, 3.13; 95% CI, 2.40–4.08), mental disorders (OR, 1.97; 95% CI, 1.80–2.16), circulatory system dis-eases (OR, 1.95; 95% CI, 1.81–2.09), and other disease patterns without clear symptoms and di-agnosis (OR, 1.94; 95% CI, 1.82–2.08). Finally, since the observation period was yearly, we also used the dataset to perform logistic regression for the years 1997 to 2002, and the results were similar to those for 2003.
Discussion
The BNHI of Taiwan implemented a medical instruction notification system, which requested notification from hospitals within 24 hours of performing a medical service using high-tech in-struments such as CT or MRI. The implementation of the notification system resulted in a reduction in CT usage in 2000, but CT usage returned to previous levels between 2001 and 2003. Trend analysis showed that the average rate of CT use rose significantly each year between 1997 and 2003, indicating that strict scrutiny before and after a procedure was a diminishing effect on CT utiliza-tion control. Interestingly, the number of head CT scans significantly decreased each year, and the annual growth rate was –24.2%, which may be attributed to the policy of mandatory wearing of helmets while riding motorcycles that took effect in June 1997, and the corresponding large reduc-tion in head trauma cases.21
This study showed that the rate of CT use by males was significantly higher than that of females between 1997 and 2003, but the annual growth rate was very similar for both females and
males. The results are consistent with those of a previous study that showed greater CT utilization by men than by women (sex ratio M/F, 1.17).22 Another population-based study showed a positive
correlation between the proportion of females in the population and the increase in CT usage for the years 1998 to 2001,23which resulted from the growth rate being higher for females (11%)
Table 4. Multiple logistic regression analysis of CT utilization*
OR 95% CI Gender Female (reference) Male 1.642‡ 1.534 1.757 Age (yr) ≤ 20 (reference) 21–40 1.958‡ 1.687 2.272 41–60 3.297‡ 2.849 3.816 ≥ 61 7.047‡ 6.124 8.108
Average household income High-income HCRs (reference) Low-income HCRs 1.027 0.964 1.094 Premium-based salary (NT$) ≤ 15,840 (reference) Insured dependant 0.891§ 0.809 0.981 15,840–22,800 0.789§ 0.720 0.864 22,801–28,800 0.649‡ 0.540 0.779 28,801–36,300 0.564‡ 0.464 0.685 36,301–45,800 0.631‡ 0.531 0.749 45,801–57,800 0.547‡ 0.425 0.705 57,801–72,800 0.503‡ 0.380 0.664 ≥ 72,801 0.668‡ 0.488 0.914 Classification† Neoplasm 7.710‡ 7.132 8.335 Congenital malformations 3.127‡ 2.400 4.075 Mental disorders 1.972‡ 1.802 2.159
Circulatory system diseases 1.948‡ 1.813 2.092
Disease patterns without clear symptoms, conditions and diagnosis 1.944‡ 1.820 2.075
Trauma and poisoning 1.766‡ 1.657 1.882
Infectious and parasitic diseases 1.662‡ 1.551 1.781
Blood and hematogenic organ diseases 1.591‡ 1.310 1.933
Endocrine, nutrition and metabolic diseases 1.351‡ 1.249 1.462 Nervous system and sensory organ diseases 1.136‡ 1.065 1.211
Digestive system diseases 1.074‡ 1.005 1.147
Respiratory system diseases 0.831‡ 0.778 0.889
Combined conditions of pregnancy, parturition and puerperium 0.708§ 0.510 0.981
Skin and epidermal diseases 0.875‡ 0.817 0.937
Urinary and reproductive system diseases 1.029 0.952 1.112
Bone, muscle and connective tissue diseases 0.989 0.925 1.058 Morbidities originating in the perinatal period 2.508 0.962 6.538
*The dependent variable is whether CT was used or not (N = 4846 for CT use and N = 158,191 for no CT use; CT usage is used as event); †each disease type is divided into two groups: with and without the disease (people without the disease comprised the reference group); ‡p< 0.01; §p< 0.05. OR = odds ratio; CI = confidence interval; HCR = health care regions.
than for males (0.6%), although the rate of CT use by males was higher than that by females between 1998 and 2001. It was shown by further analysis that although the most frequent disease patterns leading to CT use by both males and females were neoplasm and circulatory system diseases, the use rate due to congenital malfor-mations and trauma and poisoning ranked the third for females and males respectively and varied greatly between males and females. Almost all CT use rates of diseases were higher for males than for females except for two diseases: congenital mal-formations and endocrine, nutrition and metabolic disease (morbidities originating in the perinatal period only for females).
This study demonstrated that the frequency of CT utilization increased with age. Nevertheless, it is noteworthy that those aged ≤20 years exhibited the highest annual growth rate of CT usage per 1000 people. According to the statistics of the DOH of Taiwan, accident-related trauma and suicide ranked first and third, respectively, as causes of death in teenagers aged 15–24 years, and accident-related trauma also ranked first for those aged 1–14 years.24CT is the most commonly used ex-amination following accidents, so common rea-sons for using CT by those under 20 years of age are trauma and poisoning. This implies that more effort is required to reduce childhood accidents.
With other variables controlled for, the current study showed that the likelihood of CT usage was not significantly relevant to whether a person was in a high- or low-income HCR, though there was a higher growth rate in the low-income HCRs. Because the cost of CT (without copayment) is paid by national health insurance, personal in-come is irrelevant to the financial burden of CT usage. The statistics of the DOH showed that the number of CT units increased by 189 between 1997 and 2003, with 123 units attributed to low-income HCRs.25 Therefore, the high growth in low-income HCRs may be attributed to increas-ing accessibility. However, after other variables were controlled for, it was found that premium-based salary was negatively correlated to CT usage. Further analysis of disease patterns found that
individuals with lower premium-based salaries have higher rate of CT usage for all disease pat-terns, especially for neoplasm, circulatory system diseases, trauma and poisoning, infectious and parasitic diseases, mental diseases, and blood and hematogenic organ diseases. This implies that individuals with lower income were more likely to use CT due to health problems. The proportion of the population with a premium-based salary ≤NT$15,840 is approximately 3–5% of the insured population; the government needs to pay more attention to the health status of this group. How-ever, the results of this study were inconsistent with that of a Canadian study that focused on an urban region and which indicated that higher diagnostic imaging utilization rates were associ-ated with higher SES for all levels of diagnostic imaging sophistication, including CT and MRI.20 Since both Canada and Taiwan have universal and comprehensive health insurance coverage, the cost of CT should not be a financial barrier to low-income people for accessing CT. The problem might be the difference in health status and disease patterns between higher-income and lower-income groups in both countries.
The most common disease patterns leading to CT use per 1000 people were neoplasm, circu-latory system diseases, and trauma and poison-ing. It is known from past studies that MRI can partially replace CT26–28and is particularly well-suited for the diagnosis of injuries involving mus-cles and bones.29The results herein showed that bone, muscle and connective tissue diseases con-tributed very little to the growth in CT usage, hence the extent to which MRI can replace CT is worthy of further research.
It is intriguing that the average annual growth rate of CT utilization in disease patterns without clear symptoms, conditions and diagnosis was very high. Because physicians place an emphasis on evidence-based medicine and strive to make medical plans and provide medical services to patients using currently available medical evi-dence, physicians might prefer to use CT exami-nation.30In order to improve the quality of health care, and because of the surging number of medical
malpractice cases, physicians may prefer to use high-tech equipment to reach an accurate diag-nosis so as to avoid unnecessary disputes. Whether or not that has led to a squandering of medical resources needs further investigation. The annual growth rate of CT usage for mental disorders was very high (15.5%). The number of people who seeked medical treatment for mental disorders in Taiwan was 1,591,667 in 1998 and 2,019,805 in 2004, with an annual growth rate of 4.1%.24 CT has become a common examination tool for mental disorders, and the growth in the number of patients with mental disorders is one of the reasons that CT usage has increased.
In summary, from the 7 years of observation data, under Taiwan’s comprehensive and univer-sal national health insurance, SES was found to have a strong correlation with CT-involved medical treatments. Disease patterns needing CT-involved treatments were similar among differ-ent personal characteristics but the use rates were quite different. Low SES and neoplasm, diseases of the circulatory system and congenital malfor-mations had significantly higher rates of CT uti-lization. Finally, there are some limitations to this study. Since the data source of the study was obtained from the RFB published by the BNHI, the real income of insured dependants is unknown, and the difference between premium-based salary and an individual’s real income was not ascer-tained in this study. The possibility exists that real income was somewhat underestimated. In addi-tion, since severity or morbidity level was one of the medical need factors that was not included in our analysis, it could be included in future study.
Acknowledgments
Financial support for this study was received from the National Science Council (grant no. NSC 95-2314-B-468-003) and China Medical University (grant no. CMU 93-HSMG-02). We are also grate-ful to the National Health Research Institute for providing the Taiwan National Health Insurance medical claims data for our analyses.
References
1. Hall FM. Over utilization of radiological examinations.
Radiology 1976;120:443–8.
2. OECD. OECD Health Data: A Software Package for the
International Comparison of Health Care Systems, version
1.01. Paris: OECD, 1991.
3. Lazaro P, Fitch K. The distribution of “Big Ticket” medical technologies in OECD counties. Int J Technol Assess
Health 1995;11:552–70.
4. Chang HJ, Huang SC, Chiang TP. Concentration of health care expenditures in Taiwan—analysis of patients’ char-acteristics. Taiwan J Public Health 2002;21:207–13. [In Chinese]
5. Chiang TL. Analysis on trends for healthcare expenditures in Taiwan. Taiwan J Public Health 2002;21:157–63. [In Chinese]
6. Tsai WC, Kung PT, Yaung CL, et al. The trend of utilizations of high-tech medical instruments in Taiwan, 1998–2001.
J Healthcare Manage 2005;6:446–60. [In Chinese]
7. Dormont B, Grignon M, Huber H. Health expenditure growth: reassessing the threat of ageing. Health Econ 2006;15:947–63.
8. Lubitz J. Health, technology, and medical care spending.
Health Aff (Millwood) 2005;24(Suppl 2):W5R81–5.
9. Bodenheimer T, Fernandez A. High and rising health care costs. Part 4: can costs be controlled while preserving quality? Ann Intern Med 2005;143:26–31.
10. Thorpe KE. The rise in health care spending and what to do about it: disease prevention/health promotion approaches are key to slowing the rise in health care spending. Health Aff 2005;246:1436–45.
11. Bodenheimer T. High and rising health care costs. Part 2: technologic innovation. Ann Intern Med 2005;142: 932–7.
12. Fuchs VR, Sox HC Jr. Physicians’ views of the relative importance of thirty medical innovations. Health Aff 2001; 20:30–42.
13. Slade EP, Anderson GF. The relationship between per capita income and diffusion of medical technologies. Health
Policy 2001;58:1–14.
14. Chernew ME, Hirth RA, Sonnad SS, et al. Managed care, medical technology, and health care cost growth: a review of the evidence. Med Care Res Rev 1998;55: 259, 289–97.
15. Gelijns A, Rosenberg N. The dynamics of technological change in medicine. Health Aff 1994;13:28–46. 16. Bureau of National Health Insurance. National Health
Insurance Research Database. Taipei: Taiwan Bureau of
National Health Insurance, 2000.
17. OECD. OECD Health Data, 2002. Available at: http:// www.oecd.org/topicstatsportal/ 0,2647,en_2825_495642_ 1_1_1_1_1,00.html
18. Directorate General of Budget, Accounting and Statistics.
Taiwan Area of the Republic of China. Taipei: Directorate
General of Budget, 1999.
19. Baker L, Birnbaum H, Geppert J, et al. The relationship between technology availability and health care spending.
Health Aff 2003;(Suppl Web Exclusives W3):537–51.
20. Demeter S, Reed M, Lix L, et al. Socioeconomic status and the utilization of diagnostic imaging in an urban setting. CMAJ 2005;173:1173–7.
21. Chou WS, Chen HT. Analysis on the effectiveness of motorcycle helmets in Taiwan. Police Science Q 1999; 29:185–201.
22. Midez B, Aroua A, Verdun FR, et al. CT utilization in Switzerland: frequency and secular trends. J Radiol 2006; 87:1057–62.
23. Kung PT, Tsai WC, Yaung CL, et al. Determinants of com-puted tomography and magnetic resonance imaging utiliza-tion in Taiwan. Int J Technol Assess Health Care 2005; 21:81–8.
24. Department of Health. Health and Vital Statistics. Taipei: Department of Health, 2005.
25. Department of Health. National Health Insurance Annual
Statistical Report. Taipei: Department of Health, 2005.
26. Peddecord KM, Janon EA, Robins JM. Use of MR imaging in an outpatient MRI center. AJR Am J Roentgenol 1987; 148:809–12.
27. Shy CG, Chen CC, Chen WH, et al. Comparison of CT with MRI for the evaluation of the juxta-oral tumor. Chin J Radiol 2003;28:1–8.
28. Cosnard G, Duprez T, Morcos L, et al. MRI of closed head injury. J Neuroradiol 2003;30:146–57.
29. Ladd SC, Zenge M, Antoch G, et al. Whole-body MR diagnostic concepts. Rofo 2006;178:763–70.
30. Sackett DL, Rosenberg MC, Gray JS, et al. Evidence based medicine: what it is and what it isn’t. It’s about integrating individual clinical expertise and the best external evidence.