國
立
交
通
大
學
交通運輸研究所
博
士
論
文
航空網路中航班延誤之因果模式
A Causal Model for Flight Delays in an
Airline Network
研 究 生:蔡世昌
指導教授:汪進財 博士
航空網路中航班延誤之因果模式
A Causal Model for Flight Delays in an
Airline Network
研 究 生:蔡世昌
Student:Shy-Chang Tsai
指導教授:汪進財 博士 Advisor:Dr. Jinn-Tsai Wong
國 立 交 通 大 學
交通運輸研究所
博 士 論 文
A Dissertation
Submitted to Institute of Traffic and Transportation College of Management
National Chiao Tung University in Partial Fulfillment of the Requirements
for the Degree of Doctor of Philosophy
in
Management
August 2012
Taipei, Taiwan, Republic of China
I
航空網路中航班延誤之因果模式
學生:蔡世昌 指導教授:汪進財 博士
國立交通大學交通運輸研究所
摘要
航班延誤由於會造成航空公司與旅客的不便和額外之成本,因此為一 值得關心之議題,本研究旨在針對航機於多機場間之延誤擴散及航空公司 之改善延誤的方法之效果提出分析方法。由於航班之地面與空中運作存在 隨機變化的特質,本研究分析航班之抵達與離開機場之延誤背後的因素, 以釐清航空公司之班表運作過程中各階段可能受到的干擾因子。 本研究利用一家台灣之航空公司的國內線航班資料,以 Cox 等比例危 險模式構建航班抵達與離開機場之延誤模式,本模式可顯示在航班運作過 程中之航班延誤擴散的形成。分析結果顯示,起飛之航班所受到的延誤因 素較多,相對而言,抵達機場的航班所受到的影響因素主要為氣候及航路 與擬降落機場的航管因素,因此,大部分抵達機場的航班之延誤除了起飛 機場已形成的延誤外,均非航空公司所能控制,隱含的意義為避免起飛機 場的延誤才是根本解決抵達延誤的有效方法。本研究所求出的危險比例可 用來衡量在不同情境下延誤的航班恢復正常運作的機會大小,並可分析個 別的延誤影響因子對於航空公司班表的可靠度之影響程度。 為減少航班延誤所造成的影響,航空公司無不積極投入地面與空中運 作的不確定性事件之預防工作,因此,本研究進一步利用所構建的航班抵 達與離開機場之延誤模式,分析航空公司所採取的改善延誤之方法的有效II 性,其中包括對於縮短地面作業時間及增加地面與空中運作的緩衝時間之 效果的評估,主要的作法為針對投入改善的成本和所減少的延誤之利益進 行淨效益的估算。 雖然增加緩衝時間可以減少一些航班的延誤時間,研究發現在考量到 緩衝時間的成本之情況下,這種改善延誤的作法對航空公司不一定有利, 研究結果並發現,在動態的運作環境中,增加緩衝時間不一定能大幅改善 航班的延誤狀況。因此,航空公司可能需要進一步分析真正影響航班延誤 的背後之主要因素,在採取許多複雜的改善方法之前,應該先有一套適切 的延誤管理計畫。本研究對於航空公司班表與航班延誤擴散之關係提供進 一步的了解,因此,對於班表運作的控制及延誤的管理有相當大的助益。 關鍵字:航班延誤擴散、存活分析、Cox 等比例危險模式、延誤成本
III
A Causal Model for Flight Delays in an
Airline Network
Student: Shy-Chang Tsai
Advisor: Dr. Jinn-Tsai Wong
Institute of Traffic and Transportation
National Chiao Tung University
Abstract
Flight delays are a source of great concern as they generate disruptions and increase costs for airlines and passengers. The aim of this research is to propose approaches to examine flight delay propagation in a multiple-airport environment and to evaluate the effectiveness of delay improvement schemes adopted by airlines. Due to the stochastic characteristics of turnaround and block operations, this research investigates the factors behind the mechanisms of departure and arrival delays to clarify the phases and activities involved in flight delays through an airline schedule.
The Cox proportional hazards model, a method widely applied in survival analysis, is used to develop departure and arrival delay models involving a Taiwanese domestic airline. The proposed models show how flight delay propagation can be formulated through repeated chain effects in aircraft rotations. The results shows that whilst outbound flights are subject to a wider range of difficulties leading to delays, inbound flights can be delayed by weather or air traffic control restrictions en-route or at destination airport. Hence, most arrival delays are beyond the control of airlines except for delays that develop at departure airports. This implies that developing the means to prevent departure delays could be the key to reducing arrival delays from the origin. The hazard ratios obtained provide measures of the chances of recovering from flight delays under a variety of situations and the effects that
IV
individual contributing factors of flight delays have on airline schedule reliability.
To manage flight delays, airlines are prepared for the unexpected stochastic events of turnaround and block operations. This research further uses the obtained departure and arrival delay models to examine delay improvement schemes, including shorting required ground handling time and increasing buffer time for turnaround and en-route aircraft. The costs of schemes and the savings of delay costs are investigated to evaluate the net benefits of schemes by recursively combining the departure and arrival delay models.
Though buffer time may save some delays, it is found that it may not be cost effective for airlines when the costs of buffer minutes are taken into account. The results also reveal that delays may not be greatly improved through this measure in the dynamic operating environment. Thus, airlines may investigate the significant contributing factors of delays and design a suitable delay management program before jumping into some sophisticated measures. The findings provide a better understanding of the relationship between planned schedules and delay propagation, and are thus useful for schedule control and delay management.
Keywords: Flight delay propagation, Survival analysis, Cox proportional hazards model, Delay costs
V
誌謝
進修博士學位一路走來要感謝的人實在太多,感謝諸多師長、學長姐、 同學、同事、好友的鼓勵與協助,學業才得以完成。 感謝恩師汪進財教授不論在研究觀念、邏輯思考及論文撰寫皆給予悉 心指導與斧正,使學生受益匪淺,僅此致上最深的敬意與謝忱。研究所修 課與論文研討,承蒙徐淵靜教授、黃承傳教授、黃台生教授、藍武王教授、 馮正民教授、許鉅秉教授、陳穆臻教授、邱裕鈞教授給予專業知識上的指 導與建議,對於我的課業學習與論文的進行有相當大的助益,感恩之情, 永難忘懷。論文口試時,承蒙顏上堯教授、顏進儒教授、周榮昌教授、陳 穆臻教授、邱裕鈞教授不吝指正,提供意見與建議,使本論文更臻完備, 在此致上誠摯之謝意。 在學期間,感謝文健學長、政棋學長、劍雲學姐、銘德學長、輝煌學 長、其華學長、益三學長、慧娟學姐、素如學姐、孟佑學長、國洲、日新、 易詩、昭宏、永祥、群明、文斌、士軒、彥斐、志偉的關心與鼓勵;同學 嘉惠、志誠、嘉新不斷相互切磋,以及同學彥蘅在我研究遇到瓶頸時陪我 一起努力,皆是無形之助力。 好友崇良、世賢、能博、明政提供許多寶貴的實務資料與建議,使論 文能夠順利完成及更具實用價值,感激之情,莫能言喻。同事凌鳳儀主任、 孫台興主任的提攜與照顧,在此特表謝意。 漫長的求學期間,爸媽和家人的體諒與支持,使我無後顧之憂,感謝 您們長期的付出與陪伴。最後,僅以此論文獻給我辭世的爸爸,以及所有 關心、鼓勵我的人。蔡世昌 謹誌
於交通大學交通運輸研究所
2012 年 8 月
VI
TABLE OF CONTENTS
中文摘要………... I ABSTRACT………...………...…………...…... III 誌謝………...………... V TABLE OF CONTENTS..………. VI LIST OF TABLES………... VIII LIST OF FIGURES……….... IXCHAPTER 1 INTRODUCTION……….….. 1
1.1 Background and Motivation………. 1
1.2 Research Objectives.………... 2
1.3 Research Scope…………..………... 3
1.4 Research Framework...……….. 3
CHAPTER 2 LITERATURE REVIEW………... 6
2.1 Types and Causes of Flight Delays………... 6
2.2 Assessment and Forecast of Flight Delays...………... 12
2.3 Control Measures of Flight Delays ……….. 15
2.4 System Costs of Flight Delays………. ………… 19
2.5 Concluding Remarks………... 23
CHAPTER 3 METHODOLOGY…..……… 25
3.1 Flight Delay Mechanisms……….………... 25
3.1.1 Departure Delay………. 26
3.1.2 Arrival Delay…….………... 28
3.2 Survival Analysis……….. 28
3.3 Delay Improvement Schemes….……...………... 31
3.3.1 Survival Distributions of Flight Delays….……… 31
3.3.2 Formulation of System Costs of Flight Delays….………... 32
VII
CHAPTER 4 EMPIRICAL STUDY………. 37
4.1 Basic Statistics ………. 37
4.2 Delay Modeling………... 53
4.3 Results of Delay Models………... 73
4.3.1 Departure Delay Model………... 73
4.3.2 Arrival Delay Model………... 75
4.4 Results of Delay Improvement Schemes………..………... 75
4.4.1 Before Delay Improvement……… 78
4.4.2 After Turnaround Operation Improvement…..……….. 80
4.4.3 After Turnaround and Block Operation Improvement……….. 83
CHAPTER 5 CONCLUSIONS AND SUGGESTIONS………... 87
5.1 Conclusions………... 87
5.2 Suggestions………... 90
REFERENCES………... 92
APPENDIX 1………... 96
VIII
LIST OF TABLES
Table 2.1 Causes of flight delays……….………. 11
Table 2.2 Elements of system costs……….. 20
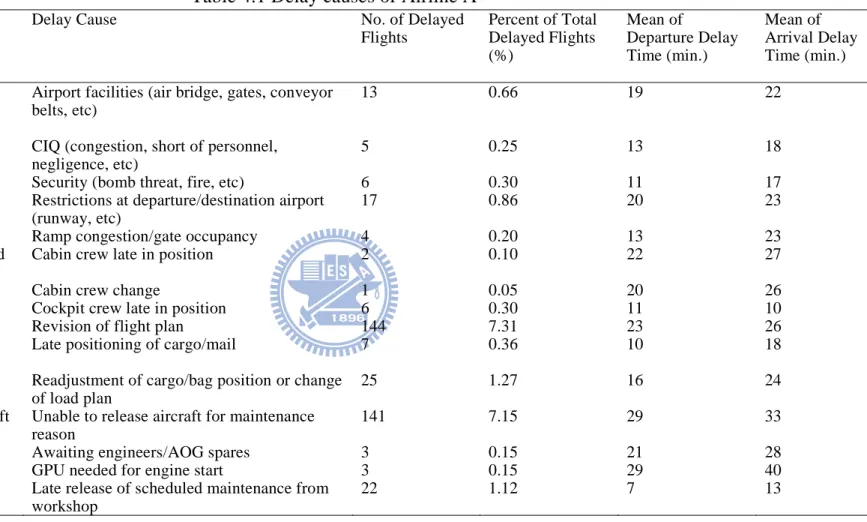
Table 4.1 Delay causes of Airline A………... 40
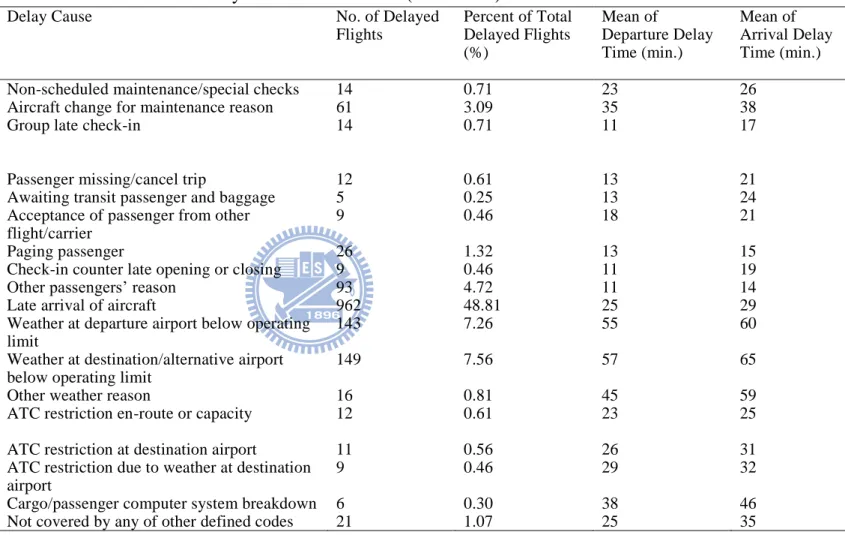
Table 4.2 Delay times of various types of aircraft……… 43
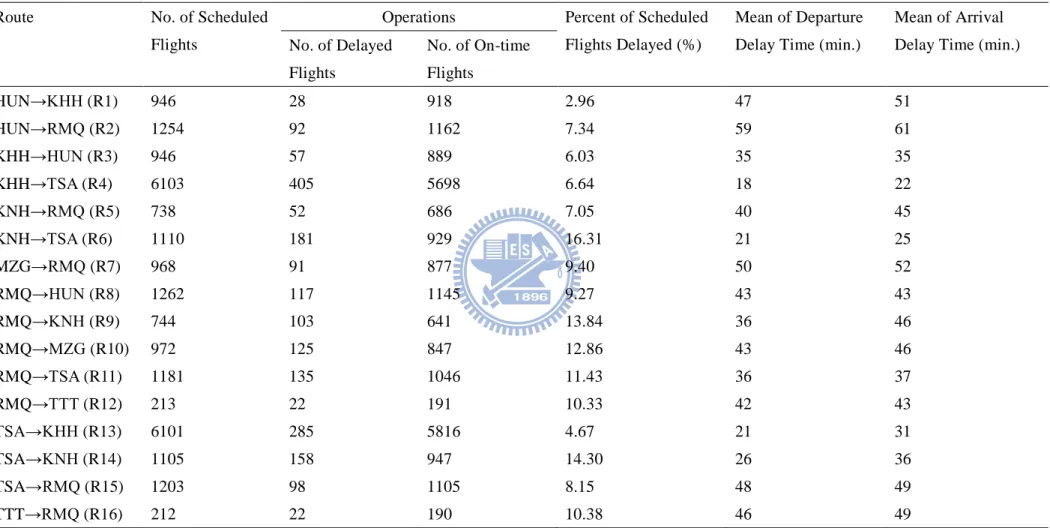
Table 4.3 Delay times of various routes……… 46
Table 4.4 Delay times of hourly periods………... 48
Table 4.5 Delay times of seasons……….. 51
Table 4.6 Routes and assigned aircraft types……… 60
Table 4.7 Difference test of survival curves………. 69
Table 4.8 Variables used in departure and arrival delay models……….. 72
Table 4.9 Results of departure delay mode………... 74
Table 4.10 Results of arrival delay model……… 75
Table 4.11 Example of rotation schedule of Airline A………... 77
Table 4.12 Values of system costs of departure and arrival delay models……… 78
Table 4.13 Results before delay improvement……….. 79
Table 4.14 Results after turnaround operation improvement………... 81
IX
LIST OF FIGURES
Figure 1.1 Research framework……… 5
Figure 2.1 Inputs and outputs of airline operations……….. 8
Figure 3.1. Relationships among flight delays in an airline schedule……….. 27
Figure 4.1 Boxplots of various categories of delay causes………... 42
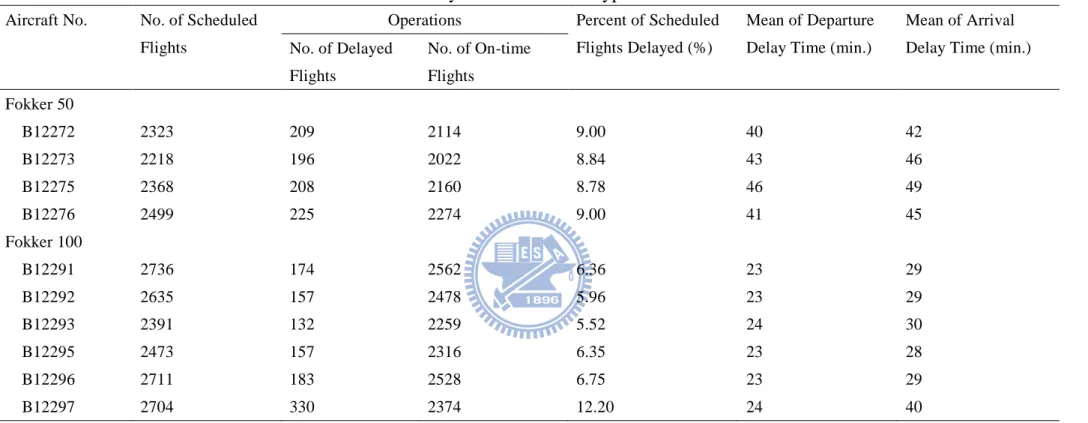
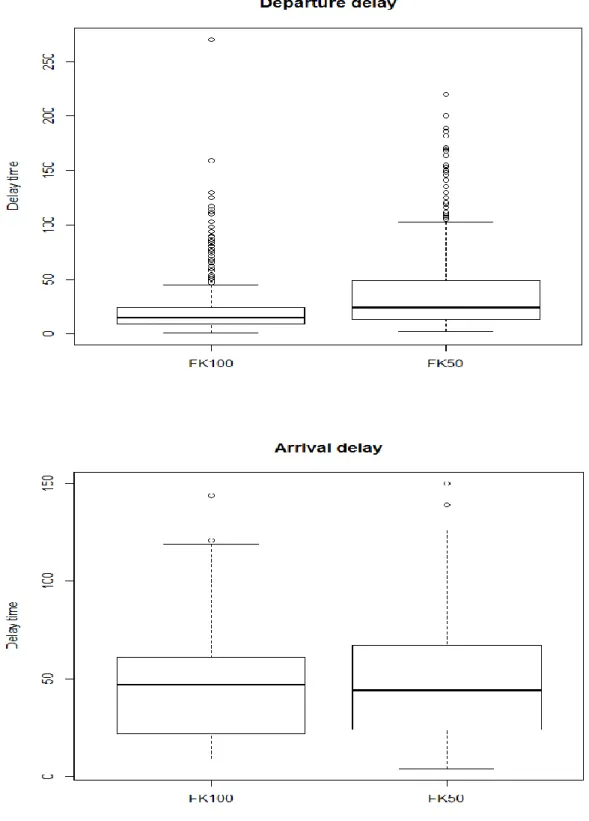
Figure 4.2 Boxplots of various types of aircraft………... 44
Figure 4.3 Boxplots of various routes………... 47
Figure 4.4 Boxplots of peak/off-peak hours………. 49
Figure 4.5 Boxplots of seasons……….. 52
Figure 4.6 Histograms of departure delays and arrival delays………. 54
Figure 4.7 Departure and arrival delays of various routes……… 55
Figure 4.8 Correlation of departure delays and arrival delays……….. 57
Figure 4.9 Survival curves of various types of aircraft………. 61
Figure 4.10 Survival curves of various routes……….. 63
Figure 4.11 Survival curves of various categories of delay causes……….. 65
Figure 4.12 Survival curves of peak/off-peak hours……… 66
Figure 4.13 Survival curves of seasons………. 68
Figure 4.14 Survival curves of departure and arrival delays before delay improvement.……… 80
Figure 4.15 Survival curves of departure and arrival delays after turnaround operation improvement.……… 82
Figure 4.16 Survival curves of departure and arrival delays after turnaround and block operation improvement……… 85
1
CHAPTER 1 INTRODUCTION
This chapter consists of four sections. Section 1.1 addresses the background and motivation of analyzing flight delay propagation and evaluating delay improvement schemes. The research objective is presented in Section 1.2. Research scope and research framework are introduced in Sections 1.3 and 1.4, respectively.
1.1 Background and Motivation
Flight delays are a source of great concern because they generate disruptions and costs to airlines, airport operators, ground handlers and passengers. A common assumption in airline schedule planning is that flights will operate as planned. However, aircraft rotations among airports can be disrupted by many factors, such as delays at previous airports, weather, mechanical or logistical problems with aircraft, late-boarding passengers, and late-arriving crews, and therefore this optimistic situation rarely occurs.
Flight delays may occur at different phases of aircraft rotations. When an aircraft is delayed, the airline suffers delay costs since the aircraft and crew in service are fixed in the schedule. Passengers surely are also dissatisfied with the delayed flight and change their loyalties towards the airline due to the unpunctuality of the schedule. Passenger complaints concerning delays, cancellations, and denied boarding have prompted the U.S. Congress to consider stronger measures to ensure passenger protection (U.S. Government Accountability Office, 2011). Of the total delay costs analyzed by Austrian Airlines, only 22% can be attributed directly to the effect of delays. In fact, 24% of these costs come from the permanent loss of passenger loyalty and 54% come from induced knock-on delays in aircraft rotation schedules (Airline Business, 1999). United Airlines estimated that it saved approximately $1.6 million by using a flight delay projection model during the first quarter of 2004 (Abdelghany et al., 2004). Both of these cases suggest that the consequences of delays and their propagation in the air transport system, including decrease of
2
productivity of aircraft as well as loss of time and loyalty of passengers, cannot be neglected.
The general optimization objective of schedule planning is to reduce flight delays while maximizing the utilization of aircraft. Certainly, airlines may or may not be able to control delay causes. Since delays occur randomly, airlines often embed buffer time to schedules for turnaround and block operations to account for stochastic characteristics of delays. Nevertheless, delays will occur when the accumulated delays exceed scheduled buffer time. Though the scheduling of buffer time stabilizes schedule punctuality and reduces delay costs, airlines may incur costs of additional resources by using this improvement measure. The benefits of delay improvement therefore need to be further investigated.
In aircraft’s daily operations, delays in one flight might easily propagate to successive flights to have further disruptions. Accordingly, how to obtain the overall effects of an initial flight delay in an airline schedule is essential to solve the problem of flight delays. To achieve this goal, airlines have to understand the mechanisms of flight delay propagation as well as to find out the way to identify the origins and effects of flight delays.
1.2 Research Objective
The objectives of this research include:
1. Propose an approach to explore the problem of flight delay propagation in a dynamic operating environment by considering the stochastic characteristics of turnaround and block operations and clarifying the relationship between flight delays and the associated causes:
The duration of a delay represents a period of time the delay has survived before it comes to an end. To fit the survival characteristics of flight delays, survival analysis is employed to model flight delays in a multiple-airport environment.
2. Propose an approach to evaluate the effectiveness of delay improvement schemes by exploring the costs invested for delay improvement and the
3 costs of delay saved:
Because arrival and departure delays are stochastic in nature, delay costs need to be investigated by calculating the expected costs incurred in the delays. Thus, an approach including survival distributions of flight delay propagation in an airline network and the associated expected delay costs will be developed. The incurred delay costs will then be used to compare with the costs invested for delay improvement to evaluate the effectiveness of delay improvement schemes.
1.3 Research Scope
This research is to explore the problem of flight delay propagation in airlines’ daily operation network. To find out the way to reduce flight delays, the party of interest in this research is airline companies instead of airports. The historical data collected was scheduled flights, which included delayed and on-time flights, collected from a Taiwanese domestic airline. In addition, to explore the effects of flight delay propagation, we need the information of an extensive flight network with a very high frequency of flights. Thus, the analysis will focus on only its domestic air routes. International air routes operated by the company will not be analyzed in this research. The general problems, including departure and arrival delays, will be the main subjects to be addressed. By combining the effects of departure and arrival delays, flight delay propagation in an airline network can be therefore investigated through repeated chain effects.
1.4 Research Framework
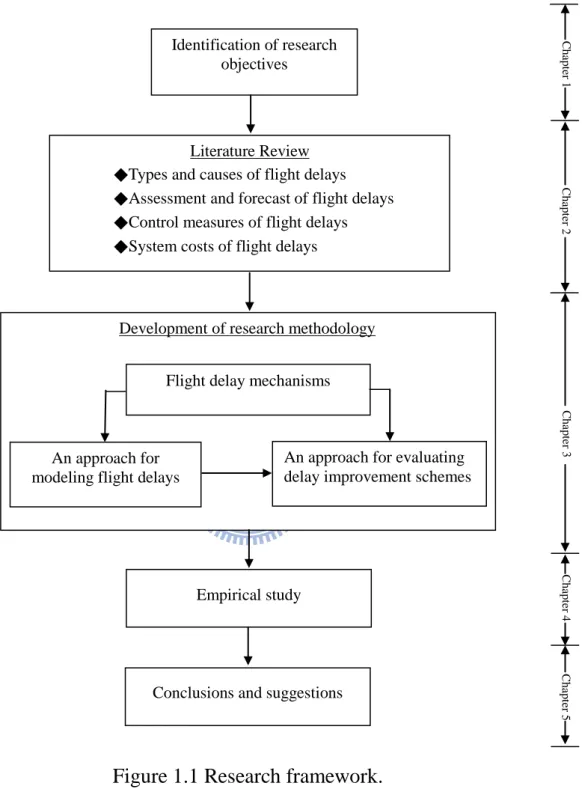
Given the objectives, the research framework is illustrated in Figure 1.1. Chapter 1 explains the background of flight delay problems existing in airline operations and the motivation to find out the way to solve the problems. The objectives and scope of the research are then defined. Prior to analyzing the problems of flight delays, Chapter 2 reviews the studies and applications regarding types and causes, assessment and forecast, and control measures of
4
flight delays to have a better understanding of the relevant issues. Research regarding system costs incurred in flight delays is also reviewed. Chapter 3 first discusses flight delay mechanisms to identify the relationship among flight delays. Two approaches to explore the problem of flight delay propagation are then presented. The first one is to model flight delays in an airline network. The second one is undertaken to analyze the effectiveness of delay improvement schemes using the flight delay models obtained by the first approach. Chapter 4 shows the empirical study using a historical flight data collected from a Taiwanese domestic airline. Chapter 5 makes the conclusions and suggestions.
5
Figure 1.1 Research framework.
Identification of research objectives
Development of research methodology
An approach for evaluating delay improvement schemes An approach for
modeling flight delays
Empirical study C h ap te r 1 C h ap te r 2 C h ap te r 3 C h ap te r 4 C h ap te r 5 Literature Review
◆Types and causes of flight delays
◆Assessment and forecast of flight delays
◆Control measures of flight delays
◆System costs of flight delays
Flight delay mechanisms
6
CHAPTER 2 LITERATURE REVIEW
This chapter reviews studies and applications regarding flight delays, which include research on types and causes, assessment and forecast, and control measures of flight delays. Because this research will evaluate the effectiveness of delay improvement schemes normally adopted by airlines, research concerning system costs incurred in flight delays is also reviewed.
2.1 Types and Causes of Flight Delays
Airline flight schedules are particularly sensitive to individual flight delays because the operating resources are linked together. The delay of one flight tends to propagate down line to many others. In order to evaluate the reliability of airline operating schedule, it is important to clarify the causes of flight delay and evaluate the effect of an initial flight delay as a whole.
Delay is defined in many different ways, depending upon the context. Scheduled departure and arrival delays are how late a flight departs or arrives compared to an airline’s schedule. Flights can incur delays while airborne or on the ground, for example as aircraft taxi between the runway and gate (Wang et al., 2003). Shaw (1987) addressed that there are five different kinds of delays: (1) traffic handling delays, (2) aircraft turnaround delays, (3) aircraft technical delays, (4) air traffic control and airport delays, and (5) weather delays. Jong (2000) illustrated three types of flight delays and their causes:
1. Direct delay to aircraft.
This delay can be caused by (1) weather: thunderstorm, typhoon, (2) mechanical problem: on the ground or en route, (3) airport-related problem: the shortage of runway or terminal capacities, (4) additional demand: charter flight, (5) staff: lateness or absence of staff, (6) maintenance scheduling: change of scheduling, (7) demand change: re-dispatch different types of aircraft, and (8) others: war, strike, etc.
2. Knock-on delay to other aircraft.
7
held on the ground or the shortage of runway or gate. It is not unusual that when an aircraft arrives at an airport, the gate is still occupied by previous flight. The inbound flight will then need to hold until the gate becomes available, and thus the outbound flight may not be able to depart on time. 3. Delay due to late connections.
During daily operations, airlines usually arrange an aircraft to take another consecutive flight after arrival. Therefore, the delay of the previous flight will propagate to the next flight if there is not enough buffer time before departure. It is also quite often that passengers have to transfer to another flight to continue their trips at a hub airport. The outbound flight will need to hold for the connection of inbound flight under the circumstances of the delay of the inbound flight.
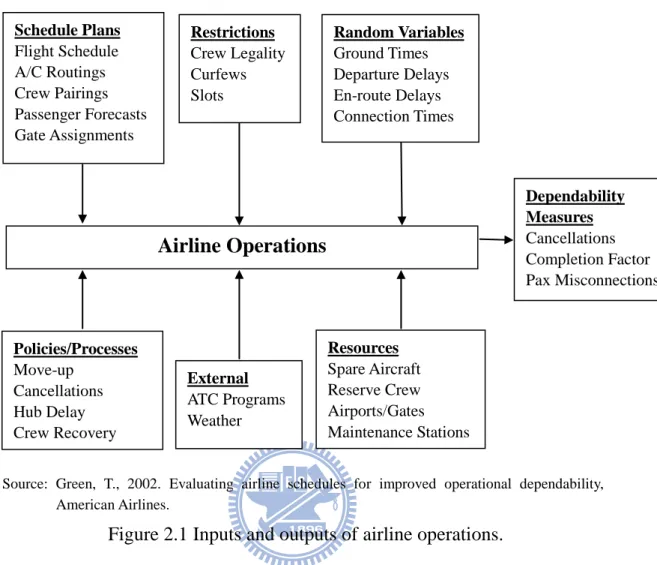
To evaluate airline schedules for operational dependability, Green (2002) pointed out that the delay inputs include (1) departure delay, (2) unscheduled maintenance delay, (3) block delay: taxi-out and runway queue, air-time delay distribution, and taxi-in and gate queue, and (4) external delay: weather, others. The inputs and outputs of airline operations are illustrated in Figure 2.1.
8
Source: Green, T., 2002. Evaluating airline schedules for improved operational dependability, American Airlines.
Figure 2.1 Inputs and outputs of airline operations.
A great deal of research attention has been devoted to identifying the causes of delays. Major contributing factors to delay are congestion at the origin airport, convective weather, reduced ceiling and visibility, continuously increasing demand and even changes in air traffic management (ATM) initiatives such as Ground Delay Programs (GDP) (Xu, 2005). Allan et al. (2001) analyzed the delay causality at Newark International Airport. The conclusion of the study was that weather was the dominant cause of overall delay. The different types of delays (gate delay, taxi-out delay, airborne delay, and arrival delay) were broken out to assess the contributions of the different types of weather events (i.e., terminal convection, high winds, low ceilings and visibility, and en route weather) to each.
Wang et al. (2003) presented a simple analytical model that explicitly
Schedule Plans Flight Schedule A/C Routings Crew Pairings Passenger Forecasts Gate Assignments Restrictions Crew Legality Curfews Slots Random Variables Ground Times Departure Delays En-route Delays Connection Times Dependability Measures Cancellations Completion Factor Pax Misconnections
Airline Operations
Policies/Processes Move-up Cancellations Hub Delay Crew Recovery External ATC Programs Weather Resources Spare Aircraft Reserve Crew Airports/Gates Maintenance Stations9
separated the controllable factors that influence delays and propagation of delays in the National Airspace System (NAS) from those factors that are random variables in a given scenario. The controllable and variable factors are as follows:
1. Controllable factors:
(1) Slack for airport turnaround time.
It is equal to ‘scheduled airport turnaround time’ minus ‘minimum airport turnaround time’.
(2) Flight time allowance.
It is equal to ‘scheduled flight time between airports’ minus ‘minimum flight time between airports’.
2. Variable factors:
(1) Airport turnaround time between flights.
This aggregates all delays that affect airport turnaround time (taxi and gate delays, runway queue, delays due to weather conditions and mechanical problems, as well as other unexpected events).
(2) Flight time between airports.
This aggregates delays that affect flights between airports (delays due to weather conditions, congestion, miles-in-trail restrictions, and runway queue).
However, the causes of delay propagation, which have different impacts to flight schedule reliability, were still not discussed thoroughly in the study.
EUROCONTROL (2003) presented the effect of flight delay propagation which was done through the study of repeated itineraries of the major French airports. The flight delays were classified into two categories:
1. ATFM (air traffic flow management) delays. The delays are due to ATFM regulation. 2. Non-ATFM delays.
The delays include (1) exceptional events: passengers (e.g. VIP), airports (e.g. mandatory security), airlines (e.g. late arrival of aircraft, non availability of aircrew, and plane technical breakdown), and (2)
10
organization of airlines’ ground operations (boarding/unboarding, checking, plane handling, etc.)
In the study, it presented that delays on arrival could be predicted essentially from the delay on departure (80%) and to some extent from the load factor (16%). In addition, delays on departure could be predicted essentially from the departure aircraft load factor (70%) when the aircraft is not lengthily delayed on arrival. Tu et al. (2008) identified and studied major factors influencing flight departure delays, and developed a strategic departure delay prediction model. The model employed nonparametric methods for daily and seasonal trends and used a mixture distribution to estimate the residual error. To overcome problems with local optima in the mixture distribution, the study developed a global optimization version of the Expectation Maximization algorithm borrowing ideas from Genetic Algorithms.
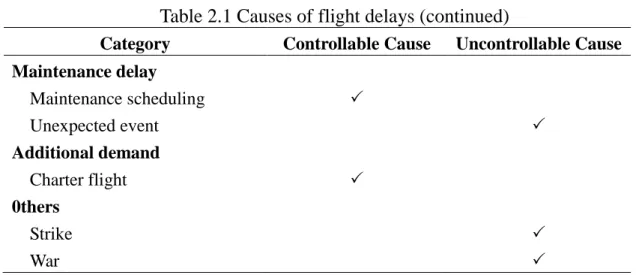
Based on the above literature reviewed, the controllable and uncontrollable causes of flight delays (from the perspective of airlines) are shown in Table2.1.
11
Table 2.1 Causes of flight delays
Category Controllable Cause Uncontrollable Cause
En route delay
Flight time allowance
Airspace capacity
Miles-in-trail restriction
Air traffic control delay
Air traffic flow management
Ground delay program (GDP)
Weather delay
Thunderstorm
Typhoon
Low ceiling and visibility
High wind
Airport turnaround delay
Capacity of runway
Capacity of taxiway (taxi-in and taxi-out) Number of gate Capacity of apron Airport closed Terminal capacity Pre-departure event Workforce/per flight Buffer time
Required handling time
Mandatory security Crewmember delay Lateness or absence of crewmembers Passenger delay Checking Missing Miss of connection Boarding/unboarding (load factor) VIP
12
Table 2.1 Causes of flight delays (continued)
Category Controllable Cause Uncontrollable Cause
Maintenance delay Maintenance scheduling Unexpected event Additional demand Charter flight 0thers Strike War
Source: Collated and tabled by the author
2.2 Assessment and Forecast of Flight Delays
Delay propagation occurs when late arrivals at an airport cause late departures, which in turn cause late arrivals at the destination airport. Many studies have dealt with both schedule optimization and schedule recovery strategies (Barnhart et al., 1998), and a large number of airline planning tools have also been developed (AhmadBeygi et al., 2008). Nevertheless, a prerequisite to the development of tools for building more robust airline schedules is an understanding of the relationship between planned schedules and delay propagation. Thus, to design a robust airline schedule and increase its reliability, researchers have attempted to quantify flight delays or to model the scale of flight delay propagation to find a way to minimize the effect of flight delay propagation on airline networks (Beatty et al., 1998; Schaefer and Millner, 2001; Wu, 2005; Xu et al., 2005; AhmadBeygi et al., 2008).
Wong (1995) presented an analytical structure for modeling flight delays at C.K.S. International Airport, which took into account not only the stochastic characteristics of flight delays, but also the required minimum ground handling time. The results revealed that arrival delay is stochastically distributed and that it is strongly correlated ( 2
R =0.84) between the insufficient ground time and departure delay.
13
propagated delays along aircraft routes based on the concept of resource networks and shortest paths. As operated, an aircraft is ready after its required service/maintenance activities are completed. A crewmember is ready after connecting from the arrival gate to the next departure gate, or after receiving the required legal rest between two successive duties. In the normal operating conditions, all resources are planned to be ready before the scheduled departure time of their next assigned flights by some buffer time. However, it was pointed out in the study that flight schedules are often subject to numerous sources of irregularities: (1) misconnect break, (2) rest break, (3) duty break, and (4) ground delay program (GDP). It is noted that this flight delay model ignores the stochastic issues of flight delays.
To analyze the impact of micro airport-level causes on macro system-level performance, Xu et al. (2005) proposed to use Bayesian Networks to investigate propagation of delays among airports instead of using linear and nonlinear regression methods. Although traditional linear and nonlinear regression methods have been applied to understand and explain the influences of weather, demand and other factors in the aviation system, the application has generally been limited to either single-airport analyses or aggregate analysis of the whole system. The methodology presented in the paper combined multiple individual-airport Bayesian network models into a system-level model capable of representing interactions between airports and quantifying how flight delays from a single airport propagate to impact other airports.
Liou (2004) developed a real-time air traffic flow management (ATFM) program for a multi-airport and multi-period system. This program predicted 15-minute traffic demand, traffic flow and capacity for certain time frame in advance and then determined number of departure flights for each airport, based on the predicted flow and capacity. Hsu (2002) applied probability and statistical methods to model flight delay propagation effects, allowing for behavioral response.
In order to analyze the performance of airport operations and the flight delays due to runway direction change, a SIMMOD-based multi-airport
14
simulation model, including both Taipei and Kaohsiung airports as well as the airspace in between, was developed, calibrated and validated using the ATC data and observed operational data (Wu, 2004). The result demonstrated that because of the required transitional operations from one network configuration to the other, only two or three flights could be allowed to use the runway in the first 15 minutes after the runway direction change. As a consequence, the following flights would somehow be delayed. In addition, the simulation showed that if ATC could separate the arrivals effectively, the first departure flight could reduce delay by 21%, and the total propagation time could be shortened. However, the assumption of this study was that all flights will operate as schedule without cancellation of flights while the destination airports are closed. This may not always happen in airlines’ operations. In addition, an interesting future research would be to generate a national-wide model that could be applied across all major airline/airport combinations.
Schaefer and Millner (2001) used the ‘Detailed Policy Assessment Tool’ to model delay propagation in a network of airports when facing inclement weather conditions. It showed that when only Visual Meteorological Conditions (VMC) exists at all airports, delays are not significant, and therefore the propagation effect is unobservable. Locally, delay increases with increasing duration of Instrument Meteorological Conditions (IMC). Propagated effect is significant for the 1st leg after leaving an IMC airport and diminishes from leg to leg. At an airport with a high capacity-to-demand ratio, IMC operations can be accommodated without significantly increasing delay. The analysis focused on delays incurred due to inclement weather at one airport. However, when multiple airports are experiencing inclement weather, it would be desirable to develop a method to assign delays to previous airports to determine defects caused by each airport, in addition to accumulating effects from all airports.
To better understand the total effects of airline flight delays produced by the FAA’s Ground Delay Program (GDP), Beatty et al. (1998) used a numerical ‘delay multiplier’ (DM), which was based on the length of the initial delay and the time of day it occurs. This was an attempt to develop a generic total value
15
of both the initial delay and its continuing consequences on the airline schedule rather than to predict the actual down line effect any given flight delay would produce. The paper found that large delays early in the day are most disruptive and that the delay multiplier grows nonlinearly with the size of the initial delay. Therefore, reducing a large initial delay by any amount will have a significant effect on total delay for an airline.
Tu et al. (2008) attempted to characterize the underlying mechanisms behind flight delays. Rather than studying the impact of each factor alone, factors were grouped into three major categories: (1) seasonal trend, (2) daily propagation pattern, and (3) random residues, in order to estimate flight departure delay distributions.
2.3 Control Measures of Flight Delays
Flight delays or cancellations occur almost everyday and have made airlines seriously suffer from the perturbation of flight schedule. Wong and Lu (1996) developed an analytical structure of aircraft dispatching strategy for irregular flight incidents beginning with a description of the causes and characteristics of irregular incidents. These irregular incidents were then classified by available resources on the sites of the incidents and the level of the incident impact to the airlines. After the classification, a framework of aircraft dispatching strategy for irregular flight incidents was developed. In the framework, aircraft swapping was one of the important components suggested. Following that, a procedure to find and evaluate feasible aircraft dispatching alternatives was proposed. However, the constraints of aircraft maintenance requirement and the availability of staff were not thoroughly discussed in the study. Also, while confronting with irregular flight incidents, the evaluation of the cost of flight cancellation and the cost of dispatching aircraft will be essential before making an aircraft dispatching decision.
Jong (2000) established a set of delay-controlled strategies on controlling the propagation of flight delays caused by incidents. This study explored the propagation conditions of flight delays for different situations, including gate
16
uses, connecting flights and transfer requirements, and then derived the extent of flight delay propagation. This study also showed that buffer time affects flight delay propagation greatly, and flight delay propagation will be serious if buffer time is short.
Wu and Caves (2002) developed a simulation model to simulate aircraft rotation in a multiple airport environment. The developed aircraft rotation model consisted of two sub-models, namely the aircraft turnaround model and the en route model. In fact, the modeling of the aircraft turnaround process had been studied in the literature by using analytical methods as well as critical path methods (Braaksma and Shortreed, 1971; Hassounah and Steuart, 1993). However, these models had not been successful to capture the stochastic characteristics of aircraft turnaround operations such as the uncertainty from the ground service time of an aircraft and the influence of operational disruptions to aircraft turnaround operations. Hence, in the study the Markov Chain concept was employed in the aircraft turnaround model to simulate the stochastic occurrence of operational disruptions to aircraft turnaround and to model the stochastic service time of turnaround activities.
Vranas et al. (1994) addressed the multi-airport Ground-Holding Problem (GHP) in a dynamic environment. In the study, algorithms were proposed to update ground-holding decisions as time progressed and more accurate weather (hence capacity) forecasts became available. This study proposed several pure IP formulations (most of them 0-1), which had the important advantages of being remarkably compact while capturing the essential aspects of the problem and of being sufficiently flexible to accommodate various degrees of modeling details.
Since the air traffic congestion is cause by the limited capacity, which is heavily influenced by the weather conditions such as visibility, precipitation and wind, it is important to study the interactions of aircraft between airports. Liou et al. (2001) addressed the multi-airport air traffic control (ATC) problem of the Taipei Flight Information Region (FIR) to determine how many aircraft must be held on the ground before take-off and to minimize the total holding
17
(airborne and grounding ) costs. This problem was formulated as an integer programming problem in which the flight flow balance and the capacity constraints of airports were considered.
Wu and Caves (2000) investigated the relationship between flight schedule punctuality and aircraft turnaround efficiency at airports in order to minimize system operational costs and meanwhile to maintain a required level of schedule punctuality. A mathematical model was proposed to simulate aircraft turnaround performance by taking into account stochastic effects of schedule punctuality and delay absorption effects of schedule buffer time.
Wong (1992) presented an optimization model for airport gate assignment. In the study, factors affecting the gate assignment were discussed. The objectives of this model were (1) to minimize the total passengers’ travel distance, (2) to minimize the total passengers’ delay, and (3) to minimize the weighted sum of total passengers’ travel distance and delay. Furthermore, Wong and Lu (1994) evaluated the performance of apron operations of C.K.S. International Airport and suggested adopting a dynamic gate assignment strategy. Experimental results indicated that aircraft should be assigned to gates not only depending on flights schedules, but depending on their actual behavior relative to those schedules and aircraft servicing requirements. Also, more effort is required to assign flights optimally over low utilized gates. Because knock-on delays often result from the shortage of gates, a dynamic gate assignment will help airlines reduce flight delays. In addition, to handle the increasing number of aircraft, shortening buffer time by improving the efficiency of gate use is worth pursuing as well.
Stamatopoulos et al. (2004) developed an integrated set of models that had been developed to assist airport operators and managers in planning strategically for expanding and optimizing the airfield (runways, taxiways, aprons) and for improving operating procedures or managing demand (‘slot control and allocation’). Although the goal of MACAD (MANTEA Airfield Capacity and Delays model), the decision support system described in this study, was to provide such a tool for performing this type of analysis quickly,
18
reliably and with limited effort, the analysis of the congestion problem of terminal area was not available in this model.
Optimizing the utilization of aircraft resources requires that airline business models employ tight turnaround time between flights, which can increase the likelihood of delays in subsequent flights. The typical approach to dealing with disruptions is to re-optimize the schedule; however, a more proactive approach is to build robustness into the schedule in the planning stage. Various statistical models and simulation techniques have been developed to assist in the planning of airline schedules and to minimize the impact of delay propagation in an airline network (Tu et al., 2008; Xu et al., 2005; Lan et al., 2006; Lee et al., 2007). Yan and Tu (1997) developed a framework to assist carriers in fleet routing and flight scheduling for schedule perturbations in the operations of multifleet and multistop flights. The framework was based on a basic multifleet schedule perturbation model constructed as a timespace network from which strategic models were developed to research incidental scheduling. Yan et al. (2002) further developed a network model together with a solution algorithm that could directly manage the interrelationships between passenger trip demands and flight suppliers, in order to effectively assist airlines’ scheduling. To limit flight delays, considerable efforts have been made to develop proactive schedule recovery models. Progress in this field has advanced our understanding of complex issues related to schedule recovery. Lan et al. (2006) developed a delay propagation model on a flight basis by fitting the distribution curves of flight delay data for the aircraft routing optimization problem. Results showed that significant improvement of schedule robustness can be gained by considering delay propagation in schedule planning.
Flight delay analysis is important for managing and reducing delays in future schedule planning and operations. Delays in airline schedules may be the results of many different causes. However, most studies have emphasized the technical aspects of optimizing airline schedules and failed to consider the critical role played by airline ground operations and other delay causes in contributing and controlling delays in daily operations. Wu and Wong (2007)
19
aimed to address the problem of delay propagation in an airline network by explicitly considering the stochastic characteristics of airline ground operations at airports and the delay propagation mechanism among flights in the airline network. A multiple regression model was developed to describe the departure and arrival delays of individual flights. However, the occurrence probabilities of flight delays and their impacts on propagated flights, which may vary under different circumstances, were ignored in this study.
2.4 System Costs of Flight Delays
Flight delays, for example, can be caused by mechanical problems, gate occupancy, or crew’s legality. Flights can also be delayed if safety issues arise due to severe weather or other causes. In the industry there have been many discussions about how to reduce flight delays while maximizing the utilization of aircraft with very tight connections between flights. Flight delays can be divided into three phases: delays on the ground at gate, delays while taxiing at origin or destination airport, and delays while airborne (en-route and holding). When an aircraft is delayed, the airline suffers system costs, which include delay costs and buffer costs. The delay cost is the cost for the delay incurred on the day of flight operations, and the buffer cost is the cost of adding buffer time to schedule, which is planned in advance in anticipation of delays (Cook and Tanner, 2011). It is in the sense that schedules are designed with buffer time built into the schedules to absorb the unpredictability of delays in day-to-day operations. However, the schedule buffer minutes may reduce the number of aircraft rotations in a given day, and are the ‘hidden costs’ associated with airline schedules no matter whether they are fully used or not (Cook et al., 2004). Wu and Caves (2002) developed a cost minimization model to optimize the scheduling of aircraft rotation by balancing the use of aircraft and delay costs. The regularity analysis of the optimized schedule also suggested that the robustness and reliability of schedule implementation can be improved after optimization. Thus, taking into account both the profitability of a schedule and the propagation of delays in operation presents an important opportunity and is
20 also a challenge for airline planners.
The elements of system costs are shown in Table 2.2. The delay costs include ‘aircraft delay costs’, comprising of fuel costs, maintenance costs, crew costs, and aeronautical charges, and ‘passenger delay costs to airlines’. The buffer costs, on the other hand, include ‘aircraft delay costs’, summing only fuel costs, maintenance costs, and crew costs, and ‘fleet costs’.
Table 2.2 Elements of system costs
Cost Element Delay Cost Buffer Cost
Aircraft delay costs
Fuel costs
Maintenance costs
Crew costs
Aeronautical charges
Passenger delay costs to airlines
Fleet costs (depreciation, rentals, and leases)
2.4.1 Aircraft Delay Costs
The aircraft delay costs are the costs of an aircraft incurred during the delay of daily operations. The elements of the costs, following the studies of Wu and Caves (2000, 2002, 2004), are discussed as below.
● Fuel Costs
The fuel costs of delays depend on the fuel burn rates of aircraft types, the fuel price, and the phase where the flight is delayed. A flight delayed on the ground at gate (with APU and engines off for majority of time) is with fuel cost taken to be zero, while the fuel cost of delay per minute en-route and airborne holding is much higher than that at taxi. In calculation of fuel costs, the value of buffer costs is taken to be the same as that of delay costs (Cook et al., 2004). ●Maintenance Costs
The marginal maintenance costs incurred by delayed aircraft during operations relate to factors such as the mechanical attrition of aircraft waiting at gates or accepting longer re-routes to obtain a better departure slot (Cook and Tanner, 2011). As described in the report of Cook et al. (2004), Airbus
21
indicates that 65% of the typical maintenance burden for short-haul operations can be allocated to airframe plus components and the rest of the burden can be allocated to powerplants. The phases, such as takeoffs and landings, are where there is a very high proportion of wear and tear on the airframe and powerplants. However, no delays will be experienced during a takeoff roll or landing. It also indicates that the maintenance cost per minute in airborne operation is approximately twice the value of the ground cost per minute because most of the time spent on the ground is at the gate with engines and auxiliary power unit (APU) off. There will be relatively little wear and tear on the airframe at this ground operation phase as well. Whereas the maintenance costs in delays are related to aircraft utilization and treated as marginal costs, the maintenance costs of using buffer minutes are treated as unit costs, including the costs related and unrelated to aircraft utilization.
●Crew Costs
The crew payment schemes vary greatly among airlines. It can be based on calculations taking into account total duty hours, flight duty hours, time spent at outstations (with corresponding allowances), overtime hours, experience and rating. Accordingly, it is a difficult matter to assign crew costs to particular incidences of delays (Cook et al., 2004). Airlines could suffer no additional cost for delays in some cases. For example, with payments made on a sector-flown basis, an airborne delay would have no effect on crew cost as this payment is based on cycles flown. Similarly, an at-gate delay would have no effect on crew cost paid by block-hours as this payment is based on the operational time between gates (Cook and Tanner, 2009). The marginal crew costs in delays can therefore range from zero extra costs to possibly substantial overtime payments. On the other hand, the crew costs involved in scheduling of buffer minutes are treated as unit costs, which include the costs related and unrelated to aircraft utilization. Hence, the crew costs such as fixed salaries and pensions, amortization of training costs, and insurance, which do not change as a result of flying hours, can only be assigned as buffer costs.
22 ●Aeronautical Charges
The aeronautical charging systems are in many instances imposed and governed by the national authorities. These charges (e.g. landing charge, parking charge, aerobridge charge) are applied in different ways at different airports, depending on the facilities and services provided. Thus, a departure delay at one airport may increase an airline’s aeronautical charges, whilst it may not have an effect on the aeronautical charges at other airport. Taking parking charge as an example, it may be charged according to the length of time parked (per 15 minutes, per hour, or per 24 hours), with or without certain free-parking period. Under this circumstance, whether an airline has to pay more parking charge for a departure delay is subject to the length of time delayed and the free-parking period provided by the airport. Whereas the aeronautical charges of delays are calculated as marginal costs, it is assumed that there is no extra aeronautical cost to be incurred for buffer minutes.
2.4.2 Passenger Delay Costs to Airlines
Passenger delay costs to airlines are treated as marginal costs and comprise ‘hard’ and ‘soft’ costs. The hard costs are such as the costs for re-accommodation (rebooking/rerouting passengers, ticket reimbursements and compensation) and care (meal vouchers, hotel accommodation, frequent-flyer program miles) (Cook et al., 2009), and are difficult to fully ascribe to a given flight due to accounting complications (Cook and Tanner, 2009). The soft costs may incur on the occasion that a passenger is dissatisfied with a delayed flight originally booked and decides to take an on-time flight of another airline. Thus, soft costs can be considered as the potential loss of revenue in future market share as a result of unpunctuality (Cook et al., 2004; Cook and Tanner, 2011). Passenger delay costs can also be estimated through the ‘value of time’ of passengers, which is considered as the opportunity costs to passengers. However, this estimation is not addressed in this research.
23 2.4.3 Fleet Costs
Fleet costs refer to the costs of depreciation, rentals, and leases of flight equipment, which are determined by service hours and are very weakly related to utilization. Therefore, these costs are wholly allocated to the costs of buffer time as unit costs, and are unchanged by the delay outcome. If an airline leases most of the fleet, there will be very low depreciation costs. Conversely, an airline will have relatively low rental costs if it owns most of the fleet (Cook et al., 2004; Cook and Tanner, 2011).
Using cost minimization model, the relationship between the use of buffer time to control schedule punctuality and the delay costs imposed on passengers and airlines was investigated in the studies of turnaround operations (Wu and Caves, 2000, 2004). On the other hand, the effect of using buffer time on the reliability of aircraft rotation schedule was explored by Wu and Caves (2002). To manage flight delays, airlines are prepared for the unexpected stochastic events of turnaround and block operations. Nevertheless, there seems a lack of good tools to measure the effectiveness of the delay improvement schemes.
2.5 Concluding Remarks
With the increase in air traffic volume, the flight delay problem becomes worse and the factors to be considered in air network operations have increased significantly. The major problem faced today is how to minimize delays to departing and arriving flights. Major shortcomings of using airline dependability statistics include the fact that the measurement is an ex post measure and that it reveals only the results of schedule delays without further investigation into determining factors such as schedule design and airline operations (Wu and Caves, 2002). Given the complex procedures of flight operations and their unexpected disruptions, airline companies must clarify the causes of flight delays and evaluate the overall effects of an initial flight delay to design a robust airline schedule.
Many studies have dealt with both schedule optimization and schedule recovery strategies. To design a robust airline schedule and increase its
24
reliability, researchers have attempted to quantify flight delays or to model the scale of flight delay propagation to find a way to minimize the effects of flight delay propagation on airline networks. Various statistical models and simulation techniques have also been developed to assist in the planning of airline schedules. However, most studies have emphasized the technical aspects of optimizing airline schedules and failed to consider the delay causes that contribute and control delays in daily operations.
In aircraft rotations, the time required for operating activities such as taxi time, airborne time, and ground handling time are often subject to numerous sources of irregularities. The state of flight delays may also vary from one aircraft type to another, or in different flight routes. In addition, different causes of flight delays may have different effects on airline schedule reliability, and the effects of flight delays resulting from the same delay cause may not be the same in all cases. Therefore, arrival and departure delays are stochastic in nature. Though scheduled buffer time can lessen the degree of flight delays, available buffer time is stochastic in nature as well because it can be longer or shorter, depending on the length of previous delay time occurred in the recursive operations between departures and arrivals. However, the stochastic effects of flight delay propagation have not been thoroughly captured in previous studies.
In addition, adding buffer minutes to schedule is an easy way to improve flight delays; nevertheless, the costs and effectiveness of the improvement are worth exploring. The approaches appropriate to investigate the causal relationship of flight delay propagation and to evaluate delay improvement schemes will be presented in next chapter.
25
CHAPTER 3 METHODOLOGY
This chapter is to introduce the methodology applied in this research. Section 3.1 presents flight delay mechanisms which explain the relationships among flight delays in an airline schedule. Section 3.2 discusses the survival analysis appropriate for flight delay data. The application of survival model for evaluating delay improvement schemes is presented in Section 3.3.
3.1 Flight Delay Mechanisms
An airline schedule is comprised of flights among various destinations operated by aircraft fleets that may contain different aircraft types. The flights assigned to the same aircraft during one cycle (usually one day for domestic operations and one week for international operations) form the ‘routes’ on which the aircraft is operated. An aircraft operating on the routes is usually referred as aircraft rotation (or aircraft routing), and involves multiple departure, arrival, and turnaround operations at airports and block operations between airports (Wu, 2005).
The turnaround of an aircraft is defined as the ground operation process to service an aircraft from the ‘on-chock’ time at an airport gate to the ‘off-chock’ time the aircraft is to depart for the next flight. The turnaround time represents the time required to finish all turnaround activities (de-boarding/boarding passengers, unloading/loading baggage, cleaning, catering, fuelling, and engineering check) and manage the delays from disruptions. On the other hand, the duration of block operations is defined in terms of the times needed at the phases of taxi-out at the origin airport, airborne operation between airports, and taxi-in at destination airport. During the daily operations of an aircraft, the arrival delay of an inbound aircraft is influenced by the departure delay of the aircraft at the origin airport and the block delay between airports. On the contrary, departure delay of an outbound aircraft is influenced by the arrival delay of the aircraft and the ground delay at airport. Flight delays therefore represent the ‘survival distributions’ of the delays in aircraft operations. The delays can be managed by built-in turnaround and block buffer time.
26
According to Abdelghany et al. (2004), buffer times play an important role in the implementation of recovering schemes associated with irregular operations. Turnaround buffer time, which is the extra time scheduled beyond the time required for ground handling, is usually built-in to accommodate potential delays from late inbound aircraft and aircraft turnaround operations. Scheduled block buffer time is the extra time added to a flight’s scheduled arrival time to permit a degree of variability in flight operations between airports. Although a published airline schedule generally incorporates buffer time, flight delays can occur when accumulated delays exceed the buffer time. Since all flights are connected in aircraft rotations, the flight delay mechanisms presented here include departure and arrival delay in a network.
3.1.1 Departure Delay
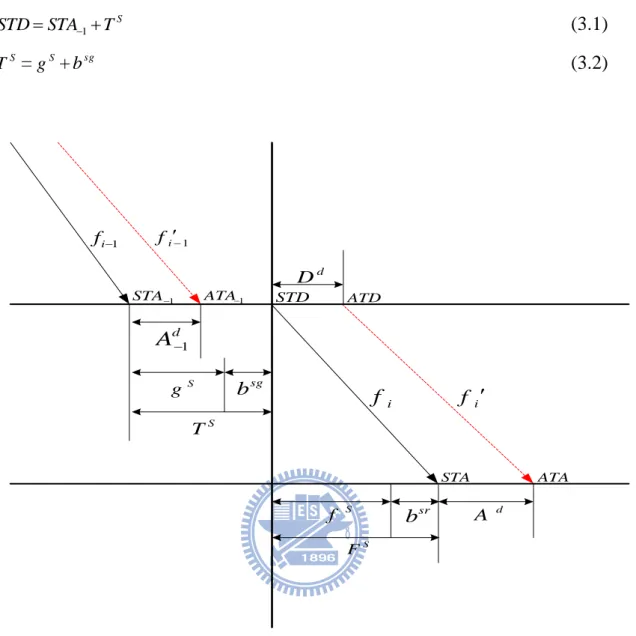
Figure 3.1 illustrates the relationships among flight delays in an airline schedule. The solid arrows represent the original schedule of departures and arrivals for flight legs i-1 and i. STD and STA refer to scheduled time of departure and scheduled time of arrival, respectively, and STA1 refers to scheduled time of arrival of flight fi1. The dotted arrows represent the actual departures and arrivals of these flight legs. ATD and ATA refer to actual time of departure and actual time of arrival, respectively, and ATA1 refers to actual time of arrival of flight fi1. Equation (3.1) describes the relationship between the scheduled time of arrival of flight fi1 (STA1), the on-chock time, and the scheduled time of departure of flight fi (STD), the off-chock time.
The scheduled turnaround time of flight fi ( S
T ) is the scheduled interval between the arrival of flight fi1 at the gate and the time at which this aircraft
departs for flight fi, comprising two parts: the scheduled required ground handling time ( S
g ) and scheduled turnaround buffer time (bsg) (Equation (3.2)).
27 S T STA STD 1 (3.1) S T = S g + sg b (3.2) S g bsg S T d D 1
STA ATA1 STD ATD
S F d A1 S f sr b STA ATA d A 1 i f fi1 i f f i
Figure 3.1 Relationships among flight delays in an airline schedule.
If the delay in an aircraft’s arrival is shorter than the scheduled turnaround buffer time, the scheduled turnaround buffer time is capable of absorbing it. However, a delay in arrival exceeding the scheduled turnaround buffer time might cause a delay in the departure of the next flight. Given the interactions between fixed flight schedules and stochastic disruptions associated with turnaround operations, there might also be a ground delay for flight fi ( d
G ).
If the scheduled turnaround buffer time is incapable of absorbing this ground delay, it could lead to a delay in subsequent departure. Thus, the departure delay of flight fi ( d
28 ( d
A1) and a ground delay at the current airport ( d
G ). Equation (3.3) shows that the scheduled turnaround buffer time ( sg
b ) may be able to absorb these delays.
d D = max
d d sg
b G A1 , 0 (3.3) 3.1.2 Arrival DelayThe scheduled block time of flight fi ( s
F ) includes the scheduled required block operation time ( S
f ), the minimum time required to complete the activities of taxi-out, airborne operation, and taxi-in, and the scheduled block buffer time ( sr
b ) (Figure 1). This buffer is expected to absorb any potential delays at the origin airport and in the block operations. Inbound flight
i
f might also have a block delay ( d
R ) resulting from problems such as severe weather or air traffic control restrictions en-route or at destination airport. This would result in an arrival delay if the scheduled block buffer time ( sr
b ) cannot absorb this block delay. Therefore, the arrival delay of flight fi ( d
A ) can be influenced by a departure delay at the origin airport ( d
D ) and a block delay between airports ( d
R ), which might be absorbed by the scheduled block buffer time ( sr
b ). Equation (3.4) describes this relationship.
d
A max
0,Dd Rd bsr
(3.4)By combining the mechanisms of departure and arrival delays, flight delay propagation in an airline network can be formulated through repeated chain effects. The challenge is to model the departure and arrival delays with their associated causes. Because of the survival characteristics of flight delays, survival analysis is therefore an appropriate approach to explore the problem of flight delays and to analyze the distributions of delays propagated throughout an airline network.
3.2. Survival Analysis
29
survival data or failure time data and has been used in several applied areas of statistics with different emphases. The outcome variable of interest is ‘time to event’, usually referred to as survival time or failure time. In aircraft rotation, the ‘duration’ of a delay represents the period of time that the delay has survived before coming to an end. Therefore, ‘survival time’ refers to the number of minutes from the beginning of an individual flight delay until an event occurs, while an ‘event’ means that the delay of an individual flight has come to an end. For inbound aircraft, the survival time of arrival delay ends when the aircraft arrives at an airport gate; for outbound aircraft, the survival time of departure delay ends when the aircraft departs from an airport gate.
In survival analysis, the object of primary interest is the survival function, which is defined as ) Pr( ) (t T t S (3.5)
The survival function indicates the probability that a flight delay survives longer than specified time t. The survival distribution is plotted as a function that starts with the survival probability of 1 and descends down to the survival probabilities approaching zero for very long delays. Another key concept is the hazard function (Equation (3.6)), which gives the instantaneous probability for an event to occur conditional on survival to time t and specifies the related survival function as well.
t t T t t T t t h t ) Pr( lim ) ( 0 = ( ) ) ( t S t f . (3.6) Our focus is to investigate the impact of delay contributing factors on flight delays. To examine the relationship between the survival distributions of flight delays and associated covariates, we employ the Cox proportional hazards (PH) model (Equation (3.7)), a method widely applied in survival analysis, to model flight delays in a multiple-airport environment.
) ( Xt
h =h0(t,)exp(X) (3.7) This model provides a hazard expression for a flight at delayed time t with a given specification of explanatory variables that is being modeled to predict the hazard of a flight delay. If all the X’s are equal to zero, then the formula