© 2008 WILEY-VCH Verlag GmbH & Co. KGaA, Weinheim
p s s
current topics in solid state physicsc
status
solidi
www.pss-c.com
physica
phys. stat. sol. (c) 5, No. 6, 2099 – 2101 (2008) / DOI 10.1002/pssc.200778453
Azimuthal anisotropy
of light extraction from photonic crystal
light-emitting diodes
Chun-Feng Lai1 , H. C. Kuo*1 , C. H. Chao2 , H. T. Hsueh2 , J.-F. T. Wang2 , W. Y. Yeh2 , J. Y. Chi2 , T. C. Lu1 , and S. C. Wang11 Department of Photonics and Institute of Electro-Optical Engineering, National Chiao-Tung University, Hsinchu 300, Taiwan,
R.O.C.
2 Electronics and Optoelectronics Research Laboratories, Industrial Technology Research Institute, Hsinchu 310, Taiwan, R.O.C.
Received 4 September 2007, revised 31 December 2007, accepted 6 January 2008 Published online 27 March 2008
PACS 42.70.Qs, 78.55.Cr, 85.60.Jb
* Corresponding author: e-mail [email protected]
© 2008 WILEY-VCH Verlag GmbH & Co. KGaA, Weinheim
1 Introduction
Recently, the development in Gallium-nitride (GaN)-based blue light-emitting diodes (LEDs) has initiated the commercialization of LEDs in flat-panel displays and en-abled applications in other displays. Further improvement in internal and external quantum efficiency can expand the market penetration and realize many new applications. Photonic crystal (PhC) has attracted a great deal of atten-tion to enhance the brightness of light-emitting diodes (LEDs) [1, 2]. Both the intensity and the angular distribu-tion of the light extracdistribu-tion can be controlled by engineering the PhC structure fabricated on the light emitting surface, [3, 4]. Many reports on the light extraction efficiency have appeared [5-7] including the periodic light extraction in-tensity variation in the plane perpendicular to the chip sur-face [8]. But the angular dependence of the light distribu-tion, particularly in the azimuthal direcdistribu-tion, has not been examined in detail. In this work, we present the direct im-aging method to investigate the in-plane angular distribu-tion of the extracted light using a special designed structure. The strong dependence on the orientations and lattice con-stants of the PhCs was observed and theoretical discussion
regarding guided modes of diffraction into the air was ad-dressed.
2 Experimental
The GaN epitaxial materials were grown by metalor-ganic chemical vapor deposition (MOCVD) on c- sapphire substrates. The epitaxial structure is composed of a 1 µm-thick GaN bulk buffer layer on c-sapphire substrate, a 2 µm-thick bottom n-GaN current-spreading layer, a 100 nm-thick InGaN/GaN active region consisting of multiple quantum wells (MQW), and a 130 nm-thick top p-GaN current spreading layer. Figure 1(a) shows the schematic diagram of the GaN blue PhC LED structure, where an an-nular PhC region with an inner/outer diameter of 100/200 µm was fabricated. The triangular-lattice PhCs were pat-terned by electron-beam (e-beam) lithography. The holes were then etched into the top p-GaN layer using induc-tively coupled plasma (ICP) dry etching. Figure 1(b) and (c) show the top and tilted views of the scanning electron microscopy (SEM) images of the PhC structures, respec-tively, wherein the etch depth t is 120 nm, and the ratio of hole diameter d to lattice constant a is fixed to 0.7. The Photonic crystal (PhC) light-emitting diodes (LEDs)
exhibit-ing anisotropic light extraction have been investigated ex-perimentally and theoretically. It is found that the anisotropic light extraction strongly depends on the lattice constant and orientation. Optical images of the anisotropy in the azimuthal direction are obtained using annular structure with triangular
lattice. 6-fold symmetric light extraction patterns with vary-ing number of petals are observed. More petals in multiple of 6 appear in the observed image with lattice constant increas-ing. This anisotropic behavior suggests a new means to opti-mize the PhC design of GaN LED for light extraction.
2100 Chun-Feng Lai et al.: Light extraction from photonic crystal light-emitting diodes
© 2008 WILEY-VCH Verlag GmbH & Co. KGaA, Weinheim www.pss-c.com
physica
p s s
statussolidi
c
light extraction properties of PhC structures are character-ized by optical pumping with a 325 nm He-Cd laser at room temperature. The micro-photoluminescence (µ-PL) system is utilized in the experiment, as shown in Fig. 2(a). The sample faces toward the pump laser beam and held on the 2D stage with 3D stepping motor to align the micro-scopes collinearly. A 15x UV objective with numerical ap-erture (N.A.) of 0.32 was used to collect the on-axis emis-sion signal from the sample. A high-resolution digital cam-era charge-coupled device (CCD) was employed to record the microscopic images of radiative light patterns. Incident pump power is 3.2 mW and power density at this pumping condition is about 0.2 MW/cm2. He-Cd cut-off filter was installed in front of the CCD to avoid the backscattering of pumping light from samples.
p-GaN 130 nm MQW 100 nm n-GaN 2um Sapphire a = 300 nm, d = 210 nm a d (b) (c) (a) 100 um 200mm t t =120 nm Buffer layer p-GaN 130 nm MQW 100 nm n-GaN 2um Sapphire a = 300 nm, d = 210 nm a d (b) (c) (a) 100mm 20 m t t =120 nm Buffer layer
Figure 1 (a) Schematic diagram of the MOCVD-grown 470 nm GaN-based blue PhC LED structure. (b) The top-view SEM im-age of PhCs on blue LED with the lattice constant a and the di-ameter of air holes d. (c) The tilted-view SEM image of PhCs on blue LED with the etch depth t.
3 Results and discussion
The observed the images shown on the CCD are due to the scattered PL light at 470 nm by the PhC generated by the 325 nm He-Cd laser beam normally incident into the central area of the annular structure. As light generated in the central area travels radially outward to enter the sur-rounding PhC region, it is extracted by the PhCs and the distribution of the light is imaged by the CCD. The ob-served images show a 60° rotational periodic variation light extraction pattern, as shown in the inset of Fig. 2(a). The light intensity distribution of GaN blue LEDs with PhC patterns is imaged as shown in the Fig. 2(c). The im-ages without the PhC regions are shown in Fig. 2(b) for reference. It can also been seen that the light extraction from the PhC is anisotropic and forms a 6-fold rotational symmetry light extraction pattern. Light emission intensity from the sample with PhC is stronger than that from the one without PhCs. In addition, the light extraction intensity in the Γ-M direction of PC LED structure is larger than
that in the Γ-K direction as shown in the Fig. 2(c). Some of the light propagation inside the PhC region exhibits a fo-cusing behavior.
Figure 2 (a) Schematic representation of the experimental setup for µ-PL system. M mirror; T.L. tube lens; D. M. dichroic mirror; O. objective The CCD images of GaN blue LEDs at 3.2 mW He-Cd laser power injections the inner circle, as shown inset. The in-tensity distribution images of GaN blue LEDs at 3.2 mW He-Cd laser power injections (b) without PhCs, (c) with PhCs (a = 300 nm), the inset shows the reduced BZ.
The observed anisotropic light extraction patterns can be explained using Bragg theory and considering their re-ciprocal lattice. Diffraction can be represented in the wavevector diagram, as shown in the Fig. 3. Figure 3 shows to scale the reciprocal lattice with the appropriate air disk (in red color) and the guided mode circles (in blue and purple color) for lattice constant a = 300 nm. Guided mode propagating in the 2D PhC region can couple with the re-ciprocal wavevectors and diffracted toward the extraction cone (ec) which is the air disk for the present case. When the resultant wavevector falls inside the ec, the diffracted light can escape into air. However to be observed with the microscopy, the light propagation must fall in the numeri-cal aperture (NA) of the objective lens. The circle (in brown color) inside the ec represents the zones where the light will fall into the NA. The solid blue arcs inside the ec are all the wavevectors that fell into the ec. These arcs are all from the coupling to the unit reciprocal vectors GΓ-M.
The solid blue arcs inside the ec in Fig. 3 represent dif-fraction only the Γ-M direction that wavevectors fell into the ec. These arcs are all from the coupling to the unit re-ciprocal vectors GΓ-M so that there are six extracted light
petals parallel to the Γ-M direction of PhC orientation, as shown in the Fig. 2(c). Each point on the arc represents the in-plane component for the possible escape vector. It can be seen that the light propagating in the Γ-K direction cou-ples to the unit reciprocal vector GΓ-K resulted in the
in-H e -C d las er CCD Sample O. 15X M M D.M. T.L. M M (a) (b) (c) Γ K M 40 um 40 um H e -C d las er CCD Sample O. 15X M M D.M. T.L. M M H e -C d las er CCD Sample O. 15X M M D.M. T.L. M M (a) (b) (c) Γ K M Γ K M 40 um 40 um
phys. stat. sol. (c) 5, No. 6 (2008) 2101
www.pss-c.com © 2008 WILEY-VCH Verlag GmbH & Co. KGaA, Weinheim
Contributed Article
plane component that fell “outside” the ec. Thus for light travel in the Γ-K directions, there is no diffracted petal that can escape into air as is observed in the Fig. 2(c).
Figure 3 Schematic scale the reciprocal lattice with the appro-priate air disk (in thick red color) and the guided mode circles (in blue and purple color) for lattice constant a = 300 nm.
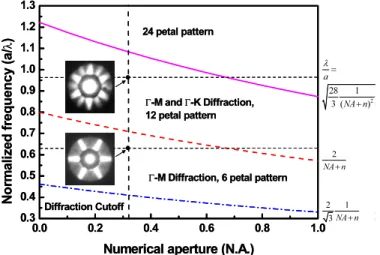
Following the same reasoning as for Fig. 3, for larger lattice constants there are more possibilities for the cou-pling back into the ec, the observed number of petals in the images increased. The pattern becomes more isotropic. Figure 4 is a diagram to illustrate the regions where pat-terns with different number of petals are observed. As lat-tice constants increases, more petals in multiple of 6 ap-pear in the observed image. The insets of Fig. 4 shows the images with 6 and 12 petals for a = 300 and 450 nm sam-ples respectively. Pattern with up to 24 petals has been ob-served with the present setup. The formula for the bound-ary of different regions have been derived and are shown in the figure.
4 Conclusion
In conclusion, we have investigated the anisotropic light extraction in the azimuthal direction of PhC LEDs. Optical measurement images of the anisotropy in the azi-muthal direction are obtained using annular structure with triangular lattice and shown the 6-fold symmetric light ex-traction patterns with varying number of petals. More pet-als in multiple of 6 appear in the observed image with in-creasing lattice constant. The present imaging approach can be used to study the propagation of light in the PhC slabs and provides information important for designing LED and other photonic devices to take full advantages of what the PhC can offer.
Acknowledgements This work is supported by the Na-tional Nanotechnology Program of Taiwan, R.O.C., and the MOE ATU program and, in part, by the National Science Council of the Republic of China under contract nos. NSC 95-2120-M-009-008, NSC 95-2752-E-009-007-PAE, and NSC 95-2221-E-009-282.
Figure 4 illustrates with the formula for the boundary of differ-ent regions where patterns with differdiffer-ent number of petals. Inset showed the 6-fold (a = 300 nm, a/λ = 0.638) and 12-fold (a = 450 nm, a/λ = 0.957) symmetric light extraction patterns.
References
[1] A. A. Erchak, D. J. Ripin, S. Fan, P. Rakich, and J. D. Joan-nopoulos, Appl. Phys. Lett. 78, 563 (2001).
[2] H. Ichikawa and T. Baba, Appl. Phys. Lett. 84, 457 (2004). [3] C. H. Chao and S. L. Chuang, Appl. Phys. Lett. 89, 091116
(2006).
[4] A. David, C. Meier, R. Sharma, F. S. Diana, S. P. DenBaars, E. Hu, S. Nakamura, and C. Weisbuch, Appl. Phys. Lett. 88, 101107 (2005).
[5] T. N. Oder, K. H. Kim, J. Y. Lin, and H. X. Jiang, Appl. Phys. Lett. 84, 466 (2004).
[6] J. J. Wierer, M. R. Krames, J. E. Epler, N. F. Gardner, and M. G. Craford, Appl. Phys. Lett. 84, 3885 (2004).
[7] J. Shakya, K. H. Kim, J. Y. Lin, and H. X. Jiang. Appl. Phys. Lett. 85, 142 (2004).
[8] T. N. Oder, J. Shakya, J. Y. Lin, and H. X. Jiang, Appl. Phys. Lett. 83, 1231 (2003). kx ky GΓ M GΓ K 0.0 0.2 0.4 0.6 0.8 1.0 0.3 0.4 0.5 0.6 0.7 0.8 0.9 1.0 1.1 1.2 1.3 2 1 3 a NA n λ= + 2 a NA n λ= + ( 28 1 3 a NA λ= + 24 petal pattern Γ-M and Γ-K Diffraction, 12 petal pattern
Γ-M Diffraction, 6 petal pattern
Diffraction Cutoff N o rm al iz ed f requency ( a / λ )
Numerical aperture (N.A.)
0.0 0.2 0.4 0.6 0.8 1.0 0.3 0.4 0.5 0.6 0.7 0.8 0.9 1.0 1.1 1.2 1.3 2 1 3 a NA n λ= + 2 a NA n λ= + ( 28 1 3 a NA λ= + 24 petal pattern Γ-M and Γ-K Diffraction, 12 petal pattern
Γ-M Diffraction, 6 petal pattern
Diffraction Cutoff N o rm al iz ed f requency ( a / λ )
Numerical aperture (N.A.)
2 28 1 3 ( ) a NA n λ = + 2 NA n+ 2 1 3 NA n+