國 立 交 通 大 學
電機與控制工程學系
博 士 論 文
發展以小波為基礎的禪定腦電波詮釋方法
Wavelet-Based Methods Developed for Interpreting
The Zen Meditation EEG
研 究 生 : 張 剛 鳴
指導教授 : 羅 佩 禎
發展以小波為基礎的禪定腦電波詮釋方法
中文摘要
禪定學(Meditation)是目前新興的另類輔助醫學(CAM)研究中非常重要且熱門 的研究領域。禪定對於身心健康有很大幫助,尤其是關於壓力調適、血壓控制、情緒 管理、防止老化、增強免疫力等許多導致慢性疾病的因素有改善,而這些均深深影響 現代人健康,尤其影響政府的健康保險費用支出。另一方面禪定是一種非侵入式的活 動,練習者只需要依照正確的指導,循序漸進的學習,就會有身心的改善。尤其本文 以禪宗印心佛法修練者為受測對象,因為在此團體中,有許多人確實透過禪修而獲致 多方面益處,諸如舒解壓力、身心健康、人格穩定、潛能開發、提昇學習與工作績效… 等;對於目前台灣沉重的健保負擔及國人身心健康品質,相信得以提供一個很好的解 決之道。 本論文主要貢獻在於(第一篇論文)以通訊與系統理論來了解並詮釋禪修對於 身心狀況與生命特質的改變機制,並以共振理論來解說加持能量對腦電波的影響。所 發表之論文中,有報告統計調查結果(第二篇論文),並且針對禪坐時的腦電波變化, 發展出以小波為基礎,結合模糊分群法的 DSP 訊號演算詮釋法則(第三篇論文)。演 算法之於禪坐腦電波變化的量化效能也充分得到驗證,並進而應用於詮釋腦電波型態 與長時間禪坐腦電波劇本。 本論文中針對人體在禪定練習過程中,另外發展以小波及赫斯特指數的演算 法,以便有效鑑別腦電波的 beta 波(第四篇論文),而 beta 波是禪定者感受到「內在光」(inner light)時出現的腦波。禪定者 beta 波出現比例愈高者,視覺誘發電位振幅
覺刺激而變化(第五篇論文)。結合受測者口述統計、腦電波及視覺誘發電位的數據,
可間接說明”內在光”存在的生理機制,這點與實際禪定練習者經驗及相關文獻所記
載的「內在光」的各宗教共通經驗不謀而合。這項禪定時受測者大腦有光刺激反應的
ABSTRACT
Meditation is an important topic on complementary and alternative medicine (CAM),
the newly developed and fast growing research area. Meditation has significant
improvement effects on health, especially on the subjects with pressure, hypertension,
emotional control, anti-aging, immune system enhancement, that are critical factors on
modern illness and government expenditure on health insurance. Meditation is also highly
valued due to the non-invasive properties; practitioners can achieve physical and spiritual
achievements by correct teaching and constantly practicing. Zen Meditation practitioners
who are subjects of this research especially gain many profits from meditation practicing,
they are good at moderate their emotions, stresses, and they have more stable personality,
higher learning and working performances. Mediation is a very good solution to people’s
health and heavy burdens of Taiwan’s health insurance budgets.
The first major contribution of this thesis is to interpret the dynamic mechanism of
health and spirit under Zen meditation by communication and system theories, and explain
the EEG change under blessing by circuit resonance theory. We also develop a meditation
EEG interpretation principle based on wavelet features and Fuzzy C-means clustering to
investigate meditation EEG types and long term meditation EEG scenarios. The entire
proposed algorithm’s performances are tested by simulated and real EEG signals.
The little variation of F-VEP amplitude during Zen meditation reflects a more stable visual
perceptive system during Zen meditation that is contrary to the visual response of the
control subjects under eye-closed relaxation. The subject’s narration and VEP, EEG data
prevail the possibility of “innerlight”, and “innerlight”are match the practitioners’
experience and many religious references. The visual response modelof“innerlight”isthe
Contents
Table Index 9
Figure Index 10
Chapter 1 INTRODUCTION 12
1.1 Introduction of Zen Meditation 12
1.2 Survey of literature on the meditation research 17
Chapter 2 METHODS 19
2.1 Introduction of Biomedical signals 19
2.1.1 Introduction of EEG 19
2.1.2 Introduction of VEP 22
2.2 Data Recording Procedures 23
2.2.1 Health survey 23
2.2.2 Blessing 24
2.2.3 Meditation EEG Scenarios 27
2.2.4 VEP 28
2.3 Signal processing algorithms 29
2.3.1 Wavelet approach 29
2.3.2 Sub-Band Power 32
2.3.5 Hurst exponent 42
2.3.6 Alpha-suppressed EEG identification 44
2.3.7 VEP waveform feature extraction 46
Chapter 3 RESULTS 49
3.1 Health Survey 49
3.1.1 Experiences of Zen practitioners 49
3.1.2 Psychological and mental health of the experimental subjects 51
3.1.3 Physiological health conditions in the experimental group 56
3.2 EEG alpha blocking during Zen meditation 62
3.3 Blessing --significant alpha blocking during blessings 64
3.4 Meditation EEG Scenarios 68
3.4.1 FCM and Wavelet 68
3.4.2 Hurst exponent 76
3.5 Correlation between VEP and alpha-suppressed EEG 81
3.5.1 Alpha-suppressed EEG 81
3.5.3 Feature space of EEG and F-VEP 87
Chapter 4 DISCUSSION AND CONCLUSION 89
4.1 Effect of Zen meditation on health 90
4.2 Principle of blessings 91
4.3 Meditation EEG patterns andmeditationscenarios 93
4.4 Inner-light nature of Zenmeditation practice 94
REFERENCES 96
Table Index
1.1 Some examples showing meditation as an effective medical therapy 16
2.1 EEG rhythmic bands and the corresponding wavelet filter bands 32
3.1 Distribution of the meditation lengths for each meditation position 51
3.2 Results of self evaluation of the daily frame of mind 53
3.3 Statistics of HIC applications in the experimental group of 860 subjects 58
3.4 The average HIC applications of different ages and genders 59
3.5 Average number of HIC applications of the experimental subjects 61
3.6 Subband wavelet power of five prototypes in meditation EEG 73
3.7 Corresponding H, SSE, and mean amplitude of each EEG segments 79
3.8 H and SSE distribution of 200 EEG epochs 79
Figure Index
:1 EEG electrodes displacement according to 10-20 system 21
2 Typical VEP patterns 23
3 Some important apertures (Chakras) in Zen meditation 26
4 Illustration of wavelet decomposition of an EEG segment 31
5 Block diagram of FCM-merging strategies 33
5(b) Flowchart of cluster-merge A 37
5(c) Flowchart of cluster-merge B 40
5(d) Flowchart of cluster-merge C 42
6 Chart of H&SSE pairs calculation 45
7 F-VEP preprocessing algorithms 47
8 F-VEP trial stacking map 48
9 Histogram of contentment and stress moderation (weekly practicing frequencies) 54
10 Histogram of contentment and stress moderation (practicing years) 54
11 Histogram of stress moderation (weekly practicing frequencies) 55
12 Histogram of stress moderation (practicing years) 56
13 Histogram of contentment (weekly practicing frequencies) 56
14 Histogram of contentment (practicing years) 57
17 Effect of practicing years on the physiological health 62
18 EEG segment of subject when perceiving the light 64
19 Three EEG segments reflecting the effect of perceiving the light 65
20 Running power-percentage analysis for the blessing EEG data 66
21 Running power-percentage analysis for the non-blessing EEG data 68
22 Distribution of subband wavelet coefficient powers (v7, v6, v5, and v4) 70
23 Three-dimensional illustration of wavelet feature vector {v5[], v6[], v7[]} 71
24 Five meditation-EEG patterns (from top):,+,+, +, and 72
25 Five meditation scenarios based on evolution of meditation EEG 75
26 Time-domain EEG segments of the H&SSE pairs 78
27 The Fourier spectrums of the EEG waveforms 79
28 H&SSE pairs’distribution oflong-term EEG rhythms 81
29 Typical alpha-suppressed EEG. segment and corresponding FFT spectrum 83
30 Illustration of sum-versus-max alpha-suppressed EEG duration 84
31 Average percentages of alpha-suppressed EEG 85
32 Average F-VEP patterns recorded during three recording sessions 86
33 Maximum alpha-suppressed EEG duration versus F-VEP N3-P2 peak amplitude
Chapter 1 INTRODUCTION
1.1 Introduction of Zen Meditation
As the complementary and alternative medicine (CAM) becomes more appealing to
the public, researchers begin taking a more serious attitude toward this oriental approach
for health maintenance and promotion [1]-[3].
According to the definition of National Center for Complementary and Alternative
Medicine (NCCAM) [4], a division of the National Institutes of Health of USA,
complementary and alternative medicine is a group of diverse medical and health care
systems, practices, and products that are not presently considered to be part of conventional
medicine. NCCAM also classified the CAM into five categories, which are (1) Alternative
Medical Systems, (2) Mind-Body Interventions, (3) Biologically Based Therapies, (4)
Manipulative and Body-Based Methods, and (5) Energy Therapies. This paper’s focus,
meditation, is belonging to the Mind-Body interventions categories. NCCAM defines
Mind-Body Interventions categories as a variety of techniques designed to enhance the
mind's capacity to affect bodily function and symptoms. For example: patient support
groups, cognitive-behavioral therapy, meditation, prayer, mental healing, and therapies that
use creative outlets such as art, music, or dance.
model under meditation since 1998. In this research work, we mainly focus on the
electrophysiological signals, including the electroencephalograph (EEG),
electrocardiograph (ECG), visual evoked potential (VEP), blood pressure wave (BPW), and
galvanometric skin resistance (GSR), with the reference of some CAM (complementary
and alternative medicine) instruments. Although a number of Zen-meditation sects have
emerged, orthodox Zen-Buddhist meditation is the only approach acceding to the essence of
Buddha Shakyamuni. Zen-Buddhist practice has become not only the religion but also
greatly improved physical and mental health.
Zen-Buddhism originated about 2,500 years ago. The practice was handed down by
Buddha Shakyamuni to the Great Kashiyapa. The same path towards Buddhahood was
promulgated to mainland China in 527 by the 28th patriarch Bodhidharma. Until the 33th
patriarch Huei-Neng, Zen-Buddhist practice began reaching to other areas such as Japan
and Taiwan. The current patriarch is Zen master Wu Jue Miao Tian, the 85thpatriarch of the
orthodox Zen-Buddhism Sect.
The core essence of Zen-Buddhist is practice rather than Sutra-texts studying. Through
meditation, a practitioner seeks to attain the enlightened state of spiritual release from the
Self [5]-[6]. In the history of orthodox Zen-Buddhism, very few disciples were able to catch
its quintessence since it cannot be taught in any form of lecture. Written material and
derived from Zen Buddhism, they cannot be true Zen without succession to the supreme
wisdom and the noumenal energy.
According to the experiences described by meditators, in the course of Zen meditation,
meditators transcend the physiological (the fifth), mental (the sixth), and subconscious (the
seventh) states and attain the Alaya (the eighth) conscious state [6]. Under Zen meditation
they gradually release their minds from their physical and mental sensors, leave off the
messages from the outside world, and keep subliminal consciousness tranquil. In addition,
in meditative states, meditators find that their bodies are filled with inner energy, and they
perceive an inner light [5]: the original, true self — discover and uncover the light of
eternal life.
Inner energy differs from qi energy [7]-[9]. As stated by practitioners, qi energy can be
ranked into 4 levels: real qi, spiritual qi, electrical qi, and light qi. Qigong practitioners
mostly achieve the real-qi level, which belongs to the physical world and, accordingly, is
time-varying. The highest level achieved by qigong practitioners is the spiritual qi. Even
reaching this level, one still cannot prove the true self. The spiritual qi can be transformed,
via orthodox Zen-Buddhist practice, into electrical qi and even light qi that is finally the
light of eternal life.
meditation. The procedures to practice Zen meditation include: (1) sit with legs crossed
(lotus position), (2) regulate the respiration, (3) concentrate on the Chakra, and finally
relieve all thoughts and mental activities. The practitioner can explore the inner energy by
transcending the physiological, mental, subconscious, and Alaya conscious states. During
the Zen meditation course, blessing power bestowed by the Master attaining Buddhahood
will aid to the inner energy experience of the disciples. The human life system in this state
may be interpreted as follows: one shuts off his physical and mental sensors, disables the
message transmission from the outside world, and is finally freed from the interference of
the subconscious. In the physical world, the human life system lives in the domain of
physical, mental, and even subconscious activities. Nevertheless, a message originating or
conveyed in this domain, to our true self, behaves like the dark cloud covering the brilliance
of the sunlight. Speaking in the engineering sense, the signal is contaminated by noise.
Zen-Buddhist practitioners have discovered that the inner energy is the resource of
health and bliss. According to our investigation, the practitioners through years of
Zen-Buddhist practice can change the constitution of their bodies by ignition of the inner
energy. A large number of practitioners are found not only to maintain better health but also
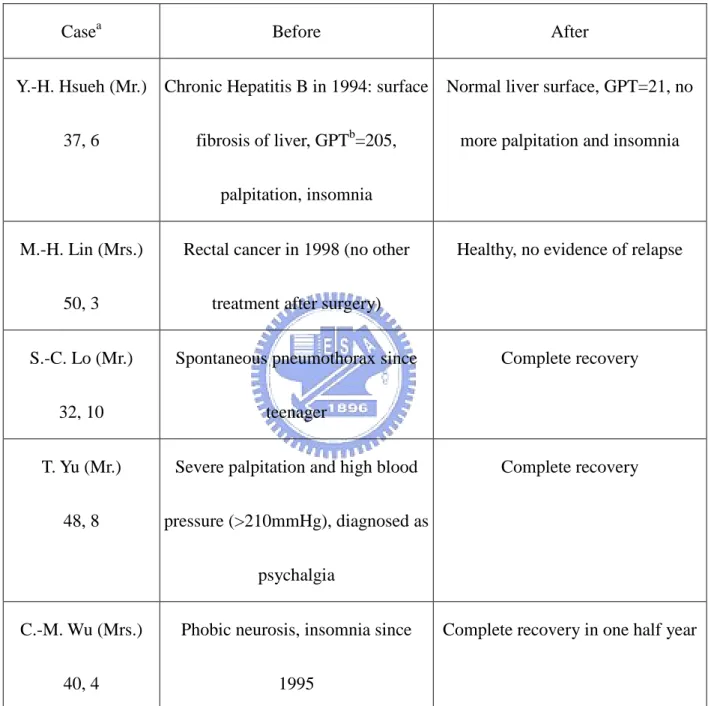
to remain younger and more energetic than normal people do (Table 1.1).
In this thesis, we investigated the effects and phenomena of Zen meditation by (1) the
Table 1.1. Some examples showing meditation as an effective medical therapy (November
2001)
Casea Before After
Y.-H. Hsueh (Mr.)
37, 6
Chronic Hepatitis B in 1994: surface
fibrosis of liver, GPTb=205,
palpitation, insomnia
Normal liver surface, GPT=21, no
more palpitation and insomnia
M.-H. Lin (Mrs.)
50, 3
Rectal cancer in 1998 (no other
treatment after surgery)
Healthy, no evidence of relapse
S.-C. Lo (Mr.)
32, 10
Spontaneous pneumothorax since
teenager
Complete recovery
T. Yu (Mr.)
48, 8
Severe palpitation and high blood
pressure (>210mmHg), diagnosed as
psychalgia
Complete recovery
C.-M. Wu (Mrs.)
40, 4
Phobic neurosis, insomnia since
1995
Complete recovery in one half year
a: the column lists the name (sex), age, and number of years of practicing Zen-Buddhism.
ECG, VEP, GSR, and EMG) recorded under the blessing power bestowed by the Zen
master as well as under the normal Zen meditation. The surveys are analyzed by statistical
analysis
Two wavelet-based algorithms, the Hurst exponent and the meditation-scenario
interpreter using Fuzzy C-Means clustering, have been developed. The questionnaire
survey study led to demonstration of the benefit of Zen meditation to the health. The
meditation EEG analysis, on the other hand, revealed specific meditation scenarios and the
inner light phenomenon as the unique finding that correlated particularly to the Zen
meditation under spiritual blessing.
1.2 Survey of literature on the meditation research
Different meditating techniques have been studied for several decades. They are
mostly the transcendental meditation (TM) [10]-[22], Yoga [23]-[26], Qi-Gong [27],
Tibetan [28], and Japanese Zen meditation [29]-[30], with the focus mainly on the
physiological and psychological effects of meditation. Numerous studies have focused on
the physiological and psychological effects of meditation, with few addressing the
underlying mechanisms. The search for physical and psychological correlates of meditation
has centered essentially on three methods: Yoga in India, TM in the United States, and Zen
China where orthodox Zen Buddhism originated.
In the study of psychological effect, researches mainly focus on the meditation effect
on stress reduction, anxiety control, comprehensive capacity, and improvement of other
mental activities and brain functions [31]-[34]. Meditation also improves the physiological
conditions, such as moderation of hypertension, boost of immune function and endocrine
secretion, even prevention of the cancer cells spreading [35]-[38].
During the past decades, the study of biomedical signals during meditation [39] has
covered a wide scope including EEG, ECG [40], respiration [41], blood pressure, GSR, and
fMRI (functional magnetic resonance image). This thesis is mainly devoted to the Zen
meditation EEG. A number of papers have reported the EEG findings of subjects practicing
various meditation techniques [42]-[48]. West [49] summarized those EEG findings and
commented on the EEG changes during meditation as follows: On beginning meditation, an
increase in alpha amplitude and a decrease in alpha frequency are often observed. Next,
rhythmic theta trains may occur for experienced meditators. Thereafter and very rarely,
bursts of high-frequency beta (above 20Hz) are recorded for meditators capable of
achieving deep meditation, ‘samadhi’or ‘transcendence’. Thus, it was suggested that the
Chapter 2 METHOD
2.1 Introduction of Biomedical signals
2.1.1 Introduction of EEG
The electroencephalographic (EEG) signals, discovered in 1924 by Hans Berger [50],
represent the tracings of summated cortical electrical activity collected by applying multiple
recording sensors (called the "EEG electrodes") on the scalp (non-invasive recording) or on
the cortex (invasive recording). The cortical potentials are actually the average of excitatory
(EPSP) and inhibitory postsynaptic (IPSP) potentials from hundreds of neural cells nearby
the recording electrodes [51]-[54]. After intensive research for several decades, the EEG
has proved to be an important clinical tool for diagnosing and monitoring the central
nervous system regarding normal or pathological conditions. For instance, sleep staging
based on the EEG has been applied to the evaluation of sleep disorders [55]. Seizure
detection and psychology state investigation are also important application for EEG
[56]-[58].
The typical EEG signals are characterized by frequency, the rhythmic bands were
classified as follows: delta band (1 ~ 4 Hz), theta band (4~ 8 Hz), alpha band (8 ~ 13 Hz),
and beta band (13~ 25 Hz).
20 µV peak-to-peak over the entire brain. Beta wave occurs when eyes open or when one
becomes alert. Occipital alpha dominates when an alert adult with eyes closed. Alpha
rhythm is also associated with the relaxation state. It may be attenuated when eyes open or
when one becomes alert.
In older children and young adults, bursts of 5Hz or 6Hz sinusoidal, bisynchronous,
moderate-voltage theta may be seen in drowsiness or arousal anteriorly and temporally.
Bursts of theta slowing may also occur during stage 2 sleep. The maximum voltage is
usually central, that may be diffuse (anterior or posterior dominant). Increase of random,
diffuse delta slowing normally characterizes the deeper stages of sleep for normal subjects.
Note that temporal slow waves (theta and delta) of a few times the background amplitude in
older subjects may correlate with cerebrovascular disease or with impairment of cognitive
function.
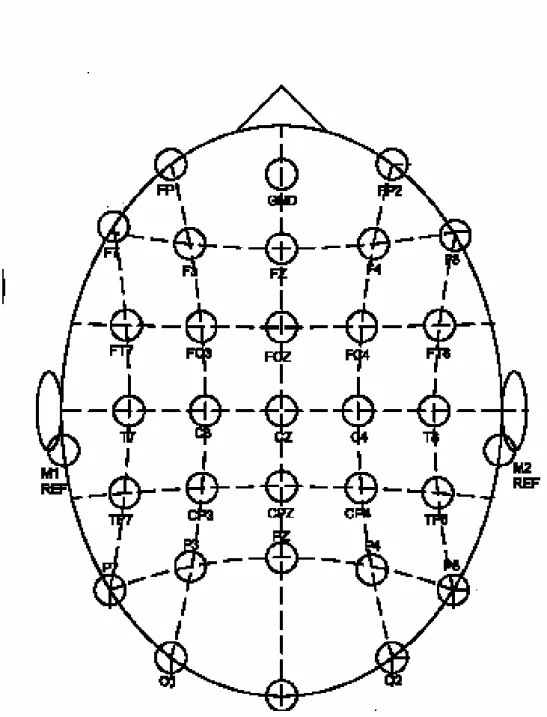
In this study, the EEG signals were recorded from the scalp (non-invasive
recording). The EEG electrodes are placed according to the definition of 10-20 system (see
Figure 1). We can study the brain dynamics and spatial characteristics by analyzing the
symmetrical behavior of frontal-versus-posterior or temporal electrodes.
In this thesis, we use EEGs to characterize the meditation stages and to interpret the
meditation scenarios. Beside the common time-domain and frequency-domain analysis
quantify the time-varying EEG spectral properties [59]-[66]. In addition, fuzzy clustering
[67]-[73] was used to classify various EEG patterns. Hurst exponent [74] evaluated by
wavelet method was modified for identifying a typical pattern correlating with an important
meditation stage.
2.1.2 Introduction of VEP
The visual evoked potential (VEP) is an evoked electrophysiological potential that can
be extracted, using signal averaging, from the EEG activity recorded in the scalp. The VEP
can provide important diagnostic information regarding the functional integrity of visual
system [75]-[79].
Flash VEPs are variable across subjects than pattern responses but show little
interocular asymmetry. They may be useful in patients who are unable or unwilling to
cooperate for pattern VEPs, and when optical factors such as media opacities prevent the
valid use for pattern stimuli. Due to the meditation practitioners must close their eyes
during meditation; we use unpatterned flashes to get meditation VEP [80]-[81].
The visual evoked potential to flash stimulation consists of a series of negative and
positive waves. The earliest detectable response has a peak latency of approximately 30 ms
post-stimulus and components are recordable with peak latencies of up to 300 ms. Peaks
are designated as negative and positive in a numerical sequence (see Figure 2). For the flash
VEP, the most robust components are the N2 and P2 peaks. Measurements of P2 amplitude
should be made from the positive P2 peak at around 120 ms to the preceding N2 peak at
around 90 ms. In this paper, we compare the correlation between EEG and VEP to interpret
0 100 200 300 400 500
Time (ms)
-23.1 23.1 V E P (u v ) N2 P2 N1 P1 N3 P3Figure 2 Typical VEP patterns.
2.2 Data Recording Procedures
2.2.1 Health survey
Effects of practicing Zen-Buddhist meditation on the health promotion were analyzed
according to the average number of using the Health Insurance Card. The questionnaires for
this survey are shown in appendix-A. A total of 1,050 survey forms were distributed to the
participants of a Zen-Buddhist meditation class. Twenty minutes were allotted for
filled as were requested. The results of statistical analysis presented in this paper are thus
based on a bin of 860 cases with a wide range of ages (16~75 years). The mean age of the
subjects is 40.2 years with a standard deviation (std) of 12.1. The male-to-female ratio is
approximately 4:6. The age groups were evenly distributed.
72 percents of the experimental subjects had at least a college education, indicating
the popularity of Zen-Buddhist meditation in this sector of the populace. This also allowed
us to assume that the subjects were less likely to have misunderstood the questionnaire
contents that strengthened the reliability of the survey. Information gathered from the
questionnaires was analyzed by Excel. In addition, we took note of the frequency of usage
of the Health Card and compared the results with analogous data of the non-Zen-practicing
populace gathered by the Health Bureau (a population of 21,869,478 in 2002) [82].
2.2.2 Blessing
2.2.2.1 Hypotheses of blessing: circuit resonance
By seeking Zen, one is actually seeking the true energy of life. The only thing being
promulgated in Zen-Buddhism is the truth, the wisdom, and the power of Zen in nature.
Based on the essence of orthodox Zen Buddhism, we hypothesize that its pivotal technique
of meditation can be comprehended via the resonance phenomenon.
frequency equals the resonance frequency of the circuit. No resonance occurs in the
physiological, mental, conscious, or subconscious states due to the existence of selfhood
(ego). To be in resonance with the inner light, disciples of Zen-Buddhism spend years
preparing themselves for the moment of resonance. One of the preparations, for instance,
involves transcending physiological habituation. The first step is to switch the respiration
habit from chest to abdominal respiration Then by guarding some important apertures, the
qi-energy starts penetrating, from the corpora quadrigemina (the Wisdom Chakra), through
the pineal gland (Figure 3), bridging the energy passage between cerebellum and cerebrum.
Gradually, the human life system enters a unique state in harmony with nature and the
universe(called “the unification ofheaven,earth,and human”).In thisstate,onebecomes
more and more egoless and liberated, that is, his body and mind are free (without
attachment) even though the person is still involved in masses of worldly work.
According to the elucidation above, meditation in orthodox Zen-Buddhism follows a
different quintessence compared with other meditating methodologies. It needs to be noted
that this kind of energy or light differs from the qi energy. The qi energy is generated by
exploiting the physical and mental capacity of the human life system. An experienced
qigong master may generate spiritual qi energy by exploiting the latent capacity of the
subconscious. On the other hand, the inner energy can be uncovered only when one
In the blessings experiment, EEG changes during blessings were investigated.
Blessing in orthodox Zen Buddhism indicates a substantial benefaction from the master. A
true master in orthodox Zen Buddhism is required to attain the Buddhahood Trinity full
attainmentofBuddha’sthreebodies,theemanation body (Nirmanakaya),thetruth body
(Dharmakaya), and the blessedness body (Sambhogakaya). With the true energy (light) of
life in nature he is thus able to help disciples [5]-[6].
Figure 3 Some important apertures (Chakras) in Zen-Buddhist meditation. Zen Chakra (inside the third
ventricle)
Dharma Eye Chakra (hypophysis) Pineal
gland
Wisdom Chakra (corpora quadrigemina)
2.2.2.2 Experimental protocols of blessing
In our blessing experiment, master Wu Jue Miao Tian of the Zen-Buddhism Sect was
invited to perform the blessing. A total of eight subjects were tested; among them, two
subjects were non-meditators. Each subject was recorded twice, with one-week separation
between the two recordings. The blessings ritual was performed in one recording only for
each subject. It has been reported that blessings from master Wu Jue Miao Tian cured many
people. To avoid the possibility of a placebo effect, the subjects did not know that they were
to be blessed during the EEG recording. Master Wu Jue Miao Tian was not in the same
room where the experiment was conducted. Both the experimental group (Zen-Buddhist
practitioners) and the control group followed the same procedure: they were asked to sit,
with eyes closed, in a normal relaxed position for 30 minutes. The blessings ritual, lasting
for about 30 seconds, was provided once in each test. The effect of the blessing on the
meditator normally continued till the end of meditation, as stated by the disciples in the
post-experimental interview, although the blessing ritual itself lasted a short period. The
effect of blessings on the EEG was compared between the experimental and control
subjects.
2.2.3 Meditation EEG Scenarios
We applied the 8-channel unipolar recording montage of which the common reference
at F3, F4, C3, C4, P3, P4, O1, and O2. The sampling rate was 400Hz. Each recording lasted
for 45 minutes, including the first 5-minute background EEG (the subject sat in normal
relaxed position with eyes closed) and the rest 40-minute meditation EEG. During the
meditation session, the subject sat, with eyes closed, in the full-lotus or half-lotus position.
Each hand formed a special mudra (called the Grand Harmony Mudra), laid on the lap of
the same side. The subject focused on the Zen Chakra and the Dharma Eye Chakra (also
known asthe “Third Eye Chakra”)in thebeginning ofmeditation tilltranscending the
physical and mental realm. The Zen Chakra locates inside the third ventricle, while the
Dharma Eye Chakra locates at the hypophysis (as shown in Figure 3).
2.2.4 VEP
During the recording, subjects sat on a chair with eyes closed. The meditators
practiced Zen-Buddhist meditation for 40 minutes. The control subjects just sat in a
relaxation position for the same recording interval. Flash visual evoked potentials (F-VEPs)
were recorded before, during and after meditation/relaxation, based on the 30-channel EEG
montage (Figure 1). Each run consisted of 50 flash stimuli. The flash light was 10 us in
duration and 2 Hz in frequency produced by a xenon lamp that was placed 60 cm in front of
2.3 Signal processing algorithms
2.3.1 Wavelet approach
For the past two decades, wavelet analysis has been extensively studied and proved to
be a useful tool in biomedical signal processing [83]-[87]. Appropriate selection of scales
and wavelet bases enables it to characterize the EEG rhythmic patterns [88]. The procedure
is depicted below.
Firstly, the 2-second running window, moving at a step size of 1 second, is employed.
And the entire meditation EEG record is divided into L segments. Consider a discrete-time
signal x[n], 0nN1 (N=800), representing the lth running EEG epoch. The aj
n and
ndj indicate, respectively, the coarse and detailed sequences after j′s decompositions
[89]-[90]. They can be obtained by
k j j n a k h n k a 1 [2 ], and (1)
k j j n a k g n k d 1 [2 ] (2)where a0
n xn , the original EEG segment. According to the theory developed inmultirate digital signal processing, h
n is the scaling filter, and g
n is the wavelet filter,the impulse responses h[n] and g[n] designed based on QMF (quadrature mirror filter)
n
g
N n
n Nh 1n1 1, 1 (3)
where N is the length of h[n].
The half-band filter coefficients of wavelet base db5 used in this study were
h[n]=[0.0033, –0.0126, –0.0062, 0.0776, –0.0322, –0.2423, 0.1384, 0.7243, 0.6038, 0.1601]
and g[n]=[–0.1601, 0.6038, –0.7243, 0.1384, 0.2423, –0.0322, –0.0776, –0.0062, 0.0126,
0.0033]. A wavelet base with a short filter length has a high temporal resolution; whereas
the wavelet bases with a long filter length has a high frequency resolution but also a higher
computational requirement. The db5 base was chosen in this paper as a good compromise
between decomposed EEG frequency resolution and computational requirements.
The lth running feature vector, vk[l], is extracted from the selected detailed-scale
coefficients by computing their powers as
1
, 4,5,6,7 1 2
d i k n l v nk i k k k (4)where nk is the length of d . The feature vector of the lth EEG epoch accordingly isk
l
v4[l],v5[l],v6[l],v7[l]
v (5) Finally,
T
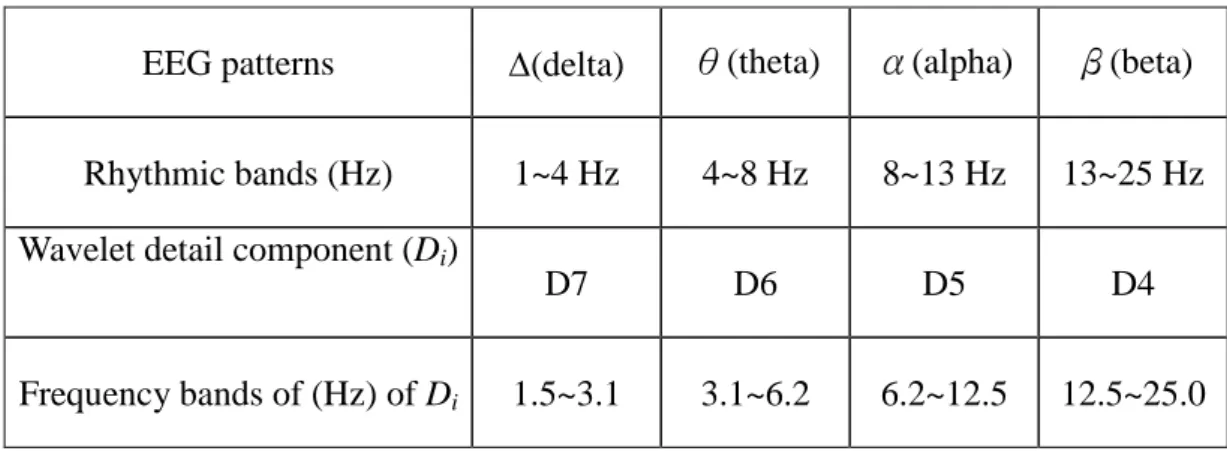
T L v v L l l v[ ]0 1 0, , 1 V (6)In consideration of computational efficiency, the discrete Wavelet transform (DWT) is
often applied. As illustrated in Table 2.1 and Figure 4, the DWT scales D4 ~ D7 are
approximately matched to those well-defined EEG rhythmic bands, assuming a sampling
rate of 400 Hz. The feature vector is thereafter constructed from these DWT coefficients.
Figure 4 Illustration of wavelet decomposition of an EEG segment.
Table 2.1 EEG rhythmic bands and the corresponding wavelet filter frequency bands
(sampling rate fs=400Hz).
EEG patterns (delta) θ(theta) α(alpha) β(beta)
Rhythmic bands (Hz) 1~4 Hz 4~8 Hz 8~13 Hz 13~25 Hz
Wavelet detail component (Di)
D7 D6 D5 D4
2.3.2 Sub-Band Power
To illustrate the EEG evolution during the entire session, the percentage of wavelet
sub-band power in each rhythmic band pj
l was depicted by different shades of gray andcalculated as followed:
L4 sub-band power feature matrix V’that is expressed by
T L v v v[0], [1], , [ 1] V , (7)where v[l] is the new (14) feature vector of the lth EEG epoch:
l
v4[l],v5[l],v6[l],v7[l]
v . (8)
Elements in v[l] are derived from v[l] in (4) and (5) by
[ ]100 %, 4 7 k v l v l v t k k , where (9)
7 4 ] [ k k t v l v (10)The result was filtered twice by a low-pass, order 10, and moving average filters with
impulse response hs[n] to smooth the jiggling, where
11 10 0
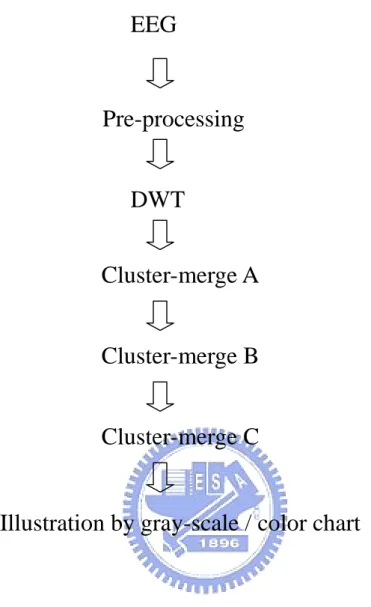
k k n n hs (11)Figure 5(a) Block diagram of FCM-merging strategies, the flowchart of cluster-merge A~C
are illustrated in Figure 5(b)~(d).
2.3.3 FCM clustering
Automatic interpretation algorithm often involves three strategies: (1) derivation of
feature basis, (2) feature clustering, and (3) scoring (interpretation) based on the feature
clusters [91]-[93]. Feature extraction aims at transforming the input data into a form
(feature vector) appropriate for the clustering algorithm to identify the clusters. The feature
Pre-processing
EEG
DWT
Cluster-merge A
Cluster-merge B
Illustration by gray-scale / color chart
Cluster-merge C
vector in this study is derived from wavelet coefficients. Each feature vector, after
processed by the FCM, introduced by Bezdek JC, belongs to a cluster to some degree that is
specified by a membership matrix [94]. According to our experience in EEG feature
classification, conventional FCM algorithm, without the background knowledge of EEG
characteristics, cannot effectively classify and interpret the EEG record in comparison with
the naked-eye examination. We thus developed a novel approach, with three
cluster-merging strategies, for the meditation EEG analysis. The main attribute is its
knowledge-based processing of EEG record that is encoded into an easily comprehensible
chart of meditation scenario. Figure 5(a) illustrates the overall strategy developed according
to our experiences on meditation EEG characteristics. The FCM-merging strategies
involving three cluster-merging subroutines (Figure 5(b), 5(c), and 5(d)) are designed
particularly to solve the problem of blind clustering by simple FCM algorithm.
Cluster-merge A (Figure 5(b)) mainly determines the number of clusters (K) by the criterion
of cluster-center distance (Dij). Note that the number of clusters is often initialized to be
larger than that required. Further processing of clusters thus does not involve splitting.
Cluster-merge B (Figure 5(c)) eliminates those clusters characterizing transient activities.
Finally, cluster-merge C (Figure 5(d)) assigns different clusters, actually representing the
same EEG rhythm with amplitude fluctuation, to be the same one. We first describe the
i=1,…,K}, and (3) the EEG coding vector (row matrix) S. Four steps in the FCM function
are depicted below.
Step 1: Initialize the membership matrix U with random values between 0 and 1. The size
of U is KL, where K is number of clusters, and L is the number of input feature
vectors. The element of membership matrix U, uij, is the probability that the jth
feature vector belongs to the ith cluster (1iK and 0jL1). Note that, for a given feature vector, summation of degrees of belongness equals unity. Elements of U
must satisfy the constraint below
1 0 , 1 1
u j L K i ij . (12)Step 2: Calculate fuzzy cluster centers for all K clusters according to
K i u u j v c L j ij ij L j i
1 , 1 0 1 0 , (13)where v[j] is the feature vector (14 row vector) derived from wavelet coefficients defined in equation (5).
Step 3: Compute the cost function defined below
K i L j ij m ij i K i K J u D c c c J U, 1, 2,..., 1 1 10 2, (14) where Dij ci
j (15)The weighting exponent, m, in (14) is selected to be m=2. The criterion requires J to
be as small as possible. The iteration terminates if improvement of J over previous
iteration is below a pre-specified threshold. Otherwise, the algorithm proceeds with
next step to update the membership matrix U.
Step 4: Compute a new membership matrix U whose element uijis adjusted by
1 0 , 1 , 1 1 1 2
i K j L D D u K k m kj ij ij . (16)According to the above equation, uijis inversely proportional to the squared distance
from the feature v[j] to the cluster center ci.
The iteration process from Step 2 to Step 4 continues.
2.3.4 FCM-merging strategies
The FCM function described above blindly classifies the EEG patterns based on
quantitative features. Consequently, the result of interpretation often appears to be away
from satisfaction. We accordingly developed sophisticated cluster-managing strategies, the
FCM-merging strategies, based on background knowledge of meditation EEG
characteristics, for achieving an interpretation closer to the result of naked-eye examination.
We first generate a 1L long-code row vector matrix, S={sj, 0jL1}, representing the
the particular cluster to which the jth feature vector belongs, 1sj K. It is determined by
finding the row index i (denoted by sj) such that
iji j
s u
u
i max , 1iK, considering the jth
feature vector.
Figure 5(b) Flowchart of cluster-merge A
For 1i K & i+1j K
K>2
Yes
No
D
ij= ∥c
ic
j∥
D
ij<D
th,1Yes
No
K
K1
FCM
Initialize K
Output
K, U, S, {c
i, i=1
…K}
In the cluster-merge A subroutine (Figure 5(b)), number of clusters (K) is justified by
having the inter-distance between cluster centers (Dij) no less than a pre-specified threshold
Dth,1. Four outputs available are: number of clusters (K), membership matrix (U), EEG
coding vector (S), and the cluster centers {ci, 1iK}, of which only K and S feed into the
cluster-merge B subroutine (Figure 5(c)). Based on the coding vector S, cluster-merge B
first analyzes the maximum length of code-k feature (1kK), max-lsk. The length of code-k
feature (lsk) denotes the number of consecutive code k’s.Consideran exampleofthree
clusters (K=3) obtained by analyzing 18 feature vectors (L=18). Assume the coding vector
generated by cluster-merge A is:
S = {1 1 3 3 3 3 3 2 2 1 1 1 3 3 3 3 2 2}, (17)
we then obtain three sets, each containing the segment lengths of code-k feature (1k3):
ls1= {2 3}, ls2= {2 2}, ls3= {5 4}. (18)
All the numbers in the K sets are accordingly summed up to be L. From (18), the maximum
length of code-k feature is: max-ls1=3, max-ls2=2, and max-ls3=5. If Dth,2=3, cluster-merge B
subroutine will decrease K by 1 since
sk
k maxl
min =2 < Dth,2. Otherwise, the last merging
subroutine follows. After the operation of cluster-merge B, the value of K is more
substantial and practical. The coding vector S is then derived using the final K’s,and both
complicate the result.
Figure 5(c) Flowchart of cluster-merge B
In EEG, considerable variation in amplitude often obscures identification of certain
rhythmic pattern. For instance, FCM function tends to output multiple clusters forrhythm
classified according to the squared wavelet coefficients. This situation also occurs toand
<
D
th,2K>2
Yes
No
Yes
No
K
K1
K and S
max-l
sk: maximum length of
code-k feature 1k K
FCM
K and S
Output
K, U, S, {c
i, i=1
…K}
sk
kmax
l
min
rhythms. Cluster-merge C subroutine hence reexamines and corrects the fault by computing the subband power ratios according to equation (7)~(10).Based on the modified
feature matrix V, FCM function outputs a set of new cluster centers {ci, 1iK}. If cluster
j has a center cjclose enough to the center of cluster i (i.e., Dijcicj Dth,3), the coding vector S (output of cluster-merge B) will be modified by re-encoding cluster j as
cluster i. In this way, different clusters actually containing feature vectors of the same EEG
rhythm (e.g., or ) are to be identified and interpreted as the same one via an adequate
choice of Dth,3. It is noted that if the sub-band power ratios are employed in the very
beginning (cluster-merge A), clustering performance is incorrigibly poor due to failure in
separating different EEG rhythms. That is, cluster-merge C does not innovate upon the
coding vector S. Instead, it re-indexes those clusters, all referred to the same EEG rhythm,
by the same code.
In meditation EEG study, the range 2K5 is a moderate selection according to our experience in meditation EEG interpretation. However, there always exists inter-subject
variation in biomedical signals. Our algorithm thus begins with a large value of K (normally,
K=9) and, through the cluster-merging subroutines succeeded, further refines the
interpreting results.
The FCM-merging strategies, systematically and effectively encoding the quantitative
range of mother wavelet prototypes can be used without changing the interpreting result
should the wavelet duration be long enough. For instance, mother wavelets like the db3,
db5, db10, sym3, and sym5 generated by MATLAB result in the same interpretation
although the feature vectors derived midway are slightly different. We thus employed the
mother wavelet db5 in consideration of computational efficiency.
Figure 5(d) Flowchart of cluster-merge C
For
1i K &i+1j K
K>2
Yes
No
D
ij= ∥c
i
c
j
∥
D
ij
< D
th,3Yes
No
Modify S
cluster i
cluster j
Continue
K and S
2.3.5 Hurst exponent
The features of beta rhythm are relatively small using time-domain and
frequency-domain analyses. Beta rhythm is a low-amplitude wave with higher frequency
contents compared to other EEG rhythms, and is often embedded in other higher amplitude
rhythms such as alpha rhythms. Some beta rhythms are often misclassified as base-line
drifts and low-amplitude alpha rhythms when using the quantitative features derived from
the normal time- and frequency-domain analyzing methods.
This section described a novel algorithm for identifying beta rhythms. Two major
strategies of the algorithm are: (1) EEG feature extraction based on estimate of the Hurst
exponent, H, and (2) computation of the linear-regression line fitting error. The Hurst
exponent, H, is the parameter of fractional Brownian motion (fBM) modeling the 1/f
process. Some papers have already discussed the possibility of applying H to the
biomedical signals to extract particular features and to detect specified components [95].
However, to the best of our knowledge, the application of H to EEG data has never been
examined. Wornell and Oppenheim proposed a method to estimate H via
wavelet-decomposed coefficients, which makes the calculation of H more straightforward
and efficient [96]-[97].
The proposed method, H-SSE based algorithm, estimates H and the regression fitting
nonlinearly rescales the EEG rhythms to magnify the feature space of beta rhythms that has
been infeasible in the time-domain and frequency-domain analyses. In addition, the
algorithm is capable of distinguishing low-amplitude alpha and beta rhythms from complex
EEG segments with vaguely defined patterns. The procedures are as following:
At first we extract EEG wavelet features as equation (1) to equation (3).Then take the
logarithms of variance of the detailed-part coefficients,
d n
yj log2 var j , j=4–7, (19)
As shown in Figure 6, the slope (d) of the linear regression line fitting the yj-versus-j
data points provides an estimate of H; that is,
1 H 2 d (20)
Finally, SSE is evaluated below
7 4 2 ˆ SSE j j j y y , (21)where yˆj is the interpolation point on the regression line.
The window length is also 2 seconds with a moving step of one second for the
consecutive, long-term EEG analysis. From the definition of H and SSE, we expect that
EEG theta and alpha rhythms would have higher regression errors, and result in a higher
SSE value for the corresponding wavelet scale levels 6 and 5 that are located in the middle
opposite sign of H.
Figure 6 Chart of H&SSE pairs calculation.
2.3.6 Alpha-suppressed EEG identification
The powers of detail component of the scale ranging from 5 to 8 correspond to the
beta, alpha, theta, and delta for sampling rate 1000 Hz EEG is similar to equation (4)
1
,
4
,
5
,
6
,
7
1 2
d
i
k
n
l
v
nk i k k k (22)To be qualified as an alpha-suppressed EEG component, four power values are required
encode the state of alpha in a given segment, and
l 1,Low when vk
l kk, 5,6,7,8, otherwise Low
l 0 . (23)The segment length code S of alpha-suppressed EEG Low can be calculated as the
following example. Given
Low=[0 0 1 1 1 1 0 1 1 1 1 1 0 1 1 0 1 1 1 1 1 1 1 1 ]T, (24)
we then have four alpha-suppressed segments of lengths 4, 5, 2, and 8 (in number of epochs,
in this case that is also in number of seconds). Let vector S be the row matrix of which the
elements are the corresponding lengths of alpha-suppressed segments identified. It becomes
S =[4 5 2 8]T. (25)
Two parameters are defined in this paper to evaluate the significance of low-power EEG
contents [19]; one is the total length of low-power EEG segments
ls i total S i S 1, where ls is the length of S , (26)
and the other is the maximum length of the continuous alpha-suppressed EEG segments in
each single subject
Smax=max{S} , (27)
used to characterize the alpha-suppressed EEG for one subject.
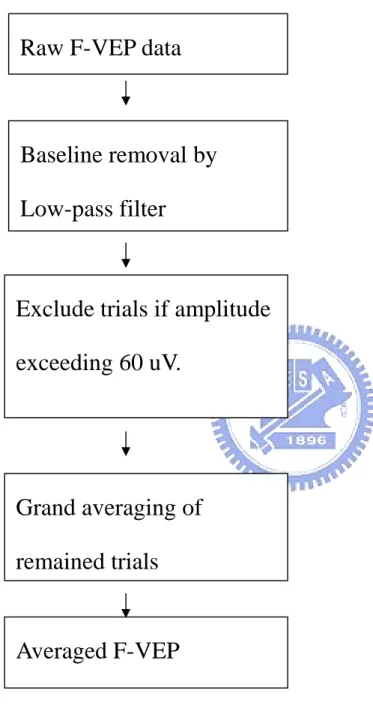
Figure 7 F-VEP preprocessing algorithms
2.3.7 VEP waveform feature extraction
Firstly, each raw trial was baseline-calibrated by subtracting the value computed from
Baseline removal by
Low-pass filter
Exclude trials if amplitude
exceeding 60 uV.
Grand averaging of
remained trials
Raw F-VEP data
the average of the 200 ms interval before stimulus onset. Furthermore, trials with absolute
peaks > 60 uV were excluded. The F-VEP was estimated by averaging total 50 trials, which
had been preprocessed by previous procedure. Figure 7 illustrates the F-VEP preprocessing
algorithms.
Figure 8 demonstrates the F-VEP map
-20.4 -10.2 0 10.2 20.4
T
ri
a
ls
Oz
10 15 20 25 30 35 40 45 50 0 100 200 300 400 500Time (ms)
-23.1 23.1V
E
P
N2
P2
Figure 8 demonstrates the F-VEP map made by stacking all the trials and transforming
the F-VEP magnitudes into gray intensities for 2D grayscale image display. The bottom of
Figure 8 is the averaged F-VEP pattern (Figure 8 was implemented by the software
EEGLAB developed by Delorme A and Makeig S [100]). This map reveals that N2 and P2
Chapter 3 RESULTS
3.1 Health Survey
3.1.1 Experiences of Zen practitioners.
In the bin surveyed, the mean length of Zen-Buddhist practice is 7.1 years (std=5.4).
The histogram of practicing length (number of years) appears to be an evenly distributed
statistics in the experimental group. The average practicing frequency is 5.3 times (std=3.7)
per week.
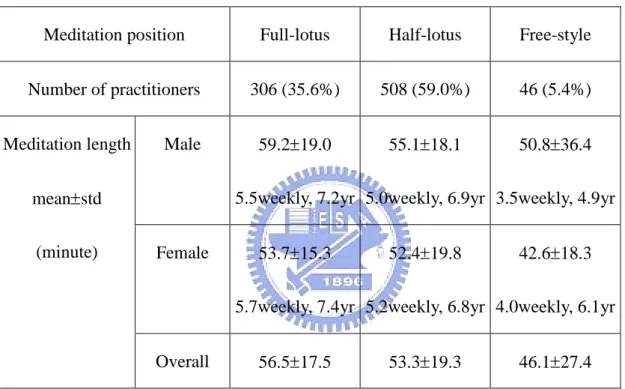
Note that, when practicing Zen-Buddhist meditation, the practitioners may sit in the
full-lotus, the half-lotus, or the free-style position. In the bin of 860 experimental subjects,
the distribution of the possible meditation durations is summarized in Table 3.1 for each
meditation position. The possible meditation duration refers to the estimated length of each
meditation session. The weekly practicing frequency and the number of practicing years are
shown under the value of meditation duration, as a reference, for different meditation
positions. A larger range of deviation is observed for the group of free-style meditation that
is found consisting of practitioners with less experience. In other words, the accumulation
of meditation experience improves the flexibility of muscles and bones so that more
frequency reflects the diligent habit of Zen meditation. Apparently, regularity and
frequency have significant effect on the improvement of meditation posture.
Table 3.1 Distribution of the meditation lengths for each meditation position from survey
result.
Meditation position Full-lotus Half-lotus Free-style
Number of practitioners 306 (35.6%) 508 (59.0%) 46 (5.4%) Male 59.219.0 5.5weekly, 7.2yr 55.118.1 5.0weekly, 6.9yr 50.836.4 3.5weekly, 4.9yr Female 53.715.3 5.7weekly, 7.4yr 52.419.8 5.2weekly, 6.8yr 42.618.3 4.0weekly, 6.1yr Meditation length meanstd (minute) Overall 56.517.5 53.319.3 46.127.4
We also surveyed the frequency of smoking and drinking alcohol among the 860
experimental subjects. Only 10.5 percent of the subjects are smokers, yet, half of them
smoke infrequently. This rate is significant lower than that of the smoking population in
Taiwan (male: 39.2 percent, female: 3.3 percent). Respecting the drinking survey, 66.8
Only approximately 4 percent of the subjects have the lifestyle of regular drinking.
According to our survey, more than 8 percent of the populations in Taiwan have the
problem of alcohol abuse. As a consequence, Zen-Buddhist practice leads to a much
healthier lifestyle. As a matter of fact, it has been reported that meditators achieved the
following biological reactions: marked reduction in oxygen use, notably lower secretion of
stress hormones, increase in immune factors, reduction of anxiety, reduction of chronic pain,
etc [4]. The report might provide a strong reasoning for our results of healthy living habits
among meditation practitioners.
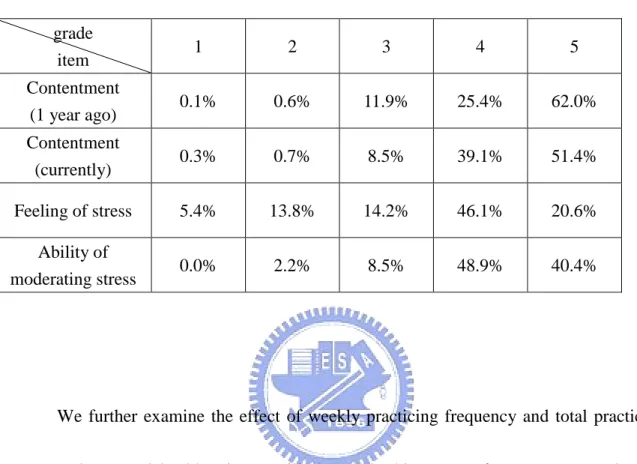
3.1.2 Psychological and mental health of the experimental subjects.
Table 3.2 depicts the results of the everyday condition of the frame of mind,
according to the self evaluation by the 860 experimental subjects. Note that the value of
grade ranging from 1 to 5 scores the condition varying from the worst to the best, with the
mid-value (grade=3) indicating the normal, average condition. In other words, better mental
health is quantified by a higher grade for all the cases. More than 90 percent of the
practitioners feel content and happy in their daily lives. Less than 20 percent feel the life
stress. Most practitioners (~90 percent) are well capable of moderating the occasional
Table 3.2 Survey results of self evaluation of the daily frame of mind (experimental
subjects). Grade ranging from 1 to 5 indicates the condition varying from the
worst to the best.
grade item 1 2 3 4 5 Contentment (1 year ago) 0.1% 0.6% 11.9% 25.4% 62.0% Contentment (currently) 0.3% 0.7% 8.5% 39.1% 51.4% Feeling of stress 5.4% 13.8% 14.2% 46.1% 20.6% Ability of moderating stress 0.0% 2.2% 8.5% 48.9% 40.4%
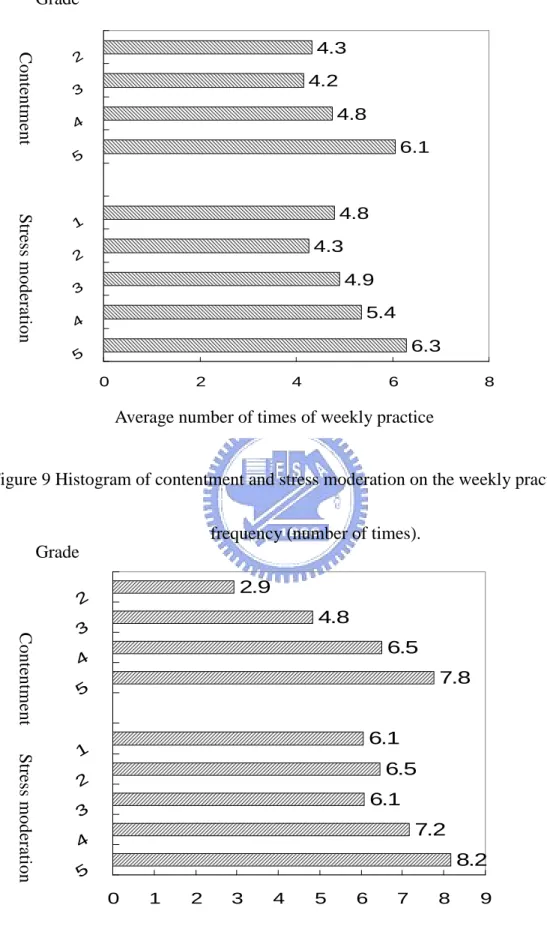
We further examine the effect of weekly practicing frequency and total practicing
years on the mental health. Figure 9 illustrates the histogram of contentment and stress
moderation on the weekly practicing frequency (number of times) that, obviously,
demonstrates a positive correlation between the mental health and the practicing frequency.
Similar trend is observed in the histogram of Figure 10 based on the number of practicing
years. Nevertheless, we found that, to be totally released from the feeling of daily-life stress,
most practitioner spent more than seven years in the intense and highly devoted
Zen-Buddhist practice. As addressed in the Diamond Sutra [98], to disclose the enlightened
wisdom, a Zen-Buddhist disciple should be detached, that is, without regard to appearances,
Figure 9 Histogram of contentment and stress moderation on the weekly practicing
frequency (number of times).
Figure 10 Histogram of contentment and stress moderation on the practicing years.
6.3 5.4 4.9 4.3 4.8 6.1 4.8 4.2 4.3 0 2 4 6 8 5 4 3 2 1 5 4 3 2 Grade C o n te n tm en t S tr es s m o d er at io n 8.2 7.2 6.1 6.5 6.1 7.8 6.5 4.8 2.9 0 1 2 3 4 5 6 7 8 9 5 4 3 2 1 5 4 3 2 Grade C o n te n tm en t S tr es s m o d er at io n
Average number of times of practicing years Average number of times of weekly practice
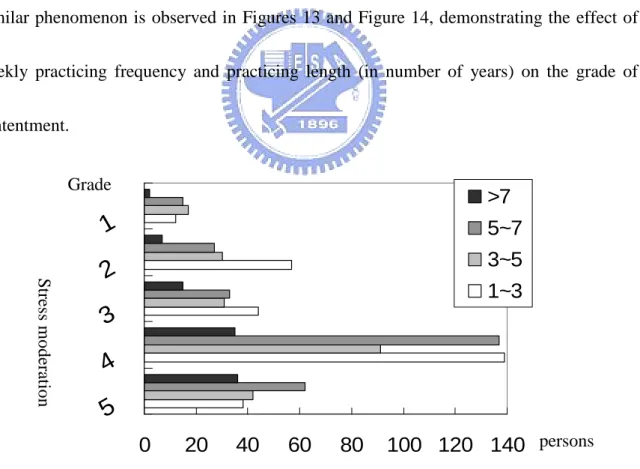
Figure 11 displays the histogram h(sg)=ng, where 1sg5 denotes the grade of ability
of moderating the stress feeling, and ng is the number of experimental subjects who are in
the group of stress-moderation grade = sg. Different gray-colored bars are used to illustrate
the histogram of a group who practice the Zen-Buddhist meditation in a similar weekly
frequency. For example, the white-colored (black-colored) bar illustrates the number of
subjects that practice 1-3 (>7) times per week. It appears that the practicing frequency does
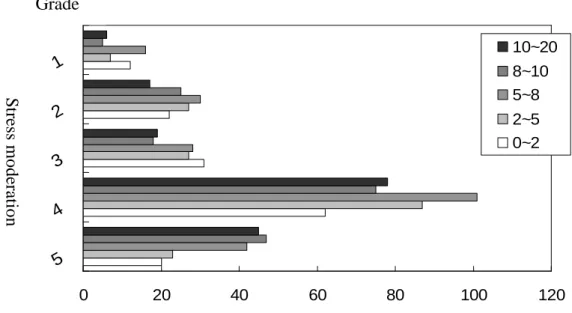
little good to help the stress problem. On the other hand, as shown in Figure 12, length of
meditation practice shows significant impact on improving the stress-moderation ability.
Similar phenomenon is observed in Figures 13 and Figure 14, demonstrating the effect of
weekly practicing frequency and practicing length (in number of years) on the grade of
contentment.
Figure 11 Histogram of stress moderation on the number of experimental subjects under the
same stress moderation grade. Different bar colors are used to identify various
0
20
40
60
80
100 120 140
5
4
3
2
1
>7
5~7
3~5
1~3
Grade S tr es s m o d er at io n personsFigure 12 Histogram of stress moderation: distribution of the number of experimental
subjects under the same stress moderation grade. Different bar colors are used to
identify various lengths of meditation experiences (in number of years).
Figure 13 Histogram of contentment of various weekly practicing frequencies.
0 20 40 60 80 100 120 5 4 3 2 1 10~20 8~10 5~8 2~5 0~2 Grade S tr es s m o d er at io n
Number of experimental subjects (person)
0 40 80 120 160
4
3
2
1
>7 5~7 3~5 1~3 Grade C o n te n tm en tFigure 14 Histogram of contentment: distribution of the number of experimental subjects
under the same contentment grade. Different bar colors are used to identify various
lengths of meditation experiences (in number of years).
3.1.3 Physiological health conditions in the experimental group.
According to the 2002 statistical data provided by the Bureau of National Health
Insurance in Taiwan [82], the average number of outpatient services requested by each
person was 14.52 based on population 21,869,478 and that was 4.6 for the experimental
group based on the bin of 860 samples surveyed. Table 3.3 lists the statistics of HIC
applications in the experimental group during the year of 2002. The average HIC
applications in the experimental and control groups of different ages and genders are
plotted in Figure 15 and listed in Table 3.4. Note that the number of using the HIC
0 20 40 60 80 100 120
4
3
2
1
10~20 8~10 5~8 2~5 0~2 Grade C o n te n tm en trepresents the number of attending a hospital or a clinic. Apparently, deviation between the
control group and experimental group is more significant as age increases. This observation
demonstrates that Zen meditation practice has long term effects on health. And we might
probably infer that the aging process slows down.
Figure 15 The average HIC applications in the experimental and control groups of different
ages and genders (blank bar: EXP_male, shaded bar: EXP_female, triangle:
CTRL_male, square: CTRL_female.
Table 3.3 Statistics of HIC applications in the experimental group of 860 subjects. HIC usage (times) 0 1 2 3 4 5 6-10 11-15 >15 % of 860 subjects 21.7 11.3 13.3 8.0 6.7 4.0 26.6 3.5 5.0
0
5
10
15
20
25
15~29
30~39
40~49
50~59
60~75
EXP_male
EXP_female
CTRL_male
CTRL_female
A v er ag e H IC Age group
Table 3.4 The average HIC applications in the experimental and control groups of
different ages and genders. Age range (years) group of subjects 15-29 30-39 40-49 50-59 60-75 Male 8.02 9.41 11.17 14.00 20.54 Control group Female 10.80 12.61 13.75 17.49 22.46 Male 3.09 2.69 4.19 6.74 5.95 Experimental group Female 4.23 4.47 4.44 5.23 8.80
Table 3.5 lists the results of investigating the effects of meditation qualities and
experiences on the average HIC applications. The following comments are based on the
hypothesis that the average number of HIC applications is relevant to the health condition.
Part (i) manifests that increasing the weekly practicing frequency up to 7 times (that is,
once per day) results in the optimal health state. According to (ii), practitioners already saw
great improvement in their health when they were able to meditate for approximately one
hour each time. Regarding the effect of meditation posture as shown in part (iii), significant
reduction in the average HIC applications (2.8/3.5 for male/female) is observed in the
particular subset (the full-lotus column) have more than seven years of meditation
experiences and practice more than five times per week. It might be due to their diligence
and intensive practice that enable the practitioners to sit in the full-lotus position. On the
other hand, the full-lotus position is the optimal meditation posture for pushing the
physiological and mental activity into the state of transcendental consciousness.
Notice that the average number of HIC applications highly correlates with the
subjective evaluation of grade of contentment and stress moderation. As demonstrated in
(iv) and (v) of Table 3.5, practitioners in the higher grade subsets significant reduce the use
of HIC.
Figures 16 and 17 illustrate the effect of weekly practicing frequency and total
practicing years on the physiological health graded by self evaluation. The value of grade
ranging from 1 to 5 scores the condition varying from the worst to the best, with the
mid-value (grade=3) indicating the normal, average condition. The result of grade=1 is not
shown because very few subjects are within this cluster that makes the statistical analysis
biased. Evidently, the number of practicing years is a core factor in promoting health.
Having been practicing for more than five years, most practitioners feel themselves much
Table 3.5.Average number of HIC applications for various meditation experiences of the
experimental subjects.
(i) Correlation between weekly practicing frequency and average number of HIC
applications Weekly practicing
frequency (times) 1-3 3-5 5-7 >7
Average HIC
(male / female) 4.1 / 5.2 4.9 /4.9 3.9 /4.7 3.8 /4.2
(ii) Correlation between meditation duration and average number of HIC
applications Meditation duration
(minutes) 30 30-50 50-80 >80
Average HIC 6.6 5.4 4.4 6.6
(iii) Correlation between meditation posture and average number of HIC applications
Meditation posture Free style Half lotus Full lotus
Average HIC
(male / female) 5.2 /10.7 5.1 /5.2 2.8 / 3.5
(iv) Correlation between contentment grade (by self evaluation) and average number of HIC applications
Grade of contentment 5 4 3
Average HIC 4.3 5.1 5.5
(v) Correlation between grade of stress moderation (by self evaluation) and
average number of HIC applications Grade of stress
moderation 5 4 3 2
Figure 16 Effect of weekly practicing frequency on the physiological health graded by self
evaluation.
Figure 17 Effect of total practicing years on the physiological health graded by self
evaluation. Grade H ea lth co n d iti o n
Average number of times of weekly practice
Grade H ea lth co n d iti o n
Average number of times of practicing years
7.9
7.1
5.5
3.9
0
5
10
5
4
3
2
5.7
5.3
4.8
5.6
4 4.5 5 5.5 65
4
3
2
3.2 EEG alpha blocking during Zen meditation
As addressed in the Introduction, bursts of high-frequency beta (above 20Hz) were
observed when the meditation practitioners entered into deep meditation. In our meditation
EEG recordings, a few subjects even had significant beta activity from the beginning of
meditation. This phenomenon aroused our interest in further investigating the potential
mechanism. After performing a few studies on different subjects, however, we noted a
significant correlation between perception of the inner light and alpha blockage. Subject A,
a healthy 48-year-old man, had been practicing orthodox Zen Buddhism for more than 11
years. While meditating with eyes closed, his EEG was mainly characterized by slow-alpha
(8~9 Hz) activity. A close examination showed that a tiny, high-frequency beta jiggling
mingled in the alpha rhythms. When subject A signaled the event of perceiving the light,
alpha blocking occurred and the EEG turned into low-amplitude beta (Figure 18). Subject B
was a healthy 40-year-old female who had been practicing Zen-Buddhist meditation since
1994. Since one year after the meditation practice, she had never fallen ill. Like most
Zen-Buddhist practitioners, she had an appearance and physiological status ten-years
younger than her age. Her EEG in meditation switched between low-frequency (8Hz), high-power alpha and global beta activities, with larger amplitude in the frontal regions (F3,
F4). As illustrated in Figure 19, there always occurred alpha blocking after signaling of
Figure 18 EEG segment of subject when perceiving the light.
Our experiment encountered one major difficulty— missing signals from the subjects.
This is comprehensible since the subject when in the meditating state beyond normal
consciousness often 'forgets' the experimental protocol. In these circumstances, the EEG
events cannot be correlated with the meditation process via subjective expression. Overall,
alpha blocking always accompanied the signaling of light perception by experimental
subjects. On the other hand, we might observe alpha blocking without a preceding signal
Figure 19 Three EEG segments reflecting the effect of perceiving the light
3.3 Blessing --significant alpha blocking EEG during blessings
During the blessing period, significant alpha blocking was observed in experimental
subjects (C and D) and the sub-band powers of EEG during blessing are shown in Figure
Figure 20 Running power-percentage analysis for the blessing EEG data. 0% 20% 40% 60% 80% 100% blessings