國 立 交 通 大 學
資訊管理研究所
碩 士 論 文
整合顧客價值之客戶終身價值(LTV)模式: 零售市場之應用
An LTV Model based on Integrated Aspects of Customer’s Value:
An Application in the Retail Markets
研 究 生: 陳詩瀅
指導教授: 劉敦仁 博士
整合顧客價值之客戶終身價值(LTV)模式: 零售市場之應用
An LTV Model based on Integrated Aspects of Customer’s Value:
An Application in the Retail Markets
研 究 生: 陳詩瀅 Student: Shih-Ying Chen
指導教授: 劉敦仁 Advisor: Dr. Duen-Ren Liu
國立交通大學 資訊管理研究所
碩士論文
A Thesis
Submitted to Institute of Information Management College of Management
National Chiao Tung University in Partial Fulfillment of the Requirements
for the Degree of Master of Science in Information Management
July 2006
Hsinchu, Taiwan, the Republic of China 中華民國 九十五 年 七 月
整合顧客價值之客戶終身價值(LTV)模式: 零售市場之應用
研 究 生: 陳詩瀅 指導教授: 劉敦仁 博士 國立交通大學資訊管理所摘要
顧客關係管理,長久以來被大多企業視為相當重要的管理理念,而其在行銷領域中 尤其重要。現今企業有著共同的使命:實現成功且長期之顧客關係管理;又多數的企業 認為:瞭解且能夠認知消費者的行為為達到此一共識之第一步驟,因此掌握顧客消費行 為實為不可缺少的一環。過去,在顧客關係管理方面之研究有著相當多的方法來評估現 今顧客對於企業之價值,包括運用人口統計學以及 RFM 等。不過,卻鮮少有研究將顧客 價值以整合性之觀點做分析探討。 本研究整合統計顧客過去之購買行為、WRFM 模式以及分析顧客對於企業之潛在價 值提出了 LTV 模式,以能夠更精準的掌握顧客關係管理。另外,本研究亦利用 LTV 值之 結果將原有之顧客做分群並且預測未來各族群顧客對於企業的貢獻度。同時,也提供了 管理者在執行目標顧客群的行銷決策上,有著更敏銳之洞察力。 關鍵字: 顧客價值、客戶分群、市場區隔、資料探勘An LTV Model based on Integrated Aspects of Customer’s Value:
An Application in the Retail Markets
Student: Shih-Ying Chen Advisor: Dr. Duen-Ren Liu
Institute of Information Management National Chiao Tung University
Abstract
CRM, considered as a criterion in the field of marketing, has long been a topic of concern for most organizations. Most industries nowadays realize the importance of recognizing and understanding customers’ behavior, since it is the first step towards achieving a successful long-term customer relationship management, a mission shared by myriad enterprises. Many researches have focused on varied ways of performing LTV calculation, including demographic data analysis, customer’s current value, but few have done analysis based on an integrated viewpoint of their lifetime value.
In this paper, we proposed an LTV model that integrates past customers’ buying behavior with demographic variables, WRFM method, and potential value. We also performed market segmentation based on the results of the LTV values. The entirety of the proposed approach will provide a dominant influence in predicting clients’ future level contributions, and give managers a deeper insight when developing marketing strategies for targeted customers
Acknowledgements
First of all, I would like to thank my adviser Dr. Duen Ren Liu, for all the support and helpful advices for completing this thesis. As a great mentor, his encouragement has deeply contributed not only to my academic dissertation, but more importantly, to that great faith that I will always keep in my mind.
Secondly, a great thanks to all DBIS lab members: my Seniors Ya-Yueh, Clay, Nancy, Wei-Xiao and Chin-Hui. Another thank to Hsu-Chia, Amigo, Pei-Cheng, Sofya, and all the juniors who altogether contribute to this splendid environment in NCTU. I would also like to thank the whole NCTU GBT team for being with me throughout all my difficult times.
Finally, I am deeply grateful to my parents. Their boundless support has always given me the strength and motivation that I need in life.
INDEX
1. Introduction... 1
1.1 Background and Motivation... 1
1.2 Objectives... 2 1.3 Research Procedure ... 3 2. Related Works ... 4 2.1 The Definition of LTV ... 4 2.2 RFM method... 4 2.2.1 Weighted-RFM method... 6
2.3 Naïve Bayesian Classifications... 6
2.4 Potential Value ... 7
2.5 Market Segmentation ... 8
3. The Proposed LTV Model ... 9
3.1 Data Description... 10
3.2 Data Preprocessing... 10
3.3 Customer Lifetime Value Calculation ... 11
3.3.1 Past Profit Calculation ... 11
3.3.2 WRFM method ... 13
3.3.3 Potential Value ... 14
3.3.3.1 Probability Calculation: Naïve Bayesian Classifications with Demographic Data... 15
3.3.4 LTV Calculation: Integration of Past Profit Contribution, Current Value and Potential Value ... 18
3.4 Customer Clustering and Ranking... 19
4. Evaluation Results ... 21
4.1 Data Sets ... 21
4.2 Evaluation Metrics... 21
4.3 Comparing with RFM, WRFM, Past Profit Contribution, Potential Value ... 23
4.4 Definition of Customer Segmentation... 24
4.4.1 Analysis of Customer Segmentation... 24
4.4.2 Statistics of Market Segmentation... 26
5. Conclusion and Future Work... 28
List of Figures
Fig. 1. 1 Research Procedure... 3
Fig. 3. 1 Overview of proposed LTV model ... 9
Fig. 3. 2 Ranking with LTV method ... 20
Fig. 3. 3 Result of Cluster Rankings ... 20
Fig. 4. 1 Result of Customer Segmentation... 24
Fig. 4. 2 Work type Distribution of cluster 0 ... 26
Fig. 4. 3 Area Distribution of cluster 0 ... 27
Fig. 4. 4 Age Distribution of cluster 0... 27
List of Tables
Table 3. 1 Selected variables from Customer Data Logs... 10
Table 3. 2 Selected variables from Transaction Logs ... 10
Table 3. 3 Transaction Records... 12
Table 3. 4 Example of WRFM score... 14
Table 3. 5 Statistics of Cosmetic buyers ... 17
Table 3. 6 Statistics of Underwear buyers... 17
Table 3. 7 Scores from three dimensions... 19
Table 3. 8 Five clusters generated by K-means method ... 20
Table 4. 1 Accuracy of Future Contribution by LTV method ... 22
Table 4. 2 Accuracy of Future Contribution by LTV method ... 22
Table 4. 3 Future Contribution by Other methods ... 23
Table 4. 4 Future Contribution by Pair-wise dimensions... 23
Table 4. 5 Classification of Customer Behavior ... 25
1. Introduction
1.1 Background and Motivation
In this booming era of technology, organizations find it substantial not only to store their business processing data, but also to organize and analyze them into useful information. As a result, the competitive environment in them has lead to an integral concept: Customer Relationship Management, a business strategy that is indispensable to businesses nowadays.
CRM consists of all processes that are related to customers. To be concise, “managerial efforts to manage business interactions with customers by combining business processes and technologies that seek to understand a company’s customers” (Kim, Suh, & Hwang, 2003). Through CRM, asides from realizing customer’s preferences and interests, we can also increase the level of customer loyalty in our company. Moreover, we will be able to create more values for customers, which is essential in realizing our competitive advantage in this era. Accordingly, it is important to realize the existing valuable customers, as quoted by Akridge & Preckel(1997), “80 % of the profits are produced by top 20% of profitable customer and 80% of the costs are produced by top 20 % of unprofitable customers”.
With the intense vying nature of the market in the future, companies need to gain deeper foundations about their loyal customers in advance, so as to develop proper market strategies to their targeted customers, and thus increase their competitive advantage and progressive profitability in the future.
1.2 Objectives
One of the core parts of CRM is to understand customers’ profitability, and retain the loyal and profitable customers (Hawkes, 2000).In this research, we have suggested a model that integrates three main dimensions that contribute to customer value: (1) their past contribution, (2) their purchase recency, frequency, average monetary and (3) their potential value. Although various methods for calculating customers’ values have been presented, few have performed an analysis on multi-aspects of its values to accurately predict their future profitability.
1.3 Research Procedure
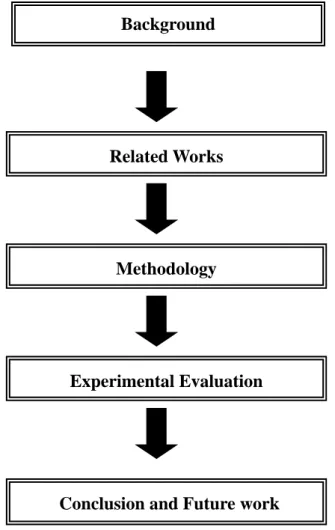
This paper is organized as follows: In Chapter 1 we defined our research objectives. Chapter 2 describes some background and reviews on previous related works. Chapter 3 illustrates a framework of our proposed LTV model. In Chapter 4, we present our experimental evaluation based on our model’s analysis. We also provide some analyses of our results for our customers’ segments. Finally, in Chapter 5, we complete this paper with remarks on conclusion and future works to our research.
Fig. 1. 1 Research Procedure Related Works
Experimental Evaluation
Conclusion and Future work Methodology
2. Related Work
sIn this section, we present some previous works related to customer life time value. We also present some backgrounds that we utilized in our research, including RFM method, Naïve Bayesian classification, potential value, and market segmentation.
2.1 The Definition of LTV
Customer lifetime value is commonly used to identify profitable customer and to develop strategies to target customers (Irvin,1994). Different methods have been used to find out customer’s value to the company, and these were done based on customer lifetime value, customer equity, and customer profitability etc. Many of the researches focused on the Present Value of customers over the lifetime of transactions, through observing the behavior of their customer (Gupta & Lehmann, 2003).Berger and Nasr(1998) defined LTV as the net profit or loss to the firm from a customer over the entire life of transactions of the customer. Pearson(1996) stated LTV as the net present value of the stream of contributions to profit that result from customer transactions and contacts with the company. Gupta and Lehmann(2003) specified LTV as the present value of all future profits generated from a customer. LTV can also be considered as the sum of revenues gained from company’s customers over the lifetime of transactions after the deduction of the total cost of attracting, selling, and servicing customers, take into account the time value of money( Hwang, Jung,Suh, 2004).
2.2 RFM method
purpose of RFM scoring is to project future behavior (driving better segmentation decision). In order to allow projection, it is important to translate the customer behavior into numbers which can be used through time.( Miglautsch,2000)
Bult and Wansbeek defined the terms as: (1) R (Recency): period since the last purchase; a lower value corresponds to a higher probability of the customer’s making a repeat purchase; (2) F (Frequency): number of purchases made within a certain period; higher frequency indicates greater loyalty; (3) M (Monetary): the money spent during a certain period; a higher value indicates that the company should focus more on that customer.
Several studies have discussed about the approaches and advantages of RFM. Goodman(1992) suggested that the RFM method avoided focusing on less profitable customers, allowing resources to be diverted to more profitable customers. Hughes (1994) proposed a method for RFM scoring that involved using RFM data concerning to sort individuals into five customer groups. Different marketing strategies could then be adopted for different customers. Stone (1995) suggested that different weights should be assigned to RFM variables depending on the characteristics of the industry.
Miglautsch(2000) ranked its customers based on their purchase behavior. The proposed method specifically turns the three vectors (R,F,M) separately into five segments each. For instance, the R value is classified by 1-3 months, 4-6 months, 7-12 months, 13-24 months, and 25 months and up, which are assigned with values of 5, 4, 3, 2, 1. After obtaining the values in the RFM, the values are added up, and if the RFM value of a certain customer is greater than the average value, the customer is considered to be an important customer.
could perform further analysis to learn about the cause and decide on the appropriate actions.
2.2.1 Weighted-RFM method
There is an advantage to finding a single variable for the RFM scores: they can be easily segmented or queried in a single field in the relational databases. In the book Libey on RFM by Donal R.Libey, the method of adding up Recency, and Frequency, and Monetary scores was suggested. Different weights are applied accordingly to the relative importance of R,F,M of each company. Liu, Shih, 2004, employed the AHP to evaluate the weighting of each RFM variable, and specifically asks decision-makers to make intuitive judgments about ranking ordering to make pair wise comparisons. The RFM values of each customer are normalized. The normalized RFM values of each customer are then multiplied by the relative importance of RFM variables, WR, WF and WM, which are determined by the AHP.
2.3 Naïve Bayesian Classifications
Naïve Bayesian Classification is a simple and statistical classifier which can predict the probability that a given sample belongs to a particular class. This classification method is based on Baye’s Theorem, a statement of the definite relationship between an event A and B even with the fact that the probability of the event A conditional on event B is generally different from the probability of B conditional on A.
The naïve method assumes the concept of class conditional independence, that the effect of an attribute value on a given class is independent of the values of the other attributes.
Naïve Bayesian classifiers are, in many cases, considered to have the minimum error rate in comparison to other classifiers, including decision tree and neural network classifiers.(Han, Kamber,2001).
2.4 Potential Value
In order to have an effective CRM, it is essential to have information on the potential value of customers. Although it is difficult to have a precise evaluation of future outcomes, we have performed an estimation based on the probability of customers’ past historical data. Reducing the uncertainty of the future is always a perceived benefit to the company. Furthermore, based on the information of potential value and realized value, managers can devise customer specific strategies.
The potential value of a customer refers to the profitability of a customer if that customer buys all purchased products or services from the supplier. By performing an analysis on customers’ historical records, companies can realize their potential clients, and invest in (potentially) valuable customers. At the same time, they can minimize their investments in non-valuable customers. Their profitability is often used as segmentation variables to distinguish between valuable and non-valuable customers (Verhoef and Bas Donkers, 2001). In the works of Kim, Hwang, Jung & Suh, potential value of customers was defined as expected profits obtained from a certain customer when a customer uses the additional services of a wireless communication company. Past researches have applied this concept in telecommunication companies. In the research, we applied this concept in the field of retail markets, shopping mall in particular.
2.5 Market Segmentation
Several clustering techniques have been applied to segment markets, including K-means, hierarchical, fuzzy, and c-means etc. K-means clustering is the one of the most well-known method (J.B. McQueens,1967) to partition data sets into different groups. This algorithm takes the input parameter k, and partitions the set of n objects into k clusters, such that the distance from data sample di to cluster kj is the minimum in all k clusters. Cluster similarity is measured in regard to the mean value of the objects in a clusters, also viewed as the “center” of the cluster kj.
3. The Proposed LTV Model
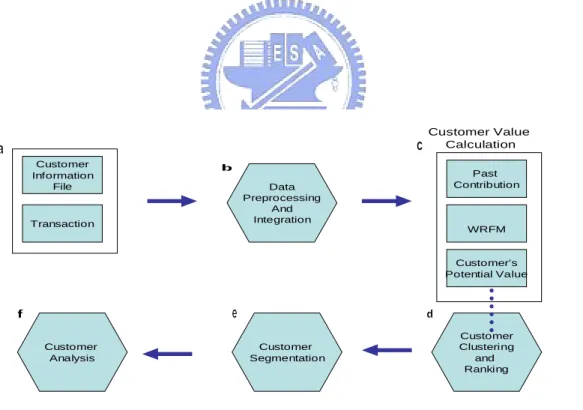
We proposed an LTV model that integrates different dimensions when calculating LTV values. In part (a), we gathered data from the company, including customer’s demographic data and transaction records. In part (b), We imported preprocessed data logs into the database, and (c) performed the LTV calculation based on different analyses, including customers’ past contribution, current value with RFM methods, and potential value, which is mainly the probability that customers will buy the determined products. In (d), we clustered all the customers into different group levels based on the results of part (c), and (e) allocated the clusters into proper market segments. Finally, we performed ranked-cluster analyses for the company. Data Preprocessing And Integration Customer Information File Transaction Customer Value Calculation Past Contribution WRFM Customer’s Potential Value Customer Analysis Customer Segmentation Customer Clustering and Ranking
3.1 Data Description
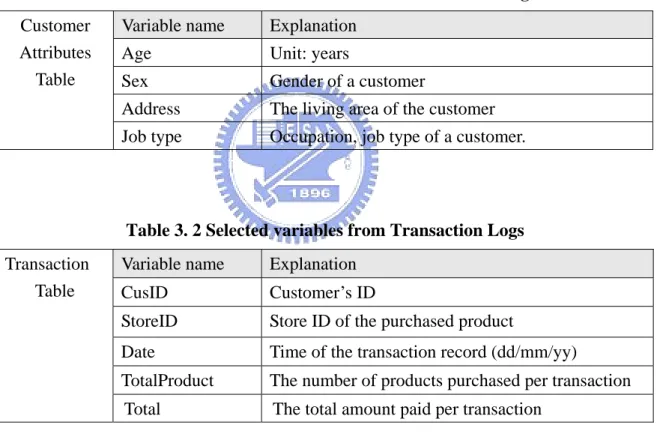
In this study, we utilized the transaction data from a department store. We employed two categories of data, including (1) socio-demographic information, and (2) customers’ transaction records. Due to the limitations of the existing company’s data, we were only able to extract basic attributes. Thus, this research will provide a beginning fundamental to the integration of the attributes under different dimensions. Tables 3.1 and 3.2 specifies the selected variables from the database.
Table 3. 1 Selected variables from Customer Data Logs
Variable name Explanation
Age Unit: years
Sex Gender of a customer
Address The living area of the customer
Customer Attributes
Table
Job type Occupation, job type of a customer.
Table 3. 2 Selected variables from Transaction Logs
Variable name Explanation
CusID Customer’s ID
StoreID Store ID of the purchased product
Date Time of the transaction record (dd/mm/yy)
TotalProduct The number of products purchased per transaction
Transaction Table
Total The total amount paid per transaction
3.2 Data Preprocessing
The extracted required data fields were imported into SQL Server 2000 for further integration of the tables. Prior to analysis, we transformed several of our data into discrete
variables, namely demographic values and variables used for RFM analysis. A hierarchy of job category was also constructed in order to improve the accuracy of our demographic statistics.
3.3 Customer Lifetime Value Calculation
As discussed in the previous section, we have proposed a method of calculating customer value, considering three dimensions: (a) past profit contribution, (b) WRFM method, and (c) potential value.
3.3.1 Past Profit Calculation
( )
1 1 n i ij j jPastProfit PastContribution Profit
= =
∑
× where, ij ij 2( )
j p PastContribution p =pij : totalnumber of purchased products in category j from customer i
pj : total number of purchases on category j
products from category j, in this case, the profit is 0.4 for underwear and 0.6 for cosmetics, as defined by domain experts. Accordingly, we obtain a precise percentage of contribution of each category from all customers.
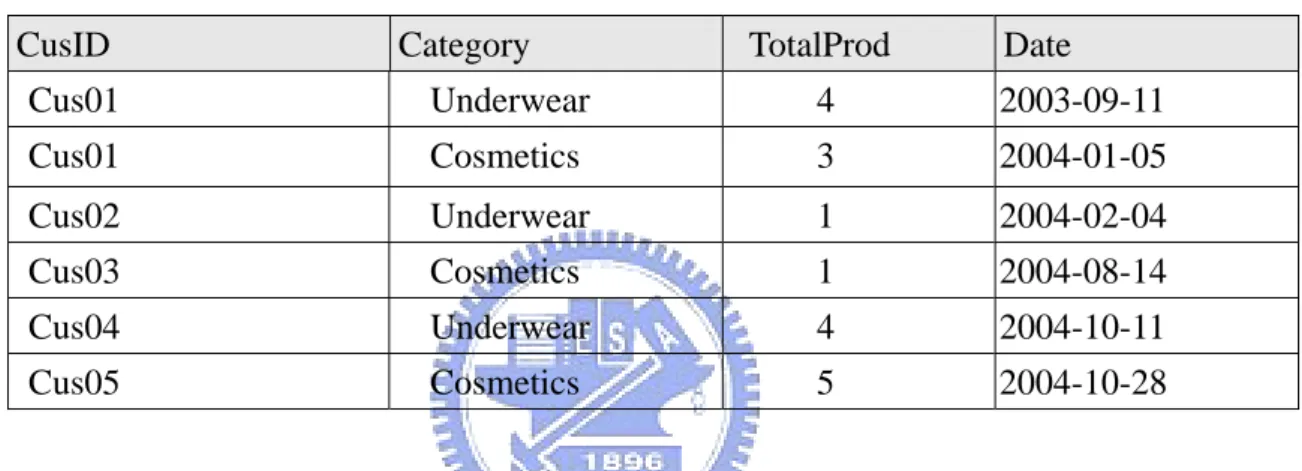
An example of past profit calculation is as follows: Transaction logs are recorded, as shown in Table 3.3. We perform two steps to calculate the past profit contribution of Cus01 and Cus02.
Table 3. 3 Transaction Records
CusID Category TotalProd Date
Cus01 Underwear 4 2003-09-11 Cus01 Cosmetics 3 2004-01-05 Cus02 Underwear 1 2004-02-04 Cus03 Cosmetics 1 2004-08-14 Cus04 Underwear 4 2004-10-11 Cus05 Cosmetics 5 2004-10-28
Step 1. Equation 2 is used to calculate the past contribution of Cus01 and Cus02 in each
category, of cosmetics and underwear.
PC Cus01, cosmetics: 4 9 PC Cus01, underwear: 3 8 PC Cus02, cosmetics: 1 9 PC Cus02, underwear: 0
Step 2. Equation 1 is used to find past profit of Cus01:
Past Profit Cus01 = 4
9 * 0.6 +
3
8 * 0.4 = 0.42
Past Profit Cus02 = 1
Hence, we perform normalization of scores. In this example, Cus01 has a past profit contribution of 0.42. As compared to Cus02, Cus01 has a greater past contribution in terms of direct profit to the company.
3.3.2 WRFM method
We used weighted RFM analysis discussed in Section 2 as our second dimension. The purpose of performing an analysis of WRFM on customers is that of acquiring a more customized equation as to evaluating up-to-date customer behaviors. In our research, the assessment obtained on weights was found from doing surveys to chief managers of the company, which consisted of topics about the comparative importance of recency, frequency, and monetary. Weights vary accordingly to the diverse nature of the enterprises. In our case, we believe that managers are extremely influential and capable of representing the company in obtaining an accurate and customized relevance of the company’s priorities in terms of their perspectives towards loyal customers.
(3)
i R F M
Score =W × +R W ×F +W ×M
A score from one to five was given to the customers’ RFM values, respectively. In our research, for the purpose of calculation, we recorded the last purchases of all customers (recency) and ranked them according to their most recent purchases, assigning a score of “five” for the top twenty percent most recent customers in the transaction database, and so forth.
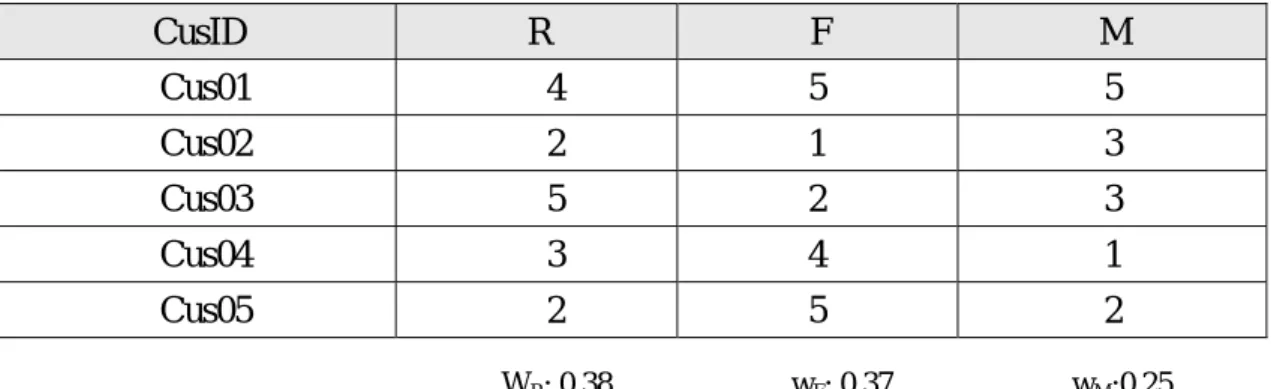
Table 3. 4 Example of WRFM score
After obtaining the scores from 1 to 5, we apply Equation 3 to find the WRFM score, as follows:
E.g: RFM Score Cus01 = 4 0.38 + 5 0.37 5 0.25× × + × = 4.62
Thus, we obtain the RFM score of 4.62 for Cus01.All scores are then normalized in the range of zero to one for further calculations in the next sections.
3.3.3 Potential Value
We applied Equation 4 to find customers’ potential value. Probij is the probability that customer i would buy the products under the two categories of j, cosmetics and underwear, specifically. We used the Bayesian Classification with attributes of customer’s demographic data, including variables as sex, age, job status, and residence area to find the buying probability of the determined attributes (Equation 5). Profit j signifies the profit ratio that the company acquires from the underwear and cosmetics department. In our research, the profit is 0.4 for underwear and 0.6 for cosmetics, also defined by domain experts.
CusID R F M Cus01 4 5 5 Cus02 2 1 3 Cus03 5 2 3 Cus04 3 4 1 Cus05 2 5 2 WR: 0.38 wF: 0.37 wM:0.25
( )
1 4 n i ij j jPotentialValue Prob Profit
=
=
∑
×The above equation practically states the expected profits that the shopping mall will receive from customers that buy their products from different categories. The expected profit is considered as the potential value in the research, which is utilized for the LTV calculation in later sections.
3.3.3.1 Probability Calculation: Naïve Bayesian Classifications with Demographic Data
The question that we desire to address is: "what is the probability that customer x will buy the products?” In Equation 5, we utilized the attributes of customers’ demographic data to find the probability that customers will buy the products (based on category). Demographic data has always taken a part in finding our targeted customers. As for a simple example, we could expect that a customer living in Taipei will be less likely to travel often to HsinChu to buy cosmetics, when compared to a customer that works in HsinChu.
(
)
(
( )
)
( )
(
)
( )
(
)
( )
1 0 | | 5 | P r o b l l l l j i j i j l i j j i l l i j i j P C A P C P A C P C A P A P C P A C = ∩ × = = = ×∑
where,( )
6( )
l j l j s P C s =and,
(
)
(
)
( )
1 | | 7 m l l i j ik j k P A C P A C = =∏
and,(
|)
8( )
l jk l ik j l j s P A C s =Probij: Probability that customer i will purchase products in category j. Ai: Attribute set of customer i
l j
s : the number of customers of class l j
C , where l = 0,1 in this case,
and class C0j= Buy category j , C1j= Not Buy category j
s: the total number of customers
l jk
s : the number of customers in class Clj having the attribute value Aik
e.g.: Attribute Aik : sex, age, location etc.
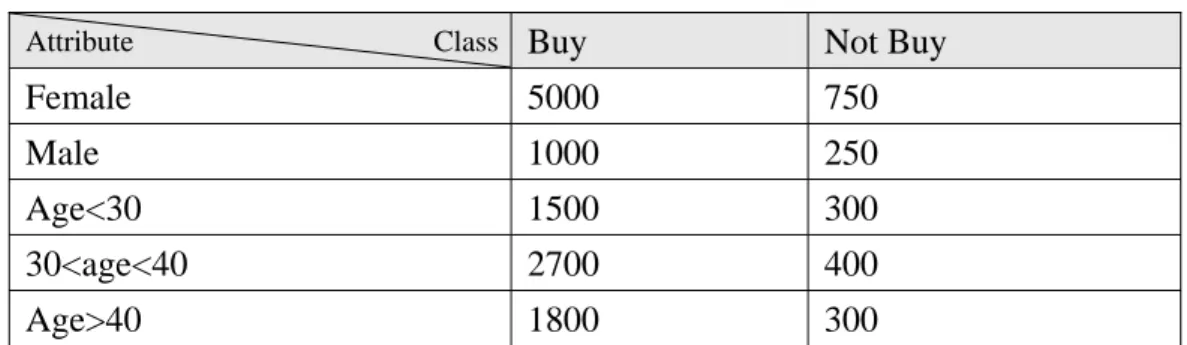
An example of potential value calculation is as follows: Demographic statistics of customers buying cosmetics and underwear are shown in Table 3.5 and Table 3.6. We perform three main steps to calculate the potential value of Cus01:
Table 3. 5 Statistics of Cosmetic buyers
Attribute Class Buy Not Buy
Female 5000 750
Male 1000 250
Age<30 1500 300
30<age<40 2700 400
Age>40 1800 300
Table 3. 6 Statistics of Underwear buyers
Attribute Class Buy Not Buy
Female 3000 2500
Male 500 1000
Age<30 1050 1400
30<age<40 1050 1225
Age>40 1400 875
Step 1. Equation 5,6,7,8 are utilized to calculate the probability that customer01 will make a
purchase in the cosmetics category:
For cosmetics,
(
)
0 0 6 = 7 co sm co sm etics s P C s = ,(
)
1 1 1 = 7 co sm co sm etics s P C s =(
0)
01| 1 1 6 4 cosmetics P A C = × ,(
01| 1)
1 3 4 10 cosmetics P A C = × 6 1 1 1 0 7 6 4 6 1 1 1 1 3 1 3 7 6 4 7 4 1 0 0 1 ,c o s m e t i c s = P r o b × × = × × + × × Step 2: Repeat the procedure in step 1, for underwear:
(
)
0 0 1 = 2 u n d erw ea r u n d erw ea r s P C s = ,(
)
1 1 1 = 2 u n d erw ea r u n d erw ea r s P C s =(
0)
01| 1 3 7 10 underwear P A C = × ,(
01| 1)
2 2 7 5 underwear P A C = × 1 1 3 3 2 7 1 0 1 1 3 1 2 2 1 1 2 7 1 0 2 7 5 0 1 ,u n d e r w e a r = P r o b × × = × × + × × Step 3: Use Equation 4 to find the potential value of Cus01:
10 3
0.6+ 0.4= 0.57
13 11
01
PotentialValue = × ×
Apparently, with this equation, we can determine the probability that Cus01, a
twenty-five year old man will buy the products. Thereby, we obtain a more comprehensive thought towards customers attribute that are associated to their probability of building continuous relationship with the company.
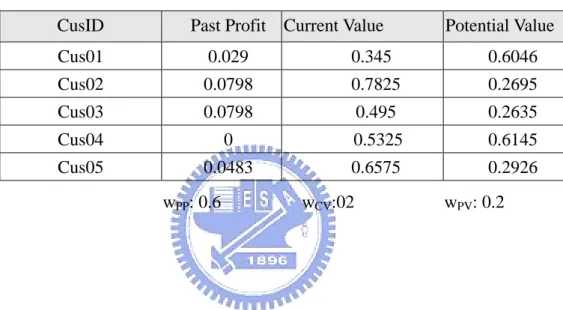
3.3.4 LTV Calculation: Integration of Past Profit Contribution, Current Value and Potential Value
After obtaining the normalized scores for the three dimensions, we applied weights to each of the dimensions with the purpose of emphasizing the relative importance of the three
factors. Table 3.7 shows the resulting scores of the three attributes before LTV calculation. LTV value for each customer was derived with Equation 9. We derived with one of the optimal weights (0.6, 0.2, 0.2) by first applying different combination of weights to testify the best results with the (a) ranking method that will be discussed in Section 3.4.
( )
9
i pp i wrfm pv
LTV =W ×Pastprofit +W ×WRFM +W ×PV
Table 3. 7 Scores from three dimensions
CusID Past Profit Current Value Potential Value
Cus01 0.029 0.345 0.6046 Cus02 0.0798 0.7825 0.2695 Cus03 0.0798 0.495 0.2635 Cus04 0 0.5325 0.6145 Cus05 0.0483 0.6575 0.2926
3.4 Customer Clustering and Ranking
Customer Value Ranking is derived in order to locate our gold customers as well as analyze the different characteristics of our customer groups, and consequently predict their future contribution to the company. Two methods are performed in LTV Ranking: (a)The customers are grouped in terms of integrated LTV score based on the three dimensions: customers with top 5 percent LTV from are given a rank of 1, top 15 percent with a rank of 2, and next 40, 70 percent etc, as shown in Fig 3.2. (b)K-means method is also applied to group customers into five clusters based on the scores of the three dimensions respectively, followed by an LTV calculation for each cluster, as shown in Equation 8. For the K-Means
the parameter m as 5, as to go in accord with the first method in the ranking process. To follow, rankings of 1 to 5 are set in accordance to the average LTV score, a ‘1’ given to the top-score cluster, as shown in the last columns of Table 3.8.
Fig. 3. 2 Ranking with LTV method
Table 3. 8 Five clusters generated by K-means method
cluster PC RFM PV Avg. LTV Score Ranking
cluster2 0.022 0.595 0.603 0.253 2 cluster1 0.014 0.221 0.595 0.172 4 cluster4 0.027 0.208 0.279 0.114 5 cluster3 0.048 0.652 0.28 0.215 3 cluster0 0.084 0.847 0.694 0.359 1 0.0 0.1 0.2 0.3 0.4 0.5 0.6 0.7 0.8 0.9 1.0 cluster 0 cluster 2 cluster 3 cluster 1 cluster 4 PC CV PV LTV Score Fig. 3. 3 Result of Cluster Rankings Top 5% 15% Rank 4 Rank 5 Rank 3 Rank 2 Rank 1
Customer Ranked List
LTV Score
40%
70%
4. Evaluation
Results
4.1 Data Sets
The data set comprises two years transaction logs, which consists of 13313 transaction records. We have analyzed a total of 7725 customers holding the jointly-signed credit cards from the shopping mall. In addition, we have divided our training and testing data at the ratio of seventy-to-thirty respectively.
As mentioned in earlier sections, surveys were completed by chief managers in order to derive the weights of the RFM method, as well as the actual profits of the company under their two departments: cosmetics and underwear. We decided our weights based on the average of the results provided by the managers. As for instance, survey questions included topics on the relative importance of the three aspects in the company, including Recency, Frequency, and Monetary, which were divided into percentages. Furthermore, for the level of overall profit under the different categories, direct inquiries about knowledge of the profits under the two categories were exercised.
4.2 Evaluation Metrics
In our research, we performed K-means clustering method, followed by an integrated LTV calculation with three dimensions for all the clusters. Our proposed method was experimentally compared with different methods, including RFM method, W-RFM, potential value respectively. Pair-wise combinations of the dimensions were also performed to compare the reliability of our model.
groups. The average monetary expenditures of the groups were calculated to verify the accuracy of our ranking method, since currency is one of the most explicit ways to demonstrate profit contribution.
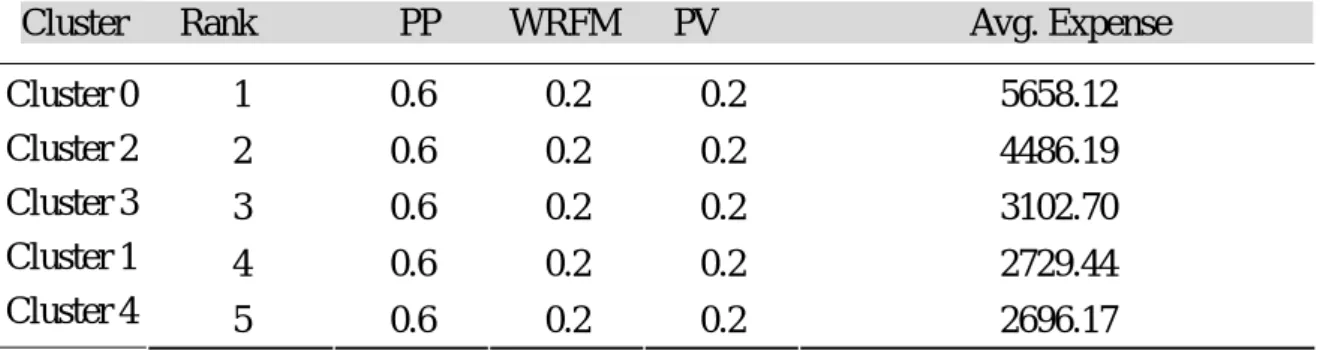
Table 4. 1 Accuracy of Future Contribution by LTV method
Cluster Rank PP WRFM PV Avg. Expense
1 0.6 0.2 0.2 5658.12 2 0.6 0.2 0.2 4486.19 3 0.6 0.2 0.2 3102.70 4 0.6 0.2 0.2 2729.44 Cluster 0 Cluster 2 Cluster 3 Cluster 1 Cluster 4 5 0.6 0.2 0.2 2696.17
Table 4. 2 Accuracy of Future Contribution by LTV method
Rank PP WRFM PV Avg. 1 0.3 0.4 0.3 5838.18 2 0.3 0.4 0.3 4383.38 3 0.3 0.4 0.3 3216.36 4 0.3 0.4 0.3 2740.30 5 0.3 0.4 0.3 2612.73
Table 4.1 and 4.2 present the accuracy of rankings from different weights applied to the LTV calculation in Equation 8. They are measured by the actual profit obtained in the testing set of our data. For instance, customers in cluster 0, with the highest rank, contribute more than the rest of the clusters. The contribution of the ranked clusters goes in accordance with the amount of predicted future contribution to the company.
Unit: NT dollars
4.3 Comparing with RFM, WRFM, Past Profit Contribution, Potential Value
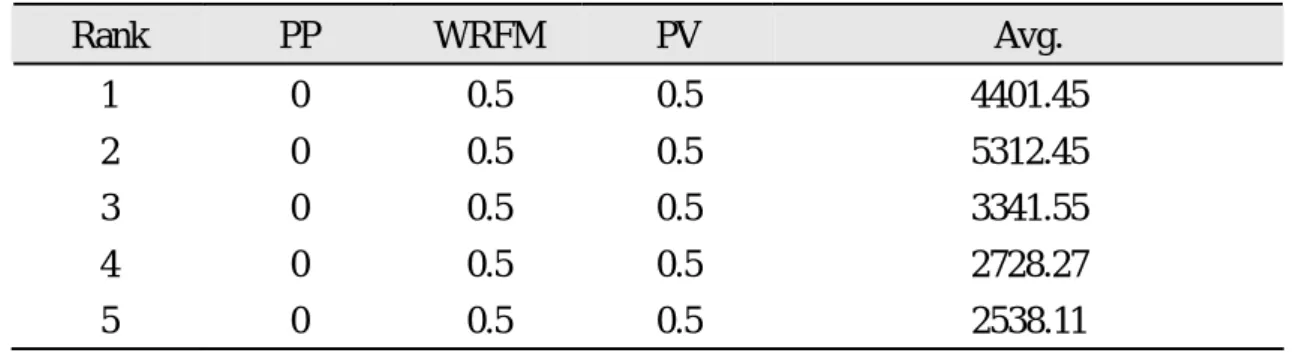
We performed comparisons by examining future profits of ranked clusters with various methods. The non-weighted RFM method does not consider the weights of RFM. This technique normally sets equal weights of R,F,M, and then performs the K-mean method to cluster and then rank customers according to their clusters’ RFM values. Higher ranking clusters are expected to make greater future profit contributions. As shown in Table 4.3, by the RFM method, the future profits do not follow the ranked orders. For instance, the cluster with rank 5 has a larger average contribution than rank 3, and the values in rank 4 are greater than rank 3. Table 4.4 displays one of our results of pair-wise attribute combinations from the LTV method. As we observe, pair-wise attribute of WRFM and potential value were employed. We obtained a faulty result: the average future expenditure of rank 1 and rank 2 should be reversed. These were also employed to further validate the precision of the combination of the three attributes in our research.
Table 4. 3 Future Contribution by Other methods
Rank RFM WRFM PP PV 1 4817 2 4157 3 2462 4 3119 5 2845 5906.35 4236.85 3073.16 2813.33 2874 6094.45 3952.17 3414.25 2865.28 3050.79 3911.26 3088.24 3907.78 3476.26 2563.17
Table 4. 4 Future Contribution by Pair-wise dimensions
Rank PP WRFM PV Avg.
1 0 0.5 0.5 4401.45
2 0 0.5 0.5 5312.45
3 0 0.5 0.5 3341.55
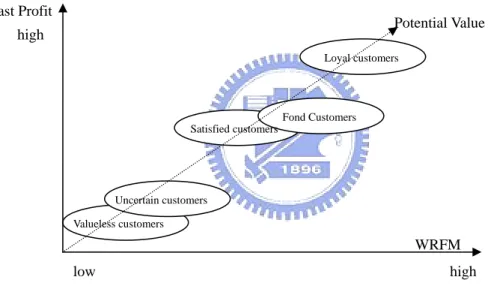
4.4 Definition of Customer Segmentation
The ranked clusters provide a basis for segmenting customers. They are divided into five market groups, as shown in Fig. 4.1 below. As for instance, Cluster 0 is considered to be our loyal customer group, while cluster 4 is our valueless group. Cluster 2 and 3 are classified as our potential customer groups. Cluster 1 is classified as our uncertain customers may include customer groups who only purchased once or twice. They have low historical records and RFM values, but they have the demographic characteristics that are probable of making purchases again.
Fig. 4. 1 Result of Customer Segmentation
4.4.1 Analysis of Customer Segmentation
A calculation of the average scores of each cluster was performed in order to make a comparison with the overall average score for all attributes. As for instance, in cluster 0, the average scores of past profit contribution(PP) is above the overall average past profit contribution score of all clusters, so we assign a value of ‘high’ in the PP column in the Table
Fond Customers Satisfied customers Loyal customers Uncertain customers Valueless customers WRFM Past Profit Potential Value low high high
4.5 below. Customers in cluster 0 represent the demographic attributes that are more likely to make a purchase. They also purchased recently, frequently, and spend regularly. Moreover, we observe that cluster 0 retains good historical records, with a high-level past profit contribution to the company.
Table 4. 5 Classification of Customer Behavior
Cluster PP WRFM PV R F M Ranking
cluster0 high high high high high high 1
cluster2 low high high high high low 2
cluster3 high high low high high low 3
cluster1 low low high low low low 4
cluster4 low low low low low low 5
Potential customers consist of satisfied and fond clients. In detail, cluster 3 is considered to be our satisfied customers; satisfied customers will continue to make purchases if the proper marketing strategies are made. Furthermore, both potential cluster groups have the same RFM pattern: customers in such clusters may both be developing a closer relationship with the company. Cluster 2, categorized as our fond customers, may include new customer who purchased frequently, since they have a low past profit contribution record. On the other hand, customers in cluster 3 might be considered as mature customers that also visit frequently, but they are the minority group in terms of potential value based on demographic data, as shown in Table 4.6. Promotions of combination from the two product categories can be offered to cluster 3 to increase their buying probability, thus create more profits to the company. Decision makers may also examine closely to the special demographic characteristics of these clusters, and implement the appropriate marketing strategies.
Table 4. 6 Statistics of Cluster based on Product Category
Category Cluster cluster 0 cluster1 cluster 2 cluster 3 cluster 4
Only Cosmetics Only underwear
Both Cosmetics and Underwear Total number in cluster
957 228 313 1498 1540 285 62 1887 1379 222 73 1674 363 999 38 1400 301 913 51 1265
4.4.2 Statistics of Market Segmentation
Statistics of cluster characteristics were also completed to assist decision makers in implementing their marketing strategies accordingly. In Fig.4.2 to Fig 4.5, we observe the different attribute distributions in cluster 0, regarded as our targeted loyal customers. For instance, more than half the population in cluster 0 are young females living in HsinChu. Since they are conceived as one of the company’s major profit contributor, we can also derive a more personalized promotion through further analyses of different sub-characteristics that exist within our clusters of loyal and potential customers.
Per cen tag e
Managers 12% Housewife 12% Proefessor 10% Engineer 8% Assistant 6% Sales 4% Administration 4% Commisioner 3% Boss 3% Secretary 2% Others 12% Employees 7% Financial D. 5% Executive 4% Operations 8% Managers Housewife Proefessor Operations Engineer Employees Assistant Financial D. Executive Sales Administration Commisioner Boss Secretary Others
Percentage HsinChu 85.5% Miaoli County 7.9% Tao-Yuan 3.4% Taipei 2.0% Taichong 0.4% Pingdong 0.3% Others 0.5% HsinChu Miaoli County Tao-Yuan Taipei Taichong Pingdong Others
Fig. 4. 3 Area Distribution of cluster 0
Percentage age<30 24% 30<age<40 45% age>40 31% age<30 30<age<40 age>40 Percentage Female 86% Male 14% Female Male
5. Conclusion and Future Work
In Customer Relationship Management, it is essential to realize the characteristics of different customer groups not only to improve profitability, but more importantly to develop long-term relationship with them. Our method integrates the different aspects of evaluating customers’ level of importance, based on their past profit records, and purchase behaviors.
Experiments were conducted to evaluate the accuracy of our method in comparison with previous methods. Asides from having the flexibility of adjusting different weights for the relative importance of the attributes, the results of our method were shown to have better predictions of future profits for the company. Nevertheless, there were some restrictions to our research, including a lack of diversity in terms of product categories, which in our experiment, consisted only of cosmetics and underwear.
Future work will include further testifying of the feasibility of our proposed LTV model. Applications of our method with a larger data set, varied product categories, and more details on demographic data will be collected and considered in order to intensify our level of analysis, thereby develop more explicit marketing strategies.
References
[1] Berger, P. D., & Nasr, N. I., (1998). Customer lifetime value: marketing models and applications. Journal of Interactive Marketing, Vol.12 (1), pp. 17–30.
[2] Bult, J.R., Wansbeek, T.J., (1995). Optimal selection for direct mail. Marketing Science, Vol.14(4), pp. 378-394.
[3] Dwyer, F.R., (1997). Customer lifetime valuation to support marketing decision making. Journal of Interactive Marketing, Vol. 11(4), pp.6-13.
[4] Gianni, G., & Franceschini, F., (2003). A new model to support the personalised management of a quality e-commerce service. International Journal of Service Industry Management. Vol. 14(3), pp.331-346.
[5] Gloy, B.A., Akridge, J.T., & Preckel, P.V., (1997). Customer lifetime value: An application in the rural petroleum market. Agribusiness, Vol. 13(3), pp.335-347
[6] Goodman, J., (1992). Leveraging the customer database to your competitive advantage. Direct Marketing. Vol. 55(8). pp. 26-27
[7] Gupta, S., & Lehmann, D. R.., (2003). Customers as assets. Journal of Interactive Marketing, Vol.17(1), pp. 9–24.
[8] Ha, S.H., & Park, S.C., (1998). Application of data mining tools to hotel data mart on the Intranet for database marketing. Expert Systems with Applications. Vol. 15(1), pp. 1-31
[9] Han, J., & Kamber,M., (2001). Data Mining: Concepts and Techniques. Morgan Kaufmann, pp. 296-300.
[10] Hoekstra, J.C., & Huizingh, E.K.R.E.,(1999). The lifetime value concept in customer-based marketing. Journal of Market Focused Management. Vol. 3(3-4), pp.257-274.
[11] Hughes, A.M., (1994). Strategic Database Marketing. Probus Publishing, Chicago.
[12] Hwang, H.S., Jung, T.S., & Suh E.H, (2004). An LTV model and customer segmentation based on customer value: a case study on the wireless telecommunication industry. Expert Systems with Applications,Vol.26 (2), pp. 181-188.
[13] Jackson, B.B., (1985). Building customer relationship that last, Havard Business Reviews, Nov-Dec., pp.120-128
[15] Kim, J., Suh, E., & Hwang H., (2003). A model for evaluating the effectiveness of CRM using the balanced scorecard. Journal of Interactive Marketing, Vol. 17(2), pp. 5-19
[16] Kim,S.Y., Jung, T.S., Suh, E.H., & Hwan, H.S., (2005). Customer segmentation and strategy development based on customer lifetime value: A case study. Expert Systems with Applications, pp. 1–7.
[17] Liu, D.R., & Shih, Y.Y., (2005). Integrating AHP and data mining for product recommendation based on customer lifetime value. Information and Management, Vol. 42 (3), pp. 387-400. [18] Liu, D.R., & Shih, Y.Y., (2005). Hybrid approaches to product recommendation based on
customer lifetime value and purchase preferences. Journal of Systems and Software Vol. 77 (2), pp. 181-191.
[19] MacQueen, J.B., (1967). Some methods for classification and analysis of multivariate observations. Proceedings of the Fifth Berkeley Symposium and Mathematical Statistics and Probability. Vol. 1, pp.281-296.
[20] Miglautsch, J., (2000). Thoughts on RFM Scoring, The Journal of Database Marketing, Volume 8 (1), pp. 67-72(6).
[21] Morgan, R.M., & Hunt, S.D., (1994). The Commitment-Trust Theory of Relationship Marketing. Journal of Marketing. Vol. 58(3).
[22] Pearson, S., (1996). Building brands directly: creating business value from customer relationships. London: MacMillan Business.
[23] Punj, G.N., & Stewart, D.W., (1983). Cluster analysis in marketing research: review and suggestions for application. Journal of Marketing Research. Vol. 20, pp.134-148.
[24] Saaty, T.L.(1994). Fundamentals of decision making and priority theory with the analytic hierarchy process.RWS Publications, Pittsburgh, PA.
[25] Stone, M., Woodcock, N., & Wilson, M.(1996). Managing the change from marketing planning to customer relationship management. Long Range Planning, Vol. 29, pp.675-683
[26] Stone, B., (1995). Successful Direct Marketing Methods, Lincolnwood, NTC Business Books, IL.
[27] Verhoef, P. C., & Donkers, B., (2001). Predicting Customer Potential Value- an application in the insurance industry. Decision Support Systems,Vol.32 (4), pp.189-199