http://jcc.sagepub.com
DOI: 10.1177/0022022109332738
2009; 40; 187
Journal of Cross-Cultural Psychology
Hofer and Mustapha Achoui
Glazer, Bor-Shiuan Cheng, Ding-Yu Jiang, Corbin C. Wong, Neelam Kumar, Joscha Kärtner, Jan Ronald Fischer, Maria Cristina Ferreira, Eveline Assmar, Paul Redford, Charles Harb, Sharon
Norm Approach to Culture Measurement
Individualism-collectivism as Descriptive Norms: Development of a Subjective
http://jcc.sagepub.com/cgi/content/abstract/40/2/187
The online version of this article can be found at:
Published by:
http://www.sagepublications.com
On behalf of:
International Association for Cross-Cultural Psychology
can be found at:
Journal of Cross-Cultural Psychology
Additional services and information for
http://jcc.sagepub.com/cgi/alerts Email Alerts: http://jcc.sagepub.com/subscriptions Subscriptions: http://www.sagepub.com/journalsReprints.nav Reprints: http://www.sagepub.com/journalsPermissions.nav Permissions: http://jcc.sagepub.com/cgi/content/refs/40/2/187 Citations
Individualism-collectivism as
Descriptive Norms
Development of a Subjective Norm
Approach to Culture Measurement
Ronald Fischer
Victoria University of Wellington
Maria Cristina Ferreira
Eveline Assmar
Salgado de Oliveira University
Paul Redford
University of the West of England
Charles Harb
American University of Beirut
Sharon Glazer
San Jose State University
Bor-Shiuan Cheng
National Taiwan University
Ding-Yu Jiang
National Chung Cheng University
Corbin C. Wong
Hofstra University
Neelam Kumar
National Institute of Science, Technology and Development Studies
Joscha Kärtner
Jan Hofer
University of Osnabrück
Mustapha Achoui
King Fahd University of Petroleum and Minerals
The development and validation of a new instrument for measuring the descriptive norms related to individualism-collectivism (IC) is presented. IC is conceptualized as a group- specific unidimensional cultural construct with four defining attributes (Triandis, 1995). Three studies are reported showing the dimensionality and validities at individual and cultural levels across samples from 11 cultures. The new instrument has good statistical properties with iden-tical structures at the individual and cultural level, good reliabilities at the individual level,
March 2009 187-213 © 2009 SAGE Publications 10.1177/0022022109332738 http://jccp.sagepub.com hosted at http://online.sagepub.com
adequate agreement within cultures, and demonstrates first signs of convergent and discrimi-nant validity. Correlations at the cultural level also indicate that the measure has the potential to add to research by integrating previously untapped attributes of IC. Finally, normative IC explains variance in self-reported behavior over and above self-referenced IC. Implications and opportunities for norm-oriented research and scale refinement are discussed.
Keywords: individualism-collectivism; values; attitudes; norms; cross-cultural research
I
ndividualism-collectivism (IC) has dominated cross-cultural research and is the most commonly applied construct to explain and predict cultural differences (e.g., Hofstede, 2001; Kagitcibasi, 1997; Kim, Triandis, Kagitcibasi, Choi, & Yoon, 1994; Oyserman, Coon & Kemmelmeier, 2002; Triandis, 1995). IC has contributed significantly to our understand-ing of human behavior; in particular by highlightunderstand-ing the cultural boundedness of psycho-logical theories and by providing a theoretical framework of cultural differences that can be used to develop new theories and hypotheses. This dimension also seems to be highly stable across cultural groups (Fontaine, Poortinga, Delbeke & Schwartz, 2008). However, the conceptualization and measurement of the construct is confusing and ambiguous (Oyserman et al., 2002). This article reports preliminary evidence for a theory-driven instrument of subjective descriptive norms (Bierbrauer, Meyer, & Wolfradt, 1994, Cialdini & Trost, 1998), with samples from all inhabited continents except Africa.The Four Defining Attributes of IC
Triandis (1995) discussed the four defining attributes of IC: (a) how individuals perceive themselves, (b) how they relate to others, (c) the goals they follow, and (d) what concerns drive their behavior. First, individuals can define themselves more in terms of their individual attributes and distinct from each other or more in interdependent terms (e.g., “I am a member of my family, a member of tribe x, a member of religion y”), with the self including many of the attributes of the group. Given the centrality of the self for human agency, this aspect may be the core of the IC construct. Second, individual–group relations involve trade-offs between rational (purely cost–benefit based calculations) versus relational and socio-emotional con-cerns. Third, people in individualistic cultures have goals that may be distinct from the goals of the group, whereas people in collectivistic cultures develop goals that are usually compat-ible with their in-group’s goals. Fourth, individuals from more individualistic cultures are more likely to determine their social action based on their personal attitudes, needs, and their perceived personal rights and contracts. In contrasts, individuals within collectivistic cultures are more strongly guided by group norms, duties, and obligations. The four components focus on the molar or core psychological processes of the IC construct.
IC as Cultural Norms
IC has been treated as both a nation-level cultural construct (Hofstede, 1980) and an individual-level individual preference or personality-like variable (Hui, 1988). Most instru-ments ask individuals about their personal preferences, values and/or attitudes, which is less
useful if the focus is on expression of cultural processes and dynamics (Fischer, 2009a; Hofmann & Jones, 2004). Focusing on IC from a subjective norm perspective, the focus (rel-evant in-group) and dimensionality is important. First, norms are not context free; they specify guidelines for behavior toward specific targets within a particular context. Hence, cultural norms should be specific to groups (although it may be possible that similar norms exist across groups and contexts; see Argyle, Henderson, Bond, Iizuka & Contarello, 1986; Oishi, Diener, Scollon, & Biswas-Diener, 2004).
Second, previous research has conceptualized IC as bipolar (Hofstede, 1980) or indepen-dent (Triandis, 1995). Focusing on one selected group as a reference for IC norms, it becomes difficult to conceptualize IC consisting of two unrelated constructs. Norms spec-ify the range of acceptable and appropriate behavior in a particular area or domain. It is challenging to simultaneously satisfy expectations of being independent and being related toward the same group.
Toward a Theory-Driven Cultural Measure of IC
We use the four defining attributes proposed by Triandis (1995) as the basis for the development of our IC scale. Conceptualizing IC as a culturally shared construct, it is important that individuals are directed to evaluate how individuals relate to their in-group within their culture rather than personal preferences or attitudes (e.g., Fischer, 2006, 2008; Fischer, Ferreira, Assmar, Redford, & Harb, 2005; Kozlowski & Klein, 2000). Using the composition models proposed by Chan (1998), participants are asked to report on typical or characteristic behaviors of most members of the group (referent-shift consensus model), thereby capturing shared collective perceptions and experiences (Glick, 1985) or descrip-tive norms of a given group (Cialdini & Trost, 1998). We also provide a list of potential in-groups that individuals within a society could relate to for contextualizing the norms. Finally, we conceptualize IC as a single, bipolar continuum. To enhance the meaning of the construct, we provide individualistic and collectivistic anchors similar to semantic differ-ential scales. Specifying a range of potdiffer-ential behaviors rather than using a single statement, we intend to provide meaning and help to contextualize the often abstract and decontextu-alized items common in IC scales. Providing these anchors also avoids the problem of frequency or typicality statements that may have different meanings across languages and cultural groups. By providing behavioral endpoints describing either extreme individualis-tic or collectivisindividualis-tic behaviors, individuals can assess whether most people in their culture are closer to one end or the other.
IC Norms and Behavior
One final crucial question remains regarding the extent to which IC norms predict vari-ance in behavior over and above previous self-report measures of IC. In other words, how much variance do IC norms account for in behaviors after traditional IC scales? Research has clearly demonstrated the importance of measuring other constructs beyond values when predicting behavior (Bond, Leung, Au, Tong, & Chemonges-Nielson, 2004; Bond, Leung, & Schwartz, 1992; Chen et al., 2006). Fischer (2006) showed that values and norms might
have different impact on behavior. Self-referenced values (what is important for me) were mainly related to behaviors associated with personal well-being—self-directed positive and pleasant experiences—whereas descriptive norms (what is important for most people) were more closely related to behaviors for which social norms exist. We may expect similar relationships for IC. First, conformity and tradition-oriented behaviors (such as obeying parents and elders, following traditions) are socially oriented behaviors and are more strongly influenced by norms (Fischer, 2006). Therefore, we would expect that descriptive norms of IC predict variance in conformity and tradition-oriented behavior over and above self-rated IC (Hypothesis 1). In contrast, self-rated IC (using established scales; e.g., Triandis & Gelfand, 1998) should predict self-directed and stimulation-oriented behaviors. Thus, Hypothesis 2 is that normative aspects should not strongly relate to these behaviors, especially if there is no strong social norm associated with it (see Bardi & Schwartz, 2003). Finally, there are behaviors that are socially oriented but may be primarily dependent on individual-level dispositions and attitudes. Such behaviors could include helping and altru-istic behavior not directed at the immediate in-group referenced in IC. The issue here is that the norms are not directly related to the target of the prosocial action (see, e.g., the absence of strong relationships between familial norms and nonfamily-targeted compliance behav-ior). To the extent that in-group norms also generalize to other close groups, we could expect similar, albeit weaker relationships. Therefore, we would predict that self-rated IC is strongly related to these socially oriented behaviors, whereas normative IC is only weakly related to these non–in-group targeted behaviors (Hypothesis 3):
Hypothesis 1: Normative IC is significantly related to conformity and tradition-oriented behavior after controlling for self-rated IC (using established individual-level measures).
Hypothesis 2: Only self-rated IC will relate to self-directed and stimulation-oriented behavior, but not normative IC.
Hypothesis 3: Normative IC is significantly (albeit more weakly) related to helping and altruistic behavior (directed at non–in-group members), after controlling for self-rated IC.
Overview of the Studies
We present three studies involving multiple analyses. The first study describes the item development and the factor structure in four different student samples at the individual level. The second study reports the factor structure using multigroup and multilevel confir-matory factor analysis, reliability, and convergent validity of the new scale at the individual and national level across 11 nations. For the ease of presentation, we have split the analyses and discussions of Study 2 into three different parts (study of equivalence at the individual level, study of convergent validity at the individual level, study of structure and function at the cultural level). An investigation of structure at both the individual and culture level will allow for an examination of isomorphism of the construct, especially because previous research reported different structures at the individual and cultural level (Triandis, 1995). Finding isomorphic structures would greatly enhance the potential of the new scale or similar approaches for future research (Chen, Bliese, & Mathieu, 2005). The third and final study reports the relationship between our normative IC scale and self-reported behavior over and above a traditional self-report measure at the individual level.
Study 1: Scale Development
The purpose of this study was to develop a new set of items measuring the four defining attributes of IC.
Method
Participants
Questionnaires were completed by 517 students in Rio de Janeiro, Brazil; 89 interna-tional students currently enrolled at a New Zealand university; 210 New Zealand students; and 178 Taiwanese students. Between 32% (New Zealand) and 49% (Brazil) of the students were male. The majority of students (between 54% and 60%) were arts students; the remainder was taking science or medical classes. The international students were predom-inantly from Asian countries, with Chinese (55%), Japanese (7%), and Korean (5%) con-stituting the majority. The New Zealand students were predominantly Pakeha (New Zealanders of European descent; 84%). About 5% of students were Maori or of Maori descent, and 3% were of Chinese descent. The remainder was of mixed heritage. Finally, the Taiwanese students were all ethnic Chinese.
On average, Brazilian students were 26 years old (SD = 7.0), international students in New Zealand were about 23 years old (SD = 4.8); New Zealand students were about 21 years old (SD = 5.8) and Taiwanese students were 22 years old (SD = 4.2).
Item Development
The first and second authors first examined traditional scales of IC in light of the defin-ing attributes of IC put forward by Triandis (1995). Items from established scales (e.g., Clark, Ouellette, Powell, & Milberg, 1987; Gudykunst et al., 1994; Singelis, 1994; Yamaguchi, 1994) were chosen if they reflected one of the four attributes. Selected items were then rewritten to capture a cultural norm perspective (e.g., changing the referent from “I” to “people in my country”), and the respective opposite meaning pole was written. Where too few suitable items existed, new items were generated based on the components of the attribute. All items were discussed extensively in laboratory group meetings at the first, second, and third authors’ institutions as well as in discussions between the first and second author, until agreement was reached concerning definitional clarity and precision. The complete list can be obtained from the first author. Items were simultaneously created in English and Portuguese and checked via a committee approach. The Chinese version was obtained through back-translation procedures based on the English version.
Definition of the self. Triandis (1995) recommended the use of self-construal scales developed by Gudykunst et al. (1994) and Singelis (1994) to capture cultural definitions of the self. Upon examination of the item contents of these scales, we found that items from these scales measured mainly other aspects of IC rather than definitions of the self (cf. Harb & Smith, 2008). A few items such as “I am a unique person separate from others” or “It is important for me to act as an independent person” tapped self-related aspects and were used. The remainder of the items was newly generated, and agreement among the first three authors was reached for the five final items.
Structure of goals. We used Yamaguchi’s (1994) Collectivism Scale to measure goal structures. We adapted some of these items and constructed some additional items. The final scale consisted of seven items.
Norms versus attitudes. Triandis (1995) did not recommend a particular scale for mea-suring this attribute of IC, and we could not find suitable items in existing scales. Therefore, we developed six new items.
Rationality versus relatedness emphasis. We adapted items from Clark et al. (1987). Furthermore, various items from the Gudykunst et al. (1994) and Singelis (1994) scale seemed to cover this attribute. We adapted and rewrote items from these sources for a total of 10 items.
Participants were instructed to indicate the extent to which either of the two statements (the individualism and collectivism pole of each statement) is more typical for most people in their country. The items were arranged in a form similar to a semantic differential scale with 7-point response options between the two anchor items. Because most items refer to some referent group, participants were also requested to refer to the most important group in their country when answering the survey (discussed in the next section).
In-group specification. Before answering the items, individuals were asked to think about the most important groups within their country. The following statement was presented:
People normally belong to various groups. These groups often have some influence on peo-ple’s lives. However, not all groups have the same importance, and some groups might be more important for people in a country than others.
Participants were then asked to rank order the following nine groups in importance for people in their country: Leisure groups (hobby groups), work groups or friends from work, childhood friends, sports groups and teams, neighbors, nuclear family (parents and brothers and sisters), extended family, religious groups, and voluntary groups. These groups were derived from the literature and previous scales (e.g., Hui, 1988; Triandis, 1995) as well as through discussions between the authors about potentially relevant in-groups. Participants were given an opportunity to specify other groups; however, no additional categories emerged. Subsequently, each individual answered the items in relation to the group that he or she had chosen previously. We did not force individuals to rate the items in relation to any researcher-specified group, but rather, respondents answered the items based on what they thought is the most important group for most people in their culture. The focus of the scale was therefore the culture (specified as country or nation).
The most important group was the nuclear family, with 77.7% ranking the nuclear fam-ily as most important (ranging from 74.2% in Brazil to 86.3% in New Zealand). The second most important group was the extend family (43.6%; ranging between 39.5% in New Zealand and 47.7% in Brazil). Therefore, the most important group in people’s lives is the family (nuclear and then extended). This category was then used by the majority of par-ticipants to answer the IC questions. The analyses presented are based on the entire sample,
but all the following analyses were repeated, excluding individuals that selected other groups. These additional analyses show identical patterns and, for space restrictions, we do no report them here (they are available from the first author on request).
Results
We conducted a number of exploratory factor analyses using principal component analyses and oblique rotation, both within each of the samples as well as panculturally. The number of factors with eigenvalues greater than 1 was either 7 factors (Taiwan, Brazil) or 8 factors (international students, New Zealand students), explaining between 56.76% (Brazil) and 68.68% (International students) of the variance. Six factors were found pan-culturally, explaining 52.46% of the variance. Scree tests show a clear bend between three and four factors; therefore, both three-factor and four-factor solutions were compared. The loading patterns indicated that (a) goal items derived from the Yamaguchi scale (see Triandis, 1995) did not clearly load on one factor; (b) self-definition items loaded on one factor, but the loadings were more consistent and stronger in the Taiwanese and International student sample compared with the New Zealand and Brazilian sample; (c) clear norms versus attitudes and rationality versus relatedness factors emerged across samples, although they tended to merge in the Taiwanese sample.
Upon examination of the strengths of item loadings and their consistencies across sam-ples as well as theoretical grounds (loading of items on factors), a new analysis was run in which (a) the structure of goal items were omitted because they did not clearly load on a single factor and (b) four additional items were omitted due to poor loadings (one from the self-definition, three from the rationality vs. relatedness factor). A clear three-dimensional structure emerged. The results of this analysis are available from the first author. The explained variance by the three factors varied between 47.52% (New Zealand) and 57.86% (Taiwan).
A second analysis not reported here using 236 working adults from Taiwan, New Zealand, and Brazil replicated the three-factor structure (these analyses are available from the first author).
Internal Consistencies
The internal consistencies were good to excellent for the Norms Versus Attitudes scales as well as the Relational Versus Rational Concern Scale. The internal consistencies for the norms scale (6 items) were .80 (Brazil), .81 (international students), .82 (New Zealand), and .84 (Taiwan). Similarly, the alphas for rationality versus relatedness (7 items) were .78 (New Zealand), .82 (international students; Brazil), and .89 (Taiwan). The internal consis-tencies for the Self Scale (4 items) were somewhat lower: .52 (New Zealand), .53 (Brazil), .62 (Taiwan), and .77 (international students). Therefore, the first two scales showed excel-lent reliabilities, whereas the self-scale showed mediocre reliabilities. Although undesir-ably from a psychometric perspective, these alphas are typical in cross-cultural research. For example, the averaged reliability across all social axioms scales was .59 (Leung & Bond, 2004), with mean reliabilities ranging from .41 to .75. The average reliability for value scales as used in the European Social Survey (Schwartz, 2006) is .56, ranging from .36 to .70. Oyserman et al. (2002) reported more studies with low reliability (< .70) in their
meta-analysis than studies with traditionally acceptable reliability levels. This compares well with our overall reliability of .75, with only two samples showing reliabilities less than .60 (Nunnally, 1978).
Discussion Study 1
The present study has shown that three of the four cultural attributes can be measured using a paper-and-pencil test. The factor structure supports three factors and the reliabilities are generally higher than is common for most instruments measuring cultural dimensions. The Self Scale shows lower reliabilities but also has fewer items, which is likely to lead to lower reliability (Cortina, 1993).
Study 2a: Equivalence at the Individual Level
The aim of the second study is (a) to develop a measure of all four attributes of IC in a larger number of cultures, (b) analyze its convergent validity at the individual level, and (c) verify its structure and function at the national level. Due to the complex nature of the analyses, we present parts a, b, and c in separate sections. First, the factor structure and equivalence at the individual level of analysis is examined using multigroup confirmatory factor analysis (Cheung & Rensvold, 2000).
Method
Participants
A total of 1,680 social science and psychology students from Argentina (N = 189), Brazil (N = 255), Germany (N = 108), India (N = 152), Lebanon (N = 150), New Zealand (N = 158), Peru (N = 133), Saudi Arabia (N = 107), Taiwan (N = 137), United Kingdom (N = 42), and the United States (N = 183) participated in this study. All students participated as part of an in-class exercise or to receive course credits in fulfillment of course requirements.
Overall, 31.3% of participants were male, but the proportion of men varied significantly across samples due to cultural and social stratification. All students in Saudi Arabia were male, followed by Taiwan (46.8%), Germany (38.9%), Lebanon (37.4%), United Kingdom (35.7%), Peru (33.1%), United States (31.7%), Brazil (29.0%), India (26.8%), and New Zealand (25.0%). The overall mean age was 23.3 years (SD = 6.4). There were significant age differences: F(10,1659) = 34.74, p < .001. Students in Taiwan and Lebanon were the youngest (mean age: 20.1 years), whereas Argentine, Brazilian, and German students were the oldest (mean age: 26.1 years), with the remainder falling in between (mean age: 22.3 years). These age groups approximately correspond to student profiles (based on structural and educational requirements in each country). The majority was born and raised in the country of study, but 10.7% (179 students) were born and raised in a different country. The highest percentages of foreigners were found in Lebanon (36.0%), United States (26.5%), New Zealand (25.3%), Saudi Arabia (7.5%), and Germany (7.4%). All individuals were included, because the focus is on the structure of subjective norms at the individual level and no tests of differences across cultures are conducted, which might be affected by differential perceptions of subjective norms.
Instrument
The highest loading items of the self—rational versus relational concern and attitudes versus norm guidance—were used from the previous study. We did not use the goal items based on the Yamaguchi (1994) scale because the items did not clearly emerge as a single factor. Our aim was to capture all four IC components; we therefore formulated six new items focusing on the extent to which personal or group goals have priority in cases of conflict between them. As before, the items were simultaneously created in English and Portuguese by the first, second, and third author, and were discussed in research meetings at the institutions of the authors. The same 7-point semantic differential-like response for-mat and instructions as in the previous study were used. Participants were asked to indicate to what extent either of the two statements was more typical for most people in their coun-try, and they answered the items in relation to the group that they had previously chosen as most important for the majority of people in their country. The instrument was translated into Spanish (Argentina, Peru) using a committee approach (van de Vijver & Leung, 1997). Translation and back-translation was used for the Arabic (Lebanon, Saudi Arabia) and Chinese (Taiwan) versions. The German version was translated, and the equivalence was checked using a committee approach. The English version was used in India, because English is one of the official languages.
Concerning the most important in-group, between 64.2% (India) and 100% (United Kingdom) of the participants indicated that the nuclear family is the most important group within society (average 78.5%). Combining these ratings with those individuals who rated the nuclear family as second most important group (between 76% in Peru and 100% in the United Kingdom, most samples being above 90%), we found that nuclear families are seen as the most important group within people’s life. The second most important group in gen-eral was the extended family (average 39.0%; between 22.4% in Germany and 51.2% in Taiwan; please note that some individuals gave equal importance to the nuclear and extended family; therefore, the numbers add up to more than 100). This shows that the family (nuclear and extended) is seen as the most important reference group when indi-viduals evaluate individual-group relationships.
Results
Multigroup confirmatory factor analysis (Cheung & Rensvold, 2000; Fischer & Fontaine, in press) was used to establish structural and measurement equivalence across samples.
Global Individual-Level Structure
First, a confirmatory factor analysis using the pooled within-group covariance matrix was conducted (for a discussion of the advantages of this approach, see Fontaine & Fischer, in press). This confirmatory factor analysis uses the sample size weighted matrix, which is a consistent and unbiased estimator of the within-group matrix (Muthén, 1994). This pooled within-group covariance matrix gives equal weight to each cultural sample and therefore represents the individual-level, culture-general, or etic solution. Using LISREL 8.52, the individual items were forced to load on their intended factor. We used the com-parative fit index (CFI; Bentler, 1990) and the Tucker-Lewis Fit index (TLI; Bentler & Bonnett, 1980). Values above the high 0.80s are seen as acceptable (Marsh, Balla, &
McDonald, 1988). We also used the Root Mean Square Error of Approximation (RMSEA; Browne & Cudeck, 1993), with values of less than 0.05 seen as ideal, values ranging between 0.06 and 0.08 being acceptable, and values larger than 0.10 indicating poor fit.
The initial model showed acceptable fit: χ2(203) = 1250.51, TLI = .95, CFI = .95,
RMSEA = .06. However, residuals and modification indices suggested that item 17 (“When individuals have a need they rely on themselves” and “When individuals have a need, they turn to others for help”) loaded on the self-factor rather than on the rational-relational fac-tor as intended. Conceptually, it could also indicate self–other relationships and therefore a second solution was investigated in which this item was forced to load on the self factor. The solution improved somewhat: χ2(203) = 1195.91, TLI = .95, CFI = .96, RMSEA =
.058. We therefore decided to allow it to load on the self factor. We then compared all pos-sible combinations of factors (all combinations of three-factor and two-factor solutions and the one-factor solution). None of these combinations provided better fit; in fact, all models but one showed CFIs and TLIs lower than .95. The model that showed the next best fit was a three-factor solution in which we combined the self factor and attitudes versus norm fac-tors: χ2(206) = 1440.17, TLI = .94, CFI = .95, RMSEA = .061. Overall, a four-factor
solu-tion provided the best fit. An evaluasolu-tion of the modificasolu-tion indices and residuals did not suggest any meaningful changes to the model. Table 1 shows all the items and the factor loadings across all samples.
We repeated these analyses with only those individuals who had chosen the nuclear fam-ily as the most important in-group in their country and were also born in the country in which they had answered this survey (see Study 2b for sample sizes for native-born par-ticipants). The results were identical (e.g., the results for the four-factor solution was χ2(203) = 932.25, TLI = .95, CFI = .96, RMSEA = .059). All information on these analyses
is available from the first author on request.
Multigroup Analysis
Next, we conducted a multigroup analysis in which we used the pooled within-group matrix as the reference group and specified the factor loadings of items to the respective factor within each culture to be identical to this reference solution. In addition to the fit indices, we also evaluated the contribution to the χ2 statistic by each cultural sample.
Samples should contribute approximately equally to the solution. The solution showed reasonable fit: χ2(2634) = 6087.77, TLI = .93, CFI = .93, RMSEA = .073; and all samples
contributed approximately equally to the overall χ2 statistic.
A second model was evaluated in which we constrained the error variances with each sample to be equal to the reference solution. In addition to equal factor loadings, this model also assumes that the errors are equal across groups. This more stringent model still showed reasonable fit: χ2(2876) = 6931.40, TLI = .93, CFI = .93, RMSEA = .076. Given the
num-ber of items and the diversity of samples, this overall fit of the model across samples— constraining both the factor loadings and the error variances—is acceptable. An analysis with only those participants that were born in each country and reported family as a rele-vant in-group showed similarly acceptable fit (results available from the first author).
Finally, we conducted a means and covariance structure analysis (Cheung & Rensvold, 2000) in which we randomly selected one group (New Zealand) as a reference group and specified the factor loadings of items to the respective factor within each culture to be
Table 1
Factor Loadings in the Pooled Within-Group Matrix (Completely Standardized Solution)
Most people see themselves as independent from others. Most people enjoy being different
from others.
Most people stress their personal accomplishments and
achievements when meeting new people.
It is important for most people to act as an independent person.
When people have a need, they rely on themselves.
If there is a conflict between personal values and the values of a group, most people follow their personal values.
Most people do what is enjoyable to them personally.
Most people pay attention to their personal contracts.
Most people obey their personal contracts rather than their group norms and duties.
Most people act in line with their rights.
Most people follow their personal attitudes.
Most people do their duties only if they think they will benefit from it.
When making decisions, most people are not especially sensitive to feelings of people around them. Most people only consider needs of
others in their group, if they expect something from them in return.
Most people carefully calculate costs and benefits of their relationship with other people.
Before helping other people, most people consider the costs of helping. 1 .56 .44 .41 .65 .36 2 .56 .62 .63 .68 .66 .68 3 .62 .70 .78 .61 .70 4
Most people see themselves as part of their group.
Most people enjoy being similar to others.
Most people stress accomplishments and achievements of their group when meeting new people. It is important for most people to act
as member of their group. When people have a need, they turn
to others for help. If there is a conflict between
personal values and the values of a group, most people follow the values of their group.
Most people carry out their group obligations.
Most people pay attention to their group duties.
Most people obey their group norms and duties rather than personal contracts.
Most people act in line with their group norms and duties. Most people follow their group
norms and rules.
Most people do their duties, even when they think they will not benefit.
Most people take feelings of people around them into account when making decisions.
Most people consider needs of others in their group, even if they do not expect something from them in return.
Most people focus on the relationship with other people without caring about associated costs and benefits.
Most people generally help other people without considering costs.
identical to this reference solution (for further explanations of this procedure, see Fischer & Fontaine, in press). The reason for conducting this analysis is that it allows an examina-tion of response styles (Cheung & Rensvold, 2000). In addiexamina-tion to the fit indices, we also evaluated the contribution to the χ2 statistic by each cultural sample. Samples should
con-tribute approximately equally to the solution. Constraining the factor loadings to be equal, reasonable fit was found: χ2(2633) = 4787.71, TLI = .93, CFI = .92, RMSEA = .079. All
samples contributed approximately equally to the overall χ2 statistic. Because the factor
loadings are similar across groups, extreme responding is not a concern (see Cheung & Rensvold, 2000). Constraining the item intercepts to be equal yielded a slightly worse but still acceptable fit: χ2(2733) = 5079.37, TLI = .92, CFI = .92, RMSEA = .081. The RMSEA
estimate is at the upper bound according to Browne and Cudeck’s (1993) guidelines; how-ever, the CFI and TLI are within acceptable ranges. This final analysis indicates that acqui-escent responding is not likely.
Higher Order Structure
We also tested whether a higher order IC factor could account for the correlation among the four attributes. The fit with a second-order factor in the pooled-within sample was acceptable: χ2(205) = 1513.5, TLI = .94, CFI = .95, RMSEA = .066. At the individual level,
a second-order IC factor is underlying the correlations among the four attributes.
Table 1 (continued)
Most people do not hesitate to change established relationships if the relationship is not in their best interest anymore.
Most people are mainly concerned with their own personal goals. In situations of conflict between the
goals of one's group and personal goals, people pursue their own goals.
In cases of conflict, individuals just ignore the goals of their group and they attempt to reach their personal goals.
The goals of individuals within a group and the goals of the group are often not compatible. It feels natural for most people to
pursue their personal goal without considering the goals of their group. 1 2 3 .49 4 .69 .74 .71 .39 .59
Most people maintain established relationships, even if this is not in their best interest.
Most people are mainly concerned with the goals of their group. In situations of conflict between the
goals of one's group and personal goals, people sacrifice their own goals to achieve the goals of the group.
In cases of conflict, individuals do what the group expects and demands without opposing the will of the larger group.
The goals of the group and the goals of individuals within groups are often compatible.
If feels natural for most people to pursue personal goals only if they do not conflict with goals of their group.
Reliabilities
The mean reliability across all scales and samples was .74. The mean reliability for the goal factor was .75 (5 items); for the rational versus relational concern factor, .80 (6 items); for the norms versus attitudes factor, .81 (6 items); and for the self factor, .61 (5 items). Therefore, for all scales except the self factor, the mean reliabilities were very good. The mean reliabilities for each sample were also above .70, except for Saudi Arabia, where the mean reliability across scales was .65. This shows the general reliability of the scales, espe-cially the goal, rational versus relational concern, and norm scales across samples. The results per sample and scale are available from the first author.
Discussion Study 2a: Equivalence at the Individual Level
The analyses showed that (a) all four defining attributes of IC as proposed by Triandis (1995) can be measured; (b) the same structure can be identified across 11 culturally diverse samples from all inhabited continents but Africa; (c) factor loadings and error vari-ances are invariant across cultures, which indicates that response styles are less likely to threaten the validity of our results; and (d) the overall reliability is very good and consider-ably higher than reliabilities usually found in cross-cultural research.
Study 2b: Convergent Validity at the Individual Level
To assess the convergent validity of the new scale, we used the widely used vertical-horizontal IC scale (Triandis & Gelfand, 1998). We expected consistent relationships with our new instrument, with greater vertical and horizontal collectivism being negatively asso-ciated with our scale and individualism (mainly horizontal) being positively related to our scale. The relationship between vertical individualism and our new scale may be lower, because vertical individualism measures competition, which is not directly related to the defining attributes of IC identified by Triandis (1995).
Method
Participants
The same samples as in the previous analysis were used; however, the vertical-horizontal scale was not administered in Argentina, Peru, and the United Kingdom. Therefore, only the participants from the other eight samples were included in this study (N = 1,316).
Instruments
The same IC attributes scale as in Study 2a was administered. Higher scores represent greater individualism. In addition, the Triandis and Gelfand (1998) measure of vertical-horizontal IC was completed by participants. We rewrote the items using the referent-shift model (Chan, 1998) to capture the cultural normative aspect. The same translation proce-dures (committee approach, translation and back-translation) were used. Participants answered each item on a scale ranging from 1 (not typical) to 6 (very typical). The reli-ability of this scale across samples was .72. Average reliabilities for horizontal individual-ism were .62; for vertical individualindividual-ism, .73; for horizontal collectivindividual-ism, .77; and for vertical collectivism, .72. The reliability of vertical individualism in Saudi Arabia was .18.
An inspection of the correlation matrix indicated that the items did not correlate with each other (mean interitem correlation was .06). The concept of competition as an indicator of vertical collectivism may not be appropriate in a Saudi Arabian context.
Results
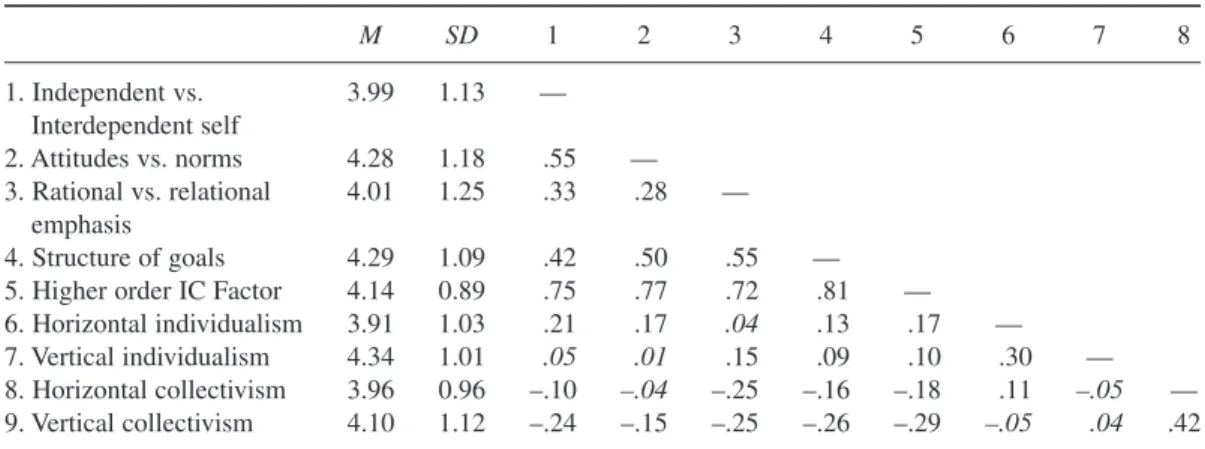
Table 2 shows the correlation between vertical-horizontal IC (Triandis & Gelfand, 1998) and the four dimensional scale of individualism attributes and the higher order factor across all individuals. First, the Interdependent Versus Independent Self Scale correlated positively with horizontal individualism and negatively with both horizontal and vertical collectivism. Second, a reliance on attitudes (vs. norms) correlated positively with horizontal individual-ism and negatively with vertical collectivindividual-ism. Third, an emphasis on individual goals over collective goals in cases of conflict correlated positively with horizontal and vertical indi-vidualism and negatively with horizontal and vertical collectivism. Finally, rational concern (vs. relational concern) with group membership was positively correlated with vertical indi-vidualism and negatively with horizontal and vertical collectivism.
The mean correlation between the four attributes and horizontal individualism was .14; with vertical individualism, it was .06; with horizontal collectivism, it was –.15; and with vertical collectivism, it was –.23. Overall, the four attributes correlated slightly stronger with collectiv-ism (mean r = –.18) than with individualism (mean r = .10). Similarly, using the higher order IC norm, strongest correlations were observed with vertical collectivism, followed by horizon-tal collectivism, and weakest relations were found with vertical individualism.
Discussion Study 2b: Convergent Validity at the Individual Level
This analysis examined the convergent validity of the new IC scale with one of the most frequently used scales (Triandis & Gelfand, 1998). There is substantial evidence of the
Table 2
Descriptive Statistics and Correlation Matrix (Across All Countries)
M SD 1 2 3 4 5 6 7 8 1. Independent vs. 3.99 1.13 — Interdependent self 2. Attitudes vs. norms 4.28 1.18 .55 — 3. Rational vs. relational 4.01 1.25 .33 .28 — emphasis 4. Structure of goals 4.29 1.09 .42 .50 .55 — 5. Higher order IC Factor 4.14 0.89 .75 .77 .72 .81 — 6. Horizontal individualism 3.91 1.03 .21 .17 .04 .13 .17 — 7. Vertical individualism 4.34 1.01 .05 .01 .15 .09 .10 .30 — 8. Horizontal collectivism 3.96 0.96 –.10 –.04 –.25 –.16 –.18 .11 –.05 — 9. Vertical collectivism 4.10 1.12 –.24 –.15 –.25 –.26 –.29 –.05 .04 .42 Note: The correlations and descriptive statistics for descriptive IC norms is based on all participants (N = 1,680); the correlations and descriptive statistics for the vertical-horizontal IC scale is based on the eight cul-tural samples in which the scale was administered (N = 1,316); Numbers in italics are not significant; all other numbers are significant at a p < .01 level.
convergent validity of the new scale. In particular, this new bipolar scale shows consistent correlation patterns in that the vertical-horizontal individualism scales correlated positively with the new scale, whereas the collectivism scales correlated negatively with the new scale. The intercorrelations with the vertical-horizontal IC scales show opposite correlation patterns, which suggest a single underlying normative continuum of the construct.
The pattern of the correlations also suggests that vertical individualism is relatively unrelated to the four defining attributes of IC. Vertical individualism items focus on achievement and competition orientation, which is not directly related to the definition of individualism as proposed by Triandis (1995). As the correlations show, rational versus relational concerns as well as the dominance of group versus individual goals are weakly related to vertical individualism as measured by Triandis and Gelfand (1998). In line with the weak results found here, recent data show that achievement motivation shows more complex patterns with IC (Dekker & Fischer, 2008), which contradicts the simple interpre-tation of competition and achievement as vertical individualism.
Study 2c: Structure and Function at a Cultural Level
One issue we have not yet addressed is to what extent these perceptions of IC are col-lective constructs. Colcol-lective constructs are thought to be widely shared within cultures, and they differentiate between cultures. Furthermore, the previous analyses have focused on the structure of these perceptions at the individual level. However, it needs to be shown whether the structure holds at a collective, cultural level. Finally, it is important to examine the relationship of these emerging constructs at a cultural level with previously developed culture-level constructs.
Therefore, the aim of the final analysis in Study 2c is (a) to examine to what extent indi-viduals agree with each other about these norms, (b) to what extent perceptions can be differentiated among individuals from different cultures, (c) to what extent the structure of these constructs are invariant across levels, and (d) how the emerging constructs relate to other cultural level constructs. To evaluate the relationship with other cultural level con-structs and test the convergent and discriminant validity, we selected Hofstede’s (1980, 2001) and the GLOBE project’s (House, Hanges, Javidan, Dorfman, & Gupta, 2004) indi-cators of collectivism as well as power distance. In the GLOBE study, a differentiation was made between in-group collectivism and institutional collectivism. In-group collectivism measures pride in group members’ accomplishments and loyalty to one’s group, which is relatively similar to Hofstede’s (1980) conceptualization. Institutional collectivism is more ambiguous (measuring the extent to which leaders and institutions appear to foster loyalty and commitment, without designating a specific focus), and this dimension did not corre-late with in-group collectivism. Both the “as is” (practices) and “should be” (values) GLOBE scores were used.
Agreement about Cultural Norms
The issue of agreement has received little attention in the cross-cultural literature. We conceptualized IC as subjective norms that may or may not be shared. It is important to investigate the extent to which individuals concur with each other about the importance or
typicality of these norms within one’s culture. In contrast to reliability estimates that are based on the interitem correlation, agreement indices use information about the variability (variance) within units.
Brown and Hauenstein (2005) developed an indicator of agreement awg,with values between –1 and 1 (1 showing perfect agreement and –1 showing perfect disagreement). A value of 0 indicates that the variability is 50% of the possible variance at the mean. There are no statistical significance tests associated with this indicator. A .70 cutoff value has been proposed as a heuristic for moderate agreement; values of less than .59 are seen as unacceptable if the construct is supposed to reflect small group-level constructs. This cutoff may be inappropriate, because previous research has focused on agreement around specific and well-defined aspects in small groups within organizations or educational settings. We are the first to apply agreement statistic to cultural constructs at the item level; therefore, this analysis is exploratory, and no appropriate guidelines for judging agreement are available.
A second useful indicator of agreement is intraclass correlation (James, 1982), which provides an estimate of the proportion of the total variance of a measure that is explained by unit membership (Bliese, 2000). Values larger than .05 are normally seen as sufficient for aggregation of individual-level constructs to a higher level (in our case, national cul-ture). One important difference between awg and intraclass correlation is that the former focuses on agreement within each group separately (yielding one estimate for each group), whereas intraclass correlation compares the variability within groups to the variability between groups (yielding one estimate across all groups).
Method
Participants
We only used those participants from the previous study who were born and raised in the respective country of data collection. The resulting samples sizes were as follows: Argentina (N = 189), Brazil (N = 254), Germany (N = 100), India (N = 150), Lebanon (N = 96), New Zealand (N = 118), Peru (N = 133), Saudi Arabia (N = 99), Taiwan (N = 137), United Kingdom (N = 42), and the United States (N = 183). The reason for excluding them is that we are focusing on the perception of norms within countries and individuals born outside the country might have different perceptions.
Instruments
The individualism and collectivism dimensions from Hofstede (2001) and GLOBE (House et al., 2004) were used. The GLOBE project differentiates between in-group col-lectivism and institutional colcol-lectivism (Gelfand et al., 2004). The GLOBE researchers furthermore differentiated between practices (“as is” questions) and values (“should be” questions). The former is probably more similar to our conceptualization of IC as cultural norms. We also included power distance as an indicator of divergent validity from both Hofstede (2001) and GLOBE (House et al., 2004). We substituted missing country-level data for Lebanon and Saudi Arabia, with the regional average (Arabic cluster) provided in both Hofstede and GLOBE.
Results
Agreement Within Cultures
The average agreement across all items and cultural samples was relatively low (.43). The mean across self items was .39; for attitudes versus norms, it was .43; for relational versus rational concerns, it was .41; and for goals, it was .50. The results for only those individuals that specified the nuclear family as a relevant in-group were highly similar (e.g., overall agreement was .42). The agreement levels for individual items per cultural group for both analyses can be obtained from the first author. An interesting pattern is noteworthy. The agreement is not uniformly low but varies across samples. For example, United Kingdom (.59), New Zealand (.56), and German samples (.53) show higher levels of agree-ment compared to lower levels in the Lebanese (.31) and Indian samples (.34). Lebanon and India are both societies with quite different ethnic and religious subcultures, with pre-sumably different dominant norms. Germany in contrast has been characterized as a homo-geneous and tight society (Chan, Gelfand, Triandis, & Tzeng, 1996). New Zealand is predominantly White European (Pakeha), with indigenous Maori generally assimilated into mainstream culture. The high value of the U.K. sample suggests strong and widely shared norms among our White British students about acceptable individual–group relations.
Cultural Variability
The overall mean of the intraclass correlation is .13, which suggests that perceptions of IC are collective constructs. The means for each scale vary, with the highest mean observed for self (.19), followed by rational versus relational concerns (.16), goal priorities (.11), and attitudes versus norms (.05).
Structure at a Cultural Level
We next examined the structure at a culture level (see Fontaine & Fischer, in press). We aggregated all items at the culture level (see Table 3). We then investigated whether the individual-level structure (using the results from the pooled within-group matrix; see Study 2a) could be replicated at the cultural level (Muthén, 1994). We used a variant of the mul-tigroup analysis within LISREL 8.7. We first examined whether each item would show a similar loading pattern at the cultural level. The fit was acceptable: χ2(406) = 1428.59,
TLI = .93, CFI = .94, RMSEA = .059. Then we constrained the factor loadings to be equal across levels. The fit was acceptable (and even improved minimally for the RMSEA): χ2(424) = 1437.87, TLI = .93, CFI = .94, RMSEA = .057. We did not constrain other
param-eters to be equal, because the variances at the aggregated level by necessity are smaller than at the individual level and, therefore, the interpretation of further constraints becomes ambiguous. However, demonstrating metric or factor-loading invariance demonstrates that the four-dimensional structure holds both at the individual and cultural level. We tested whether a higher order factor could account for the correlation among the four attributes at the cultural level. Given the small number of samples, a principal component analysis was run. A two-factor solution was found (explaining 84% of the variance). Rationality and goals loaded on one factor (explaining 57.77% of the variance), norms on the second (explained variance: 26.23), and self norms loaded moderately on both. Extracting a single factor, the highest loading was for goals (.88), followed by self (.86), rationality (.69), and norms (.57). The scores for the single factor are reported in Table 3.
Construct Validity at the Cultural Level
We observed significant rank order correlations between Hofstede’s individualism (rho = .70, p < .05) and institutional collectivism values (rho = –.84; p < .01) with indepen-dent conceptualizations of self. Greater individualism is associated with more indepenindepen-dent conceptualizations of self. We also observed a significant correlation between attitudes versus norms and institutional collectivism practices (rho = –.60, p < .05). Institutional col-lectivism practices are associated with a greater emphasis of norms (over attitudes). In-group collectivism did not correlate with our IC measures; neither did the power dis-tance dimensions. The single IC norm score did not significantly correlate with any of these measures.
Discussion Study 2c: Structure and Function at a Cultural Level
The most important finding of this analysis is that the structure of the instrument at the individual level holds at the cultural level. Therefore, the dimensionality is the same across levels, contrary to previous studies that reported different structures across levels (e.g., Hofstede, 2001; Schwartz, 1994; Triandis, 1995). However, the nature of the construct has to be discussed. First, the levels of agreement were not as high using the criteria derived from small-group research. On one hand, this could be expected, because groups in previ-ous research typically operate within a specific and well-defined environment; members repeatedly interact with each other; and therefore, the agreement about norms, practices, and beliefs will be higher (Anderson & West, 1998). National cultures, on the other hand, are more diverse and complex. Many competing stratifications in terms of social class, professions, gender, religion, ethnicities, or other groups might make agreement about dominant cultural norms hard to achieve.
Three related issues are of concern. First, widely used definitions of culture (e.g., Rohner, 1984; Smith & Bond, 1998) uniformly stress the approximately shared nature of
Table 3
Country-Level Means
Independent
Independent Rationality (vs. Interdependent) Attitudes Overall Country Self (vs. Relatedness) Goals (vs. Norms) Individualism
Argentina 3.54 3.43 3.94 4.27 3.79 United Kingdom 3.92 3.38 3.92 4.00 3.81 Saudi Arabia 3.77 4.01 3.78 4.21 3.94 Taiwan 3.75 4.08 4.02 4.04 3.97 Brazil 3.67 3.58 4.38 4.40 4.01 Peru 3.73 4.05 4.30 4.24 4.08 New Zealand 4.16 3.74 4.38 4.14 4.10 Lebanon 3.81 4.74 4.67 3.85 4.27 India 4.21 4.44 4.50 4.40 4.39 Germany 4.67 4.14 4.68 4.41 4.47 United States 4.56 4.36 4.60 4.62 4.53
cultural meaning and belief systems. However, using psychometric indices of this agree-ment might indicate that those beliefs and norms are not as widely shared as implied in the definition. One possibility would be to break societies into subcultures and to identify cul-turally homogenous segments within societies.
Second, we might relax those criteria suggested in the organizational literature, because the context of organizational groups is different from cultural groups. However, this leaves open the question of which criterion should be used as acceptable for identifying collective cultural constructs.
Agreement indices are based on the scale variance, and the variance itself might be an indicator of cultural differences (Au, 1997). The extent to which norms are shared might be an indicator of cultural tightness-looseness (Chan et al., 1996; Gelfand, Nishii, & Raver, 2006), independent of the cultural dimension of interest. This variation can be the focus of research in itself. These issues need to be addressed in more detail in future research. For the present study, we can only note that the agreement did not reach levels suggested for small-group research and that there was variation across cultures and attributes.
The correlations with other cultural level constructs showed some interesting and sur-prising results. First, the self-construal scale showed the highest and most consistent rela-tionships. It correlated with individualism (both Hofstede’s and GLOBE institutional collectivism values), which suggests that (a) the previous conceptualizations of IC have mainly captured the self-related aspect of individualism and (b) previous scales might have been closer associated with values than cultural practices and norms. Institutional collectiv-ism practices were correlated with greater reliance on norms and duties over personal preferences. This could be expected, because the GLOBE scale measured the extent to which institutions foster and demand loyalty and reward collective action. As a limitation, our sample only consisted of participants from 11 (although highly diverse) nations, which constrains efforts to explore correlates of the four attributes in greater detail; thus, the results need to be interpreted cautiously.
Study 3: Normative IC and Self-Rated Behavior
The final study investigates to what extent our normative IC scale is related to self-re-ported behavior, over and above self-referenced IC. We would expect that IC norms would predict additional variance in conformity and tradition-oriented behaviors after controlling for self-rated IC, whereas norms should not have a strong influence on self-directed and stimulation-oriented behavior (Fischer, 2006). Finally, we would predict that normative aspects also account for some variance in socially oriented behaviors targeted at closely related out-groups (altruism, helping) after self-referenced IC.
Method
Participants
A sample of 161 psychology students at Victoria University of Wellington, New Zealand, completed the survey as part of an in-class exercise. The majority of participants were female (70.6%), and the average age was 21.9 years (SD = 6.1 years). About 74.2% of the participants were born in New Zealand.
Instruments
IC. The same IC attributes scale was administered as previously described. The Cronbach’s alpha for self was .64; for rational versus relational concern, it was .78; for attitudes versus norms, it was .81; and for structure of goals, it was .78. In addition, the Triandis and Gelfand (1998) measure of vertical-horizontal IC was completed by partici-pants. Participants answered each item on a scale from 1 (not typical) to 6 (very typical). We used the original version of the questionnaire. Reliability for horizontal individualism was .72; for vertical individualism, .81; for horizontal collectivism, .64; and for vertical collectivism, .78.
Self-reported behavior. Seventeen self-rated behaviors taken from Bardi and Schwartz (2003) were included. We selected both individually oriented as well as socially oriented behaviors varying in the degree to which they are normatively constrained (for conservation and preserving the social order–oriented behaviors, see Bardi & Schwartz, 2003; Fischer, 2006). Participants were asked to rate how frequently they engaged in each behavior during the past 6 months relative to their opportunities to do so. For example, there are more opportunities to perform the behavior “say hello to my neighbors” than the behavior to “go hiking.” Answers were recorded on five Likert-type response scales ranging from never to
all the time. A principal component analysis was run on these items. The scree plot sug-gested a three-dimensional structure with the first three factors having eigenvalues of 3.50, 2.27, and 1.73, explaining a total of 44.11% of the variance. The first factor consisted of six items measuring conformity and tradition-oriented behaviors (e.g., “obey my parents,” “practice my cultural traditions,” “attend religious and spiritual services on important dates,” and “obey rules and regulations”). Cronbach’s alpha was .65. The second factor was altruism (six items; e.g., “lend things to people I know,” “help friends with school projects, moving, driving to the airport,” “spend time with friends when they are down to cheer them up”). Cronbach’s alpha was .71. The final factor was self-direction and stimulation oriented (five items; e.g., “read about intellectual topics that are not directly related to my classes,” “do unconventional things,” “take the time to learn something simply for the joy of learn-ing”). Cronbach’s alpha was .69. The reliabilities were similar to those reported by Bardi and Schwartz (2003) and acceptable given the relatively small number of items.
Results and Discussion
We used hierarchical regression to test our hypotheses. We regressed the three behaviors on the vertical-horizontal IC scale entered in the first step. In the second step, we entered the normative IC scale to examine the additional variance that is explained by normative processes. First, vertical-horizontal IC explained 19.3% of the variance in conformity and tradition-oriented behavior, F(4, 154) = 9.22, p < .001. Vertical collectivism was significant (β = .40, p < .001) as was horizontal collectivism (β = –.20, p < .01). More important, in the second step, normative IC added another 7.1% explained variance, ∆F(4, 150) = 3.63,
p < .01. Independent self-norms were negatively related to conformity-oriented behaviors (β = –.31, p < .01). Therefore, Hypothesis 1 was supported. When reversing the entry (vertical-horizontal IC after normative IC), the normative scales explained 15.1% of the variance and the Gelfand and Triandis (1998) scale added another 12.1%. Independent
self-norms were significant (β = –.42, p < .001) in step 1 and vertical collectivism (β = .33,
p < .001) and horizontal individualism (β = –.16, p < .05) at step 2.
Second, vertical-horizontal IC explained 8.4% of the variance in self-directed behaviors, ∆F(4, 154) = 3.53, p < .01. Horizontal individualism was also a significant predictor (β = .24, p < .01). Normative IC in the second step did not add any significant amount of vari-ance beyond self-referenced IC, ∆R2 = .007, F(4, 150) = .28, ns. This is in line with
Hypothesis 2. When reversing the entry, normative IC did not predict any variance at step 1, F(4, 154) = .14, ns, R2 = .004, whereas horizontal-vertical IC explained 8.7% in step 2.
Finally, vertical-horizontal IC explained 18.2% of the variance in altruism behavior,
F(4, 154) = 8.59, p < .001. Horizontal collectivism (β = .33, p < .001) and vertical collectiv-ism (β = .16, p < .05) were also both significant predictors. In the second step, normative IC added another 5.8% of the explained variance, ∆F(4, 150) = 2.87, p < .05. Independent self was a negative predictor (β = –.21, p < .05) and independent goals were a positive predictor (β = .22, p < .05). Therefore, this partially supports our Hypothesis 3. When enter-ing normative IC first, 6.0% of the variance was explained. The independent self norm was significant (β = –.23, p < .05), whereas the goal norm was not significant (β = .16, p = .13). Horizontal collectivism was the only significant predictor at step 2 (β = .37, p < .01, R2 = .18).
In addition, independent goals became significant as observed previously (β = .22, p < .05). Overall, we found that both self-report IC and subjective IC norms predict self-reported behavior. To understand behavior, studying individual differences and normative percep-tions can provide complementary information and one can not be substituted for the other. The opposite findings for independent self and goals after controlling for individual tations suggest a more complex pattern than previously predicted. Holding personal orien-tations constant, students perceiving that it is acceptable to follow their own goals (rather than those of the family) are more likely to help friends and nonfamily-related peers, which could be instrumentally motivated, because young college students rely on each other and need each other’s help and support at the university. In contrast, individuals perceiving stronger normative pressures toward interdependent selves (family focused) also tend to help their friends (indicating a potential spillover effect). This provides some evidence that group-specific norms can have different and conflicting implications across groups and that other in-groups can become salient in specific contexts. The interaction between the groups, associated norms, and the target of the behavior, as well as the implications of the specific behaviors for the involved groups seems relevant.
Overall Discussion
We reported the development of a theory-driven scale of IC norms, specifically focusing on norms as expressions of cultural constructs. This theoretically derived scale has the same structure across cultures and levels. Previous research suggested that IC is not isomorphic across levels, resulting in ambiguity of how nation-level dimensions such as Hofstede’s are related to individual-level attributes of IC. Therefore, this new scale is an important step in demonstrating that perceptions of norms can be isomorphic across levels and that it can contribute to a better understanding of sociocultural normative processes and effects on behavior vis-à-vis personality-related variables. Normative aspects of how people in general (a) perceive themselves, (b) relate to others, (c) follow their goals, and (d) what guides