國立交通大學
材料科學與工程學系
碩 士 論 文
化學添加劑在次微米溝漕填孔效果的快速檢測法開發
Development of Rapid Evaluation Method on Chemical
Additives for Cu Superfilling in Sub-Micron Trenches
研究生: 蔡和成 (H. C. Tsai)
指導教授: 吳樸偉 博士 (Dr. P. W. Wu)
化學添加劑在次微米溝漕填孔效果的快速檢測法開發
Development of Rapid Evaluation Method on Chemical
Additives for Cu Superfilling in Sub-Micron Trenches
研究生:蔡和成 Student: Ho-Cheng Tsai
指導教授:吳樸偉 博士 Advisor: Pu-Wei Wu
國 立 交 通 大 學
材料科學與工程學系
碩 士 論 文
A Thesis
Submitted to Department of Materials Science and Engineering College of Engineering
National Chiao Tung University in partial Fulfillment of the Requirements
for the Degree of Master in
Materials Science and Engineering
July 2009
化學添加劑在次微米溝漕填孔效果的快速檢測法開發
學生: 蔡和成 指導教授: 吳樸偉 博士
國立交通大學材料科學與工程學系
摘要
本研究開發一種應用在
120 nm溝槽之化學添加劑對填孔效果影
響的電化學快速檢測法,並藉由研究兩個彼此間化學結構與分子量相
近的新平整劑來驗證。此檢測法是以旋轉電極運用高低不同轉速模擬
溝渠開口與底部之不同鍍液流速,在定電流狀況下量測輸出電壓值差
來推斷鍍液配方之填孔效果。本研究的實驗以不同的平整劑與不同濃
度做為操控變因。旋轉電極的檢測結果與掃描式電子顯微鏡所觀測到
的填孔效果一致,且發現添加劑的化學結構與濃度對於填孔效果均有
顯著的影響。為了進一步解釋平整劑濃度對填孔效果的影響,使用晶
圓破片做為電極的定電流量測結果來解釋平整劑的作用機制。原子力
顯微鏡的分析與
X光繞射分析並無發覺平整劑濃度對於鍍膜表面平
整度與晶相的顯著影響。
Development of Rapid Evaluation Method on Chemical
Additives for Cu Superfilling in Sub-Micron Trenches
Student: Ho-Cheng Tsai Advisor: Dr. Pu-Wei Wu
Department of Materials Science and Engineering
National Chiao Tung University
Abstract
A rapid evaluation method on chemical additives for Cu filling performance in
120 nm is developed in this study. Two new levelers; 4-amino-2,1,3-benzothiadiazol and 6-aminobenzo-thiazole were employed to validate the usefulness of this method. A faster and a lower rotating speed were used to simulate the convection rates at the trench open and trench bottom, respectively. The potential difference between these two rotating speeds under galvanostatic measurements were used to predict the superfilling abilities. Levelers in various concentrations were explored. The prediction from the RDE analysis was consistent with the results of SEM observations. In addition, it was found that the chemical structure and concentration of leveler exerted considerable influences over the filling performances. To further explain the influence of leveler concentration to the filling behavior, galvanostatic measurements using wafer fragments as working electrode were conducted to investigate the responsible
致謝
本論文能夠順利完成,首先得感謝我的家人在經濟及親情上的全力支持,讓 我能無後顧之憂地全力衝刺學業,並在我沮喪挫折時給予我最大的鼓勵。 接著最要感謝的,是我的指導教授 吳樸偉老師兩年來不管在學業上、待人 接物上、與人生規劃上諸多的建議與指導。回想起三年前碩士班入學口試第一次 與老師見面,接著服役時再度參加考試,老師很恰巧的又是我筆試監考老師, 到放榜時加入老師實驗室的這段經過,只能歸因是冥冥之中的緣分與機緣。在這 兩年的研究生生活當中,老師給我許多的自由與個人發揮的機會,讓天性不喜歡 陳規舊章的我如魚得水,並得以按照自己的規劃完成出國深造的準備。另外要感 謝老師對我諸多提拔,讓我有諸多歷練的機會,即便我只是碩士班研究生,老師 仍然相當信賴的讓我與咏錚學姐一起負責與臺灣巴斯夫電子材料股份有限公司 (BASF Electronic Materials Taiwan Ltd.)的計畫,以及與詠策學弟共同負責交大五 年五百億綠色能源科技中心 (Center for Green Energy Technology)與應化所 林明 璋院士合作的固態氧化物燃料電池計劃。在這些研究當中,老師在科學方面的引 導思考以及邏輯的嚴密性訓練都對我有非常大的幫助。然而除了這些之外,老師 對於學術的嚴謹態度、做事情的輕重尺度拿捏,給我的影響較之學術上的指導更 有甚之。為了磨圓我太過稜角的個性與處事態度,老師也在我身上花了相當多功 夫與時間,不厭其煩的一一指正我。我想,如果我在這兩年之中曾經獲得任何那 麼一點小小的成功,甚至在將來有任何一絲絲成就,我都該感謝我這位最嚴格的 老師,卻也是最具包容心的學長。 實驗室的學長姐從我碩一剛來到時到現在我即將畢業的兩年間,給予我許多 不管是課業上還是生活上的幫助。感謝玉塵學長協助我完成與BASF 的合作計畫 以及他對我處事風格的包容,也感謝他熱心的分享許多人生經驗與保健注意事 項。謝謝勝結大哥,幫我拍SEM 試片與教我使用 EDX,也在實驗方面給了我非常多建議與協助,還有不時溫馨的幫買便當。感謝逸凡學長,為了我的報告情義 相挺,利用工研院的機台幫我拍SEM,更重要的是給我許多團隊合作與帶學弟 的心得經驗分享。感謝苡叡學長,以您曾經在業界打滾的經驗給我很多建議,您 在電泳方面經驗的傳授與指導,使我減少很多不必要的錯誤嘗試。謝謝雲閔學 長,我至今仍記得寒流來那晚您幫我拍試片,還遞給我一罐八寶粥的那股溫暖; 也要感謝您在實驗方向提出許多質疑給我許多思考的機會以及在寫paper 給我的 協助。謝謝育淇學長,多虧您在電化學量測方面的一些協助,我才能夠順利完成 預期的進度;也要謝謝您經常關心我找我聊天,願意傾聽我生活上、感情上的挫 折,並給我相當正面的鼓勵與建議。謝謝世儒學長,因為有您打下的基礎以及收 集的資料,我才能迅速上手,銅電鍍添加劑的研究能夠有一些成果,實在都該歸 功於您之前的奠基醞釀,才能在我手中開花結果。謝謝咏錚學姊,在我剛進實驗 室時給我許多幫助及無電鍍的指導。謝謝庭瑜學姊,因為有您的協助,我才能順 利的維持實驗室網站的運作。謝謝柏均學長,留給我們許多非常歡樂的回憶。謝 謝我同屆的賴俊翰與陳境妤同學,你們在實驗上的協助、疑點的討論、軟體及製 圖的幫助,都讓我倍感溫馨,很榮幸能夠與你們成為同學。也謝謝林老師以及曹 老師實驗室的同學,讓我在與你們一同的group meeting 裡學到很多,更感謝你 們在實驗室儀器以及貴儀經費上無私的協助。還得感謝實驗室的學弟妹們,感謝 你們協助我的實驗,接替我手中的工作,使我更能夠全力專注於實驗上。感謝儷 尹學妹幫我們合成PS 球;感謝儷曄學妹,辛苦的掌管驗室經費報帳以及化學結 構式製圖的協助;感謝立忠學弟,幫實驗室架構很棒的新網站,也感謝你的英文 課。最後,特別要感謝我任勞任怨的學弟,協助我完成SOFC 的計畫,一路由裝 置設計、詢價、電泳、SEM 到後續量測儀器架設等陪我走過來,謝謝你的幫忙,
諸多指導的林鵬 老師,感謝您在SOFC 計畫上大力協助。也要感謝很常關心我 的 陳建瑞老師及 吳耀銓老師,非常謝謝你們的關心與鼓勵;謝謝 陳智老師, 擔任您助教一學期給我許多很寶貴的經驗。感謝BASF 公司在合作計劃上鍍液及 晶圓的支持。正如藍蔭鼎先生在<鼎廬小語>的那句經典傳唱,「要感謝的人太多 了,那麼--就感謝天吧!」這本論文能夠順利完成,必須歸功於一路上給我幫助、 支持、鼓勵的你們,謝謝你們!
Contents
摘要...i Abstract...ii Acknowledgements...iii Contents...ⅵ List of Figures...ⅷ List of Tables...xi Chapter 1 Introduction...1Chapter 2 Literature Review...9
The Types of Profile Evolution in Damascene Plating...9
The Concentrations of Cupric Ion and Sulfuric Acid... 9
The Current Density...12
The Rotating Rate ………...13
Role of Chloride Ion...14
Suppressor...18
Accelerator...20
Leveler...23
Three Additive Model...29
Chapter 3 Experimental...31
Substrate...…...32
Analytic Instrument………...36
Chapter 4 Results and Discussion………...38
Chapter 5 Conclusions...62
References...63
List of Figures
Figure 1-1 A comparison of Al subtractive RIE and Cu damascene process………... 4
Figure 1-2 A comparison between Cu single- and dual-damascene processes……... 5
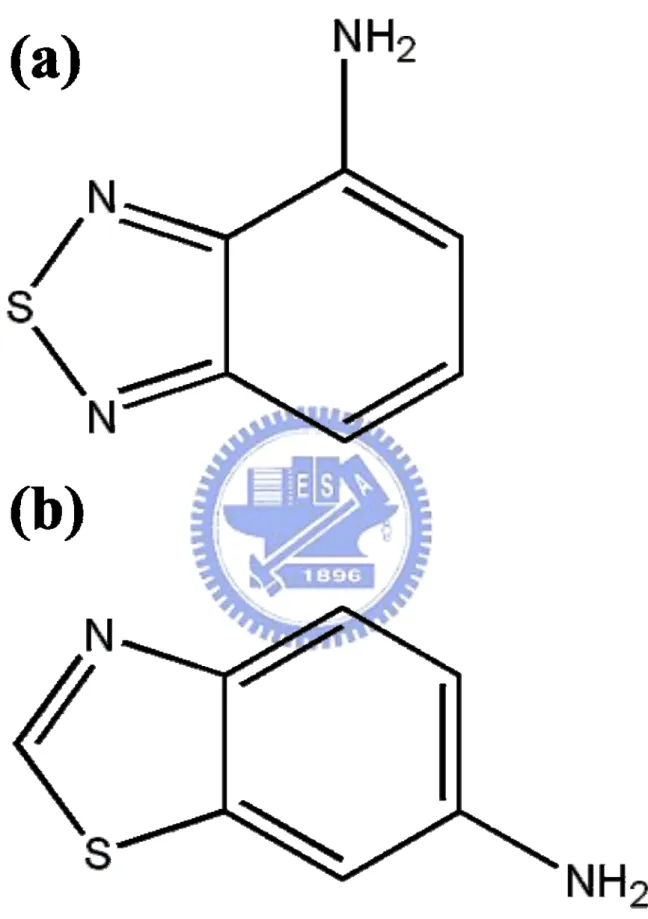
Figure 1-3 Molecular structures of levelers under study; (a) 4-amino-2,1,3-
benzothiadiazol and (b) 6-aminobenzo-thiazole………...………….... 8
Figure 2-1 Three possible ways of profile evolution in plated copper; subconformal,
conformal, and superconformal deposition………..………... 10
Figure 2-2 Effect of the cylinder electrode rotation speed and current density on the
leveling power………..………... 14
Figure 2-3 Illustration of various outer and inner sphere electron transfer models of
Cu2+ complexes………..…………..………... 16
Figure 2-4 Adsorption model for (A) rod-like PEG and (B) spherical PEG molecule
………..………..………. 17
Figure 2-5 A schematic diagram of PEG behavior model………...…19
Figure 2-6 A schematic illustration of the proposed mechanism for different filling
aspects between MPSA and SPS/aged MPSA……….…………... 21
Figure 2-7 A schematic illustration of the suggested polymeric Cu(I)BTA complex...
………..……...……….………... 24
Figure 2-8 Adsorption and desorption ability of 2-MP and 4-MP onto a Cu surface
…...……….………... 26
Figure 2-12 The dependence of derivative of current density with respect to the
diffusion layer thickness, as well as the variation of p for three geometries as a function of JGB concentration……….……... 30
Figure 3-1 Flow chart for the experimental steps involved……….……... 31
Figure 3-2 A cross-sectional scheme for the Si substrate…………...……….……... 32
Figure 3-3 Cleaved Si substrate for Cu electrodeposition; (a) length and (b) width
scale...……….……….….…………... 33
Figure 3-4 Si substrate positioned on a microscopic slide……..……...……….…... 34
Figure 3-5 A setup for Cu electrodeposition………...……….……... 36
Figure 3-6 A setup for RDE analysis………...……….……... 37
Figure 4-1 Representative voltage responses for galvanostatic RDE measurements at
200 and 430 rpm using a Cu plating bath with 25μM of 4-amino-2,1,3 -benzothiadiazol……….……... 39
Figure 4-2 Galvanostatic RDE measurements at 200 and 430 rpm using a Cu plating
bath with; (a) base electrolyte, and (b) PEG containing solution…….………... 41
Figure 4-3 Representative voltage responses for galvanostatic RDE measurements at
200 and 430 rpm using a Cu plating bath with 4-amino-2,1,3-benzothia-diazol in concentration of (a) 1, (b) 10, (c) 25, (d) 50, and (e) 100 μM; as well as 6-aminobenzo-thiazole in (f) 1, (g) 10, (h) 25, (i) 50, and (j) 100 μM ………42
Figure 4-4 Profiles for potential difference (Δŋ) from galvanostatic RDE
measurements at 200 and 430 rpm using a Cu plating bath with; base electrolyte (▲) , PEG contained solution (◇), 4-amino-2,1,3-benzothiadiazol (▓), and 6-aminobenzo -thiazole (○) at various concentrations………...………47
Figure 4-5 Cross-sectional SEM images for the Cu plating bath; (a) no additives, (b)
Figure 4-6 Cross-sectional SEM images for the Cu plating bath with 4-amino-2,1,3
-benzothiadiazol at concentrations of (a) 1, (b) 10, (c) 25, (d) 50, and (e) 100 μM, respectively………..……….……... 50
Figure 4-7 Cross-sectional SEM images for the Cu plating bath with 6-aminobenzo
-thiazole at concentrations of (a) 1, (b) 10, (c) 25, (d) 50, and (e) 100 μM, respectively………..……….……... 51
Figure 4-8 A schematic diagram illustrating the difference in adsorption abilities for
4-amino-2,1,3-benzothiadiazol and 6-aminobenzo-thiazole that results in distinct spatial distribution at trench bottom and mouth………..………….……... 53
Figure 4-9 Galvanostatic current measurements of (a) 4-amino-2,1,3-benzothiadiazol
and (b) 6-aminobenzo-thiazole: 0 (◇), 1 (●), 10 (○), 25 (▽), 50 (★), and 100 μM (▲), respectively………..………….………... 56
Figure 4-10 A schematic illustration of the synergistic inhibiting effect between PEG
and leveler………..………..………... 57
Figure 4-11 X-Ray diffraction patterns of the electroplating Cu films on the patterned
wafer; (A) 4-amino-2, 1, 3-benzothiadiazol and (B) 6-aminobenzo-thiazole………. 58
Figure 4-12 AFM analysis on 2D surface roughness in (a) base electrolyte without
additives, (b) PEG, (c) 4-amino-2,1,3-benzothiadiazol at 25 μM, and (d) 4-amino-2,1, 3-benzothiadiazol at 100 μM………..……….…….……... 60
Figure 4-13 AFM analysis on 2D surface roughness of 6-aminobenzo-thiazole in (a)
List of Tables
Table 2-1 Effect of CuSO4 and H2SO4 concentrations on the diffusion coefficient of
Cu2+ in electrolyte at 65oC………..………... 11
Table 2-2 Effect of temperature on the Cu2+ on the diffusion coefficient in 40 g/L
CuSO4 and 160 g/L H2SO4 electrolyte………….………... 11
Chapter 1 Introduction
The first transistor was invented by John Bardeen, Walter Brattin, and William Schockley in 1947. It was a three-element device, where an electronic cross junction was formed between solid state materials. Compared to a conventional vacuum tube, the solid-state device exhibited numerous advantages such as small size, no vacuum, reduced weight, low power demand, and long life time. Since the oxide of Ge was dissolvable in water, protection of the Ge semiconductor surface became a daunting challenge. When a single crystal silicon was first prepared in the middle 1950s, the Ge was quickly replaced by Si as the principal material for semiconductor applications because the latter formed a stable intrinsic oxide easily. Later, the first integrated circuits (ICs) was demonstrated by Jack S. Kilby at Texas Instruments on February 6 of 1959. In early 1958, Swiss physicist Jean Horni invented a technique to diffuse impurities into the Si to build a planar transistor by using the SiO2 as an insulator. In mid 1959, Robert Noyce developed the first true IC-connected planar transistors. This transistor consisted of back-to-back p-n junctions for isolation, diode-isolated silicon resistors, SiO2 insulations, and evaporation deposited metal interconnect. Subsequently, the Noyce’s IC became the model of all ICs.
In 1965, Gordon Moore, reported his observation on the trend of IC
development over1958 to 1965, in which be noted that “The complexity for minimum component costs has increased at a rate of roughly a factor of two per year ... Certainly over the short term this rate can be expected to continue, if not to increase.
65,000. I believe that such a large circuit can be built on a single wafer.” His observation became the famous “Moore’s Law” and served as the guide for semiconductor advancement in the following decade.
With the advancement in technologies, ICs that cost-effective, higher performance, and faster signal propagation ICs are always desirable. These attributes can be simply achieved by reducing the feature sizes. In the 2008 update from the International Technology Roadmap for Semiconductors (ITRS), it was projected that the physical gate length of micro processor unit (MPU) to be 32 and 22 nm in 2007 and 2011, respectively. As the feature size becomes smaller, the thickness for the gate oxide is also reduced correspondingly. To further improve the chip performance, high-k materials are often used to minimize unnecessary circuit leakage. On the other hand, once the line width falls below 0.25 μm, the interconnect delay would increase substantially and counterbalance the benefit of decreasing gate-delay. The primary factor for interconnect delay is the resistance-capacitance delay (RC delay), which is due to the resistance of interconnects itself and the capacitance between the multi-interconnects layers. To overcome this problem, low-resistivity metals and low-k materials are proposed.
Al and its alloys are typically used as the interconnect material because their low resistivity (2.66 μΩ-cm), good adhesion to Si and SiO2, as well as simple etching and deposition. Unfortunately, the 1 at% solubility of Si in Al at 500oC enables Si diffusion into Al, with the remaining void filled by Al. As a result, a phenomenon called Al spiking is observed. In order to prevent this undesirable interaction, a barrier layer should exist between the Al and Si. Alternatively, 1 at% of Si is added to Al purposely to reduce this inter-diffusion. On the other hand, electromigration effect becomes a critical issue as the interconnect scales down with shrinking device feature.
(1085oC), better thermal conductivity (3.98 W/cm․K), and improved electromigration resistance. Thus, the Cu becomes the most suitable candidate to replace Al. However, the main problem for Cu in interconnect is its non-volatile halide compound during dry etching. Nevertheless, this problem is quickly resolved by the chemical mechanical polishing (CMP) process. A comparison between Al subtractive reactive ion etching (RIE) and Cu’s damascene processes is presented in Fig. 1-1 [1]. A subsequently developed Cu dual-damascene process offer more advantages in cost comparing to the single damascene process. In dual damascene process, the trench and vias are formed prior to the barrier/seed layer/metal fill deposition. Therefore, only one metal fill and CMP process are needed for a single level interconnect [1]. Fig. 1-2 displays the comparison between the single- and dual-damascene process [1].
Figure 1-2. A comparison between Cu single- and dual-damascene processes [1].
Cu can be deposited by numerous methods including physical vapor deposition (PVD), chemical vapor deposition (CVD), atomic layer deposition (ALD), and electrochemical deposition. In general, the CVD process can deliver better step coverage and gap fill capability. But its expensive precursor is not competitive compared to other deposition routes. In the PVD process, because variation in the arrival angle, “Overhand” occurs with the depositing film and void is typically present after gap filling. In addition, expensive instrument and vacuum process make CVD
With a shrinking feature size, the fabrication of Cu interconnects without defects in smaller dimensions becomes a critical issue. Variation in the current density distribution within high-aspect ratio trenches or vias engenders distinct deposition rates in different parts of the feature. In order to achieve desirable superfilling, various chemical additives are added to the electroplating bath to improve filling performance. To date, there are intensive interests to investigate the interactions and mechanisms between the additive molecules and Cu2+ ions in the plating baths.
A typical electroplating cell consists of anode, cathode, external power supply, and electrolyte. In Cu electroplating system, an anodic Cu is served to supplement the Cu2+ ions in the electrolyte. A common acidic Cu electroplating baths includes hydrated cupric sulfate (CuSO4․5H2O), sulfuric acid (H2SO4), and chloride ions (Cl-). The cupric salts provide the Cu2+ ions. The H2SO4 controls the pH value and increases the conductivity of the electroplating baths, reducing the polarization of the electrodes. The Cl- also plays important roles in Cu electroplating. It is known that a suitable concentration of Cl- would enhance the brightness of the deposited Cu films, and several synergistic effects between the additive molecules and the Cl- are established to affect the resulting Cu films.
Three types of additives have been used in Cu electroplating, namely, suppressor, accelerator, and leveler. Suppressors are usually polymers such as polyethylene glycols (PEG), which combines with Cl- to form an inhibiting film to retard Cu deposition. Accelerators are usually thiol and disulfide molecules, such as 3-mercapto-1-propanesulfonate (MPS or MPSA) and bis(3-sulfopropyl) disulfide (SPS). Levelers are compounds such as Janus Green B (JGB) and Diazine Black (DB) that promote surface uniformity and reduce “over-fill” bumps. Since IBM reported the dual damascene process for Cu interconnects technology in 1997 [2], the study of
However, most of the researches focus on suppressors, accelerators, and their interactions. In addition, most literature related to levelers discuss the effects of leveler in three-additive systems, and there are few studies discussing the leveler effects in two-additive systems and its relevant inhibiting mechanism. In this study, we select two new levelers; 4-amino-2,1,3-benzothiadiazol and 6-aminobenzo-thiazole to study their superfilling performance. Their chemical structures are shown in Fig. 1-3. They are derivatives from benzotriazole (BTA), a compound that has been recognized as an effective leveler [3-6]. Despite of similar molecular weights and functional groups, both levelers reveal distinct structural arrangements. As a result, we surmise that their adsorption characteristics in the trenches would be considerably different, resulting in distinguishable filling performances. In order to identify their distinctions, a method using rotating disk electrode (RDE) is employed to predict superfilling abilities for both levelers and direct SEM images are conducted for experimental confirmation. Galvanostatic measurements are also used as an indicator for superfilling evaluation.
Figure 1-3. Molecular structures of levelers under study; (a) 4-amino-2,1,3
-benzothiadiazol and (b) 6-aminobenzo-thiazole.
Chapter 2 Literature Review
The Types of Profile Evolution in Damascene Plating
After demonstrating the first fully integrated devices with Cu interconnects in 1997 [2], a mathematical model for damascene plating was proposed by Andricacos et al. in 1998 [7]. In their work, they proposed three possible ways for the profile of plated Cu to evolve with time. They are shown in Fig. 2-1. For a defect-free filling, the deposition rate at the trench bottom should be higher than that on sidewall of the feature, leading to a superconformal deposition. This phenomenon is also called “superfilling.” The superfilling is attributed to the inhibiting additives in copper electroplating bath consumed on the wafer surface that suppresses the kinetics of Cu deposition. Since the interior regime of the trench is less-populated by the additive, we expect to see a higher deposition rate within the trench.
The Concentrations of Cupric Ion and Sulfuric Acid
The concentrations of Cu2+ and H2SO4 not only greatly affect the diffusion coefficient of the Cu2+ but also the filling performance. The effects of Cu2+, H2SO4 concentration, and temperature have been discussed thoroughly by Moats et al. [8]. Some important results are presented in Table 2-1 and 2-2. It can be concluded that the diffusion coefficient of Cu2+ decreases as the concentrations for CuSO4 and H2SO4 increase. Moreover, the diffusion coefficient improves with increasing temperature as expected.
Figure 2-1. Three possible ways of profile evolution in plated copper; subconformal,
Table 2-1. Effect of CuSO4 and H2SO4 concentrations on the diffusion coefficient of Cu2+ in electrolyte at 65oC [8]. 160 g L-1 H2SO4, 65oC 40 g L-1 Cu, 65oC Copper (g L-1) D (×10-6 cm2s-1) H2SO4 (g L-1) D (×10-6 cm2s-1) 35 12.2 160 12.3 35a 12.1 160a 12.0 40 12.3 180 11.1 40a 12.0 198 10.7 44 11.6 250 9.8 45 11.8 50 11.7 50a 11.4 60 11.3 a Replicates
Table 2-2. Effect of temperature on the Cu2+ on the diffusion coefficient in 40 g/L
CuSO4 and 160 g/L H2SO4 electrolyte [8].
Temperature (oC) D (×10-6cm2s-1) 40 6.87 45 7.69 45 7.94 50 8.62 50 9.27 55 9.84 55 10.0 60 10.7 61 10.7
The effects of Cu2+ and H2SO4 were also discussed by J. Reid in 2001 [9]. He proposed that the electroplating bath should balance the advantages of higher and lower acid solutions to reach a compromised value. A mathematical model discussing fluid flow, transport by diffusion, migration, convection, and multiple species in Cu electroplating bath was proposed by Georgidadou et al. [10]. In their work, they simulated the shape evolution during electroplating in different width and aspect-ratio trenches by testing two different H2SO4 concentrations. A similar simulation was also conducted by A.C. West in 2000 [11]. In his study, he defined two dimensionless parameters which corresponded to the concentration of Cu2+ and additives to discuss the filling performance. Another important parameter defined in his work is:
⎟ ⎟ ⎠ ⎞ ⎜ ⎜ ⎝ ⎛ − = top top bottom i i i p 100
Where ibottom and itop are the current density at the trench bottom and trench top,
espectively. The current density difference between the trench top and bottom is used to evaluate the filling performance.
The Current Density
Different current densities during electroplating often lead to considerable differences in resistivity and surface roughness. These effects were discussed by Chang et al. previously [12-13]. In their work, the surface roughness and resistivity for the deposited Cu film were lower at specific current density range. This specific current density range varied contingent on the electroplating bath selected.
The Rotating Rate
In the electroplating of commercial wafer, a fountain flow type equipment is widely used. In laboratory experiments, the electroplating is often carried out with stirring or air bubbling to ensure necessary mass transport. It is understood that the agitation of the electroplating bath also makes a difference in the convection rate between the trench open and bottom. This convection-dependent adsorption is to be discussed later. Unfortunately, previous authors did not disclose relevant stirring rates in their work. In the experiment form J.J. Kelly et al. in 1999 [14], the authors used the threaded rotating cylinder electrode as the working electrode to study the leveling effect. They found that the leveling power was greater when a specific relation was established between the current density and rotation speed, as shown in Fig. 2-2.
Figure 2-2.Effect of the cylinder electrode rotation speed and current density on the
leveling power [14].
Roles of Chloride Ion
The roles of Cl- were investigated using scanning electron microscope (SEM), optical microscope (OM), electron paramagnetic resonance (EPR), and galvanostatic measurements by Dow et al. [15-17]. In their work, the authors determined that the Cl- played three distinct rules; the electron bridge for the reduction of Cu2+, the anchor for suppressor, and the promoter for accelerator. The electron transfer bridge made by Cl- between the Cu2+ was deduced form the broadening of the EPR peak, which was due to the delocalization of unpaired electrons. Polarization effects were apparent from the polarization curves in galvanostatic measurements of the electrolyte with
SPS or MPS accelerator but without Cl-. In the SEM observations, cuprous chloride (CuCl) crystals were used as tracers for adsorbed-PEG. It was determined that the CuCl resided mostly at the bottom of the micro-via rather than the external surface. This phenomenon supported that the desirable bottom-up filling behavior was succeeded by the unique synergistic effect between accelerator and Cl-. The electrons transfer models for the Cu2+ is shown in Fig. 2-3 [17].
The role of Cl- in suppressing the Cu electrodeposition with PEG was widely discussed by J.J. Kelly et al. [18-19]. The authors used a polarization curve to detect the polarization behavior for the electrolyte with or without additives. They found that the polarization curves for the acid electrolyte containing only the PEG were almost identical. However, those polarization curves revealed considerable response with the addition of PEG and Cl-. The frequency difference from quartz crystal microbalance (QCM) was also used to detect the effects for the concentration of Cl- and the molecular weight of PEG. It was used to predict the adsorption behavior of PEG, as shown in Fig. 2-4 [18]. The authors also proposed the inhibiting effect of PEG, as shown in Fig. 2-5 [19]. It displays that the adsorption active sites were blocked by PEG molecules. Fitting between experimental and simulated impedance spectra for different Cl- concentrations also agreed with the steady-state polarization curves, and their results confirmed the hypothesis of a dimensionless surface coverage of PEG. A near complete surface coverage of PEG molecules competed available adsorption sites with Cu2+, forming an inhibiting monolayer composed of spherical packed PEG molecules that were responsible for the polarization effects.
Figure 2-3. Illustration of various outer and inner sphere electron transfer models of
A mathematical model was proposed by K.R. Hebert [20]. This model formulated a relation between the adsorbed PEG and Cl-, in which the PEG coverage was determined by the Cl- adsorption. After fitting with experimental results, the model was applied to predict steady-state current-potential curves. Their results helped elucidating the synergistic effects between PEG and Cl-, as well as the reasons for the optimized Cl- concentrations in Cu electroplating baths.
Suppressor
PEG is extensively used as a suppressor, which is a critical component in the Cu electroplating bath. Although the three-additive system was widely used in many studies for Cu electroplating, some literature reported only two-additive system, that is, accelerator and suppressor. Superfilling can be achieved by combining these two additives at proper ratios, but the “overfill bump” was typically formed above the superfilled features. Recently, some studies demonstrated that using only the PEG as a suppressor with optimum Cl- concentration could also achieve desirable bottom-up superfilling on patterned wafers [21-23]. In our work, we also achieved superfilling with an electrolyte without accelerator. This phenomenon can be explained by the depolarization effect of Cl- for Cu electroplating and the inhibiting effect of PEG. As the ratio between these two components was optimized, a proper spatial distribution of Cl- and PEG at different locations allowed the bottom-up filling.
PEG is a common name for a polymer called polyethylene glycol. The PEG can be obtained with average molecular weight (Mw) from 200 to 35000 g/mol. Recently, Dow et al. discussed the influence of PEG molecular weight on the filling performance in microvias [24]. Their study indicated that the only lager PEG whose Mw exceeded 2000 g/mol could effectively polarize the cathode. Furthermore, the desirable filling would be obtained with PEG ranging between 6000 and 8000 g/mol. When the Mw of PEG was above this range, a strong convection-dependent adsorption induced a significant drop of filling performance in larger via because the
fluid motion is more active at the bottom of the large via compared to the smaller one. The morphology for the adsorbed PEG and its potential dependency also
attracted many attentions. Yokoi et al. suggested that PEG trapped the cuprous ion (Cu+) on the surface to form an adsorbed inhibiting form [25], Kelly et al. indicated
PEG molecules [18], and Jin et al. used the AFM to determine that the adsorbed particles revealed a cone shape with a bottom radius about 15-25 nm and a height of 2-4 nm [26].
Accelerator
Accelerator is sometimes called brightener because it can increase the brightness of the deposited Cu surface. There have been many studies discussing common accelerators such as SPS and MPS(A). The accelerator could help the reduction of Cu2+ because of its synergistic effects with Cl-. It was well known that the reduction from Cu2+ to Cu+ is the rate-limiting step, and the thiol group belonging to the accelerator can help the creation of Cu+ by the synergistic effects with Cl- [16-17]. However, in the study of superfilling evolution dependence on the aging time of MPSA by Kim et al. [27], the authors reported that the MPS was ineffective in the superconformal deposition of Cu. The UV-vis spectroscopy confirmed that the MPS was converted to SPS after aging for 12 hrs. The SEM observation revealed substantial differences in the filling performance between the MPSA containing electrolytes with different aging time. A schematic illustration for the suggested mechanism is displayed in Fig. 2-6.
In addition to SPS and MPS, some substitutive accelerators were also explored. Cho et al. presented superfilling using 3-N,N-dimethylaminodithiocarbamoyl -1-propanesulfonic acid (DPS) as an accelerator [28], and discussed the equilibrium of DPS related to its concentration, which affected the acceleration effects.
Figure 2-6. A schematic illustration of the proposed mechanism for different filling
aspects between MPSA and SPS/aged MPSA [27].
[31-35]. The authors used a slow scan rate voltammetry, and identified the slope of the voltammetric curves to show acceleration of Cu deposition as a function of concentration of MPSA. The i-η curves was described by the Bulter-Volmer equation, and the time-dependent fractional surface coverage θ(t) was calculated assuming irreversible statistical adsorption. The simulating i(θ)- η(θ) curves also revealed hysteresis as a function of CMPSA which was ascribed to the competitive interaction between the additives. They demonstrated nicely with the experiments, particularly for higher CMPSA. As the interface moved, the local coverage increased on the concave surface and decreased on the convex portions. This model brought general implications for understanding the accelerator and was clearly different from the leveling models, which was based on the diffusion limited accumulation of inhibiting molecules. Curvature-enhanced accelerator coverage mechanism was soon extended as curvature enhanced adsorbate coverage mechanism, because this mechanism is suitably applied for not only accelerator but also other chemical additives [36].
A similar simulation model was proposed by West et al. [29], and the aspect of this model was that the reduction of the surface area available for additive adsorption engendered a temporary decrease in the amount of inhibition. There were three assumptions made in A.C. West’s model [29]:
1. Acceleration at the bottom of a feature is due to a change in surface area as deposition proceeds. The decrease in surface area results in increase in the amount of SPS.
2. An increase of the surface coverage of SPS lowers the surface coverage of PEG. 3. The concentration variations in the electrolyte of all species can be neglected. This assumption becomes increasingly appropriate as feature size decreases and
surface coverage of PEG and SPS. The change in surface area was estimated from the local angle of interaction of neighboring elements and the local current density. The simulation were applied for different trenches and compared with the SEM observations.
CEAC mechanism and A.C. West’s model both simulated the filling performances based on the same hypothesis, that is, the surface coverage of the additives changed with the surface area. Then the authors connected the surface coverage of additive with the local current density distribution to simulate the Cu depositing evolution and bump formation.
Leveler
Leveler is one kind of additives used to increase the smoothness of the deposited metal films by its inhibiting effects. However, the “leveling effect” does not refer only for the levelers. Definition of leveler is still disputable and ambiguous, and specific function groups of molecules are usually used to distinguish leveler. Chang et al. and Lin et al. reported that the additives with benzyl and amino groups were desirable levelers [12,37]. However, Dow et al. indicated that amine and heterocyclic compounds were common functional groups of levelers, and usually, these levelers contained primary, secondary, tertiary amines, or particularly quaternary ammonium salts. Therefore, these levelers commonly possess one or more positive charges [38]. J. Reid interpreted that leveler is one kind of current suppressing molecules, and usually added to the plating bath with a low concentration [9]. Kim et al. pointed out that the
(ⅰ) cationic or neutral heteroaromatic; (ⅱ) condensed heteroaromatic; (ⅲ) polymers with aromatic, cyclic or nitrogen containing substituents.
Several levelers were discussed in previous literature and described below. Benzotriazole (BTA) was known not only as an excellent corrosion inhibitor for Cu surface but an inhibitor for Cu deposition [3-4]. Leung et al. investigated the effects of four substituted benzotriazole compounds for Cu electrodeposition by AFM and secondary ion mass spectroscope (SIMS) [3]. BTA and the effectively substituted compounds of BTA for Cu electroplating were believed to act as an chain like inhibiting adlayer. The structure of the polymeric Cu(I)BTA complex are shown in Fig. 2-7. The authors suggested that the smoothening effect was strongly related to the ability of the additives to form a polymeric complex through the triazole ring and/or the substituent groups.
Figure 2-7. A schematic illustration of the suggested polymeric Cu(I)BTA complex
[3].
Kim et al. also studied the effects of BTA in the electroplating solution on the properties of the deposited copper films [4]. Moffat et al. studied the superconformal deposition at trenches in various scales using electroplating bathes with different additives [5]. Some additives, such as thiourea, ammounium peroxydisulfate, 4-mercaptopyridine (4-MP), 2-mercaptopyridine (2-MP), and 2-aminobenzothiazole
(2-ABT) were also employed as levelers in the Cu electroplating bath. The filling performance and inhibiting ability of those levelerst were studied by Lin et al. [37]. The difference in adsorption/desorption ability between 2-MP and 4-MP were compared to elucidate the filling performance difference between them. Fig. 2-8 provides an illustration scheme for their behaviors. Diethyl safranine azo dimethyl aniline (Janus Green B, JGB) was also widely applied and studied in literature [6,14, 38,42-45], and its molecular structure is displayed in Fig. 2-9. Kim et al. investigated the impact of the branched polyethyleneimine (PEI) on Cu electrodeposition by voltammetric curves and SEM observations [39]. Bozzini et al. reported the Cu electrodeposition from acidic electroplating bath containing a promising polymeric leveler, benzyl-phenyl-modified polyethyleneimine (BPPEI) [40].
Convection-dependent adsorption of JGB was proposed by several authors [38, 43-45]. Dow et al. studied the electrochemical and inhibitive behaviors characterized by cyclic linear sweep voltammetry (CLSV) using different rotating speeds of the working electrode (WE) [38]. They found that the inhibition effect of JGB on Cu deposition depended on the applied potential of the WE. As the rotation speed was increased, the inhibiting effect of JGB was correspondingly enhanced. The enhanced inhibiting effect achieved by stronger forced convection was attributed to the diffusion-limited transfer of JGB and the convection transport of Cl-. Sun et al. calculated the stripping areas of the cyclic linear voltammetry (CVS) at different JGB concentrations. They found the difference between the stripping area of 100 rpm and 2500 rpm revealed the largest value in JGB ranging 20 to 50 mg/L. Hence, they
study inhibiting effect under different rotation speeds of RDE and reached the same conclusion as the literature proposed by Miura and Honma [45]. Based on these studies, Dow and Liu presented a feasible method to evaluate the filling performance of Cu plating formulas [6].
Figure 2-8. Adsorption and desorption ability of 2-MP and 4-MP onto a Cu surface
Figure 2-9. Molecular structure of JGB [38].
Recently, the deactivation effect of leveler to the adsorbed accelerator was widely studied. Although the superfilling can be achieved in electrodeposition by electrolyte containing only accelerator and suppressor, the addition of leveler could control the bump formation and relieved subsequent CMP process. The effects of Cu deposition of PEI and dodecyltrimethylammoniumchloride (DTAC) were studied by Kim et al. [39,46]. They suggested that the addition of cationic polyelectrolyte, PEI, quenched the activity of SPS. This effect was attributed to an ion-pairing interaction between the cationic imine groups of the polyelectrolyte and the anionic tail groups of the adsorbed SPS accelerator [39].
A diffusion-adsorption mechanism was widely used to interpret the leveling effect of both suppressor and leveler [47-49]. Roha and Landau presented a quantitative model for the leveling effect of plating additives [47]. The fundamental assumption for this model was that the coverage of adsorbed additives was controlled by mass transport. They discussed the mass balance through three processes;
Tobias used some assumptions made by previous authors and presented a model based on the diffusion-adsorption mechanism [48]. As shown in Fig. 2-11, because the shorter diffusion distance from the bulk solution to the peak relative to the valley, more inhibitors arrived at the peaks. Therefore, the electrodeposition at the peak was more inhibited, and the profile became smoother. The electrodeposition of Ni into an angular trench in the presence of coumarin, a widely used inhibitor, was simulated using boundary layer approximations for flow parallel and transverse to the grooves in this literature. Cheng and West employed an electrohydrodynamic (EHD) impedance spectroscopy to study the influence of coumarin in Ni electrodeposition [49]. In their study, the determination of the interfacial kinetic and transport parameters relevant to their models of leveling agents was clearly demonstrated.
Figure 2-11. A schematic illustration of diffusion-adsorption mechanism of leveling
effect [48].
Three Additive Model
Cao et al. proposed a model describing the effect of SPS (accelerator), PEG (suppressor), and JGB (leveler) on the leveling efficiency at sub-micrometer trenches [50]. Their simulating results were also compared to the filling experiments. The dependence of the derivative of the current density with respect to diffusion layer thickness, as well as the variation of p for three geometries as a function of JGB concentration is shown in Fig. 2-12.
The authors proposed a parameter for convience, that is:
⎟ ⎟ ⎠ ⎞ ⎜ ⎜ ⎝ ⎛ − = top top bottom i i i p 100
When p > 0, superfilling should be observed. Only when p ≈ 0, a nearly conformal deposition is expected.
Figure 2-12. The dependence of derivative of current density with respect to the
diffusion layer thickness, as well as the variation of p for three geometries as a function of JGB concentration [50].
Chapter 3 Experimental
Fig. 3-1 provides the flow chart for the experimental steps involved in this research work.
Substrate preparation Electroplating
solution preparation Electroplating Galvanostatic measurement SEM AFM XRD RDE Analysis
Substrate
A patterned Si wafer (8 inch in diameter) was precoated with 80 nm of Cu as a seed layer, resulting in open trenches of 120 nm width and 300 nm depth. The structure for the wafer is shown in Fig. 3-2. The wafer was cleaved into small pieces (2.5 cm in length, 1.5 cm in width, geometric area ~3.75 cm2) for following Cu electrodeposition, as shown in Fig. 3-3. Ethanol and acetone were used to flush the sample in order to remove any organic residue on surface. After cleaning, the substrate was rinsed in deionized water, and cleaned by nitrogen gas. Then, the substrate was positioned on a microscopic slide by conductive Cu tape, as shown in Fig.3-4. The microscopic slide was clipped onto the vessel wall.
Figure 3-2. A cross-sectional scheme for the Si substrate.
Pad Oxide 9 nm
Direction of fluid motion
SiN 165 nm
Barrier and Seed: TaN 6 nm/Ta 9 nm/Cu 80 nm
BD 260 nm
(Black Diamond)
Silicon
Figure 3-4. Si substrate positioned on a microscopic slide.
Copper Electroplating Bath
Electroplating of Cu film was performed in solutions with different leveler concentrations. Compounds including 4-amino-2,1,3-benzothiadiazol (Sigma-Aldrich; 98 wt%) and 6-aminobenzo-thiazole(Sigma-Aldrich; 97 wt%) were used as levelers and their concentrations were varied between 1~ 100 μM. Table 3-1 lists the plating formulation details. The electrolyte (300 ml) was aged at 26 °C for 168 hrs prior to the electroplating.
Electroplating Step
served as the working electrode. Contact to the external potentiostat was made through an alligator clip. In electroplating, we selected a current density of 4 mA/cm2 for 5 min under constant stirring rate at 430 rpm. The electroplating was carried out in a 300 ml vessel made of poly-vinylchloride (PVC). The setup of the Cu electroplating is shown in Fig. 3-5. We recorded the potential values as a function of time during Cu electroplating. After Cu deposition, the sample was cleaved and cleaned with deionized water and ethanol for SEM observation, AFM evaluation, and XRD analysis.
Table 3-1. The chemicals and compositions for the Cu electroplating bath
RDE Analysis
In RDE analysis, a platinum electrode (5 mm in diameter) predeposited by a thin
Components Amount CuSO4․5H2O 150 g/L H2SO4 90 ml/L Cl- . , 50 ppm PEG (MW = 3350) 300 ppm Levelers 1~100 μM
rpm. For both Cu electroplating and RDE measurements, we used a Solartron SI 1287 potentiostat. The setup for the RDE analysis is shown in Fig. 3-6.
Analytic Instrument
Morphology for the deposited Cu film in cross-sectional view was observed by a Filed Emission Scanning Microscope (JEOL 6700 FE-SEM). Crystallographic orientation for the deposited Cu was analyzed by small angle (3o) X-ray diffraction (XRD: Siemens Model D5000) with a detection range of 2θ = 10o to 110o. Surface roughness was observed by an Atomic Force Microscope (AFM: Vecco Dimension 5000 Scanning Probe Microscope).
Chapter 4 Results and Discussion
Fig. 4-1 demonstrates representative voltage responses for the Cu plating RDEs with 25μM of 4-amino-2,1,3-benzothiadiazol at rotation speeds of 200 and 430 rpm, respectively. These patterns were consistent with what were observed earlier by Dow and Liu in which the voltage revealed a sudden rise (becoming less negative) and stabilized after 50 sec [6]. Voltages at the initiation of deposition were more polarized, it is because of the rapid adsorption of suppressor and leveler. Similar phenomenon was also observed by Reid et al. in their galvanostatic measurements [51]. The applied voltage then became less negative, it is ascribed to the adsorption of accelerating component, in our cases, Cl-. In “Literature Review” section, the convection-dependent adsorption mechanism was reviewed. A smaller rotating speed, in our studies, 200 rpm, could be used to simulate smoother flow at the trench bottom. A higher rotating rate could be used to simulate the stronger flow at the trench top. Thus, the different adsorption abilities of additives versus different convection rate would make considerable leveling effects. Apparently, the voltage curve from 200 rpm was less negative than that of 430 rpm. Since the RDE underwent a galvanostatic Cu deposition, the voltage with less negative reading indicated a lower plating resistance which was attributed to a reduced amount of leveler absorption. From these profiles, we surmised that in plating trenches at identical leveler concentration, there would be stronger absorption of levelers at trench top as opposed to the bottom. As a result, Cu deposition at trench top was retarded relatively to that of trench bottom.
For fair comparison, we took the potential difference at 300 sec and defined Δŋ
where Es and Ef are the voltages at 200 and 430 rpm respectively. In such way, a
positive value of Δŋ inferred there was stronger absorption of additive at trench top relative to that of trench bottom while a negative Δŋ suggested otherwise. Because spatial variation of inhibitor in a patterned substrate is known to determine local current distribution, we could use the Δŋ to estimate current difference between trench top and bottom. In this way, a positive Δŋ indicated a larger current at the trench bottom while a negative Δŋ suggested a larger current at the trench top.
Figure 4-1. Representative voltage responses for galvanostatic RDE measurements at
The evolutions for Δŋ on base electrolyte, PEG containing solution for RDE measurements at 200 and 430 rpm are provided in Fig. 4-2. Furthermore, the evolutions for Δŋ on various leveler concentrations for RDE measurements at 200 and 430 rpm are provided in Fig. 4-3. For convenience, the results of Fig. 4-2 and 4-3 are summarized and demonstrated in Fig. 4-4.
For the base electrolyte and PEG contained solution, the Δŋ values are positive for the base electrolyte but negative for the PEG contained solution, respectively. Based on previous theories, superfilling would take place at the base electrolyte while voids would form at the PEG containing solution.
Interestingly, both levelers revealed a similar “volcano” pattern with the highest point occurring at medium concentration. The appearance of volcano pattern was predicted by Cao et al. in their theoretic studies of Cu filling in high-aspect ratio trenches [50]. For the 4-amino-2,1,3-benzothiadiazol, the Δŋ value were positive for concentrations between 10 and 50 μM. For concentration outside this range, the Δŋ value became negative. On the other hand, for 6-aminobenzo-thiazole, the Δŋ value were negative for the entire concentration range. According to Cao et al., deposition behaviors of Cu in trenches can be predicted by the numerical value of p in following relation [50], ⎟ ⎟ ⎠ ⎞ ⎜ ⎜ ⎝ ⎛ − = top top bottom i i i p 100
where ibottom and itop are local current density at the trench bottom and top, respectively.
It was theorized and confirmed experimentally that superfilling was taking place only when p became positive [50]. On the other hand, conformal deposition was likely at p ≈ 0 and unfilled trenches were occurring for p < 0. Therefore, we expected superfilling performance to appear for 4-amino-2,1,3-benzothiadiazol with
concentration of (a) 1, (b) 10, (c) 25, (d) 50, and (e) 100 μM; as well as 6-aminobenzo-thiazole in (f) 1, (g) 10, (h) 25, (i) 50, and (j) 100 μM.
Figure 4-4. Profiles for potential difference (Δŋ) from galvanostatic RDE
measurements at 200 and 430 rpm using a Cu plating bath with; base electrolyte (▲) , PEG contained solution (◇), 4-amino-2,1,3-benzothiadiazol (▓), and 6-aminobenzo -thiazole (○) at various concentrations.
Fig. 4-5 demonstrates the cross-sectional SEM images for the plating results from base electrolyte and PEG containing solution. As expected from the RDE analysis, considerable filling performance difference revealed between base
clear that the result of PEG containing solution consistent with its RDE analysis since Δŋ values is negative for PEG containing solution. However, for the plating result from base electrolyte, the defects appeared at the sidewall of the trenches. This undesirable result is oppositive to the expecting superfilling performance from RDE experiments.
In the study by Dow et al. [6], the addition of PEG did not show discernible difference from voltages between fast rotating speed and low rotating speed of galvanostatic RDE measurements. Dow et al. also performed CLSV measurements in their study of convection-dependent adsorption mechanism [38]. In their study, no obvious change was detected from CLSV curves between fast rotating speed and low rotating speed for their base electrolyte and PEG containing solution.
Figure 4-5. Cross-sectional SEM images for the Cu plating bath; (a) no additives, (b)
Fig. 4-6 demonstrates the cross-sectional SEM images for the plating results from Cu electrolytes with the leveler of 4-amino-2,1,3-benzothiadiazol. As shown, when the leveler concentration was 1 μM, seam appeared in every trench, which was attributed to the conformal deposition of Cu. Once the leveler concentration was increased to 10 and 25 μM, desirable superfilling behaviors were occurring. However, at concentrations of 50 μM and above, we observed formation of voids in trenches, which were often resulted from subconformal deposition. Overall, we witnessed filled and unfilled trenches contingent on the concentration of levelers. The trend agreed well with what was predicted in Fig. 4-4.
Cross-sectional SEM images for the plating results from Cu electrolyte with the leveler of 6-aminobenzo-thiazole at identical concentration range are shown in Fig. 4-7. As expected, suitable concentration for desirable superfilling was not identified. For the leveler concentration at 1, 10, and 25 μM, we observed obvious voids in each trenches. At a concentration of 50 μM, the number of defects was the smallest. However, the filling turned worse again once the leveler concentration was increased to 100 μM. Microstructural evolution seems to agree with what was predicted in Fig. 4-4.
Figure 4-6. Cross-sectional SEM images for the Cu plating bath with 4-amino-2,1,3
-benzothiadiazol at concentrations of (a) 1, (b) 10, (c) 25, (d) 50, and (e) 100 μM, respectively.
A schematic diagram illustrating the operation mechanism for these two levelers is presented in Fig. 4-8. In general, adsorption capability of levelers on a plating surface was determined by their amine groups. Furthermore, the lone pair of N and S atoms of the levelers promoted complexation with Cu+ that affects leveling power [41]. Therefore, we expected the 4-amino-2,1,3-benzothiadiazol to exhibit a higher absorption ability as opposed to that of 6-aminobenzo-thiazole because the latter would allowed an up or down absorption only while the former permitted additional
lateral position. According to the diffusion-adsorption mechanism, the concentration of leveler was predominant on the trench mouth [48]. Because the 4-amino-2,1,3-benzothiadiazol has a higher absorption ability, we expected a normal spatial distribution with significant difference between trench mouth and bottom. On the other hand, the 6-aminobenzo-thiazole exhibited an intrinsically reduced absorption ability so its spatial distribution between trench mouth and bottom was relatively moderate. Similar behaviors were established by Chiu et al., where the concentration gradient of 2-mercaptopyridine between trench top and bottom was more than that of 4-mercaptopyridine because the adsorption ability of former was higher than that of latter [41].
Leung et al. also studied influence of different substitution to the smoothening effects [3]. In their study, the morphology of Cu deposits changes dramatically when the molecular structure of the additive varies slightly. The deposits are smoother when the positions at the triazole nitrogen are not blocked. Their finding suggest that the smoothening effect is strongly related to the ability of additive to form a polymetric complex through the triazole righ and/or the substitutent groups. By detecting our two leveler, it seems that 4-amino-2,1,3-benzothiadiazol would be more effective to form a polymeric complex than 6-aminobenzo-thiazole because of the more closed amino
However, the trend of filling performance with respect to the concentrations of leveler is still not explained. Fig. 4-9 shows the galvanostatic current measurements of 4-amino-2, 1,3-benzothiadiazol and 6-aminobenzo-thiazole. The initial increase in the polarization may be due to the rapid adsorption of suppressor and leveler [51]. As plating continued, the cathodic potential decreased, which was likely due to either morphology changes or increasing adsorption of the accelerator (Cl-). After initial periods of fluctuation, the cathodic polarization stabilized and remained unchanged.
For all these curves, the voltage reading becomes constant after electroplating for about 75 seconds. It is interesting to find that the filling performances prediction and filling performance shown in Fig. 4-4 and 4-6 conformed well to the trend of polarization in Fig. 4-9 (a). Since both suppressor and leveler formed inhibiting complex with the adsorbed Cu+ and Cl- on the substrate, they are likely to have a synergistic inhibiting effect with each other. A schematic illustration is shown in Fig. 4-10. Therefore, there must be uniform surface coverage for both suppressor and leveler. If the concentration ratio of leveler became undesirable larger or smaller, the synergistic inhibiting effect was expected to decrease. According to literature of Dow et al. [24], the binding strength of PEG was proportional to the number of ether groups on the PEG. It is because the ether groups functioned as ligands to coordinate the Cu+ ions, and which are linked with the Cl- ions. Thus, the adsorption ability of PEG is likely to be greater than the levelers because of more ligands on PEG. As the concentration of leveler was in excess, relatively smaller leveler was able to diffuse much quickly than PEG, so the resulting surface coverage for the leveler became larger. The greater surface coverage of leveler has a lower inhibiting ability because the amine groups on the leveler are less than the ether groups on PEG. In addition, it was expected that the leveler had a lower binding strength. On the other hand, if the
smaller. Hence, the superfilling could only be achieved in optimum concentration range.
However, for 6-aminobenzo-thiazole, the polarization was not consistent with the filling performances prediction and filling performance. It is because that the polarization curve was acquired from the wafer fragment, the representing resistance was the combining results of trench mouth and trench bottom. The filling performance was mainly regard to the different resistance between the trench mouth and trench bottom rather than the overall resistance. More studies are still necessary to clarify the meaning of these galvanostatic measurements.
Figure 4-9. Galvanostatic current measurements of (a) 4-amino-2,1,3-benzothiadiazol
and (b) 6-aminobenzo-thiazole: 0 (◇), 1 (●), 10 (○), 25 (▽), 50 (★), and 100 μM (▲), respectively.
Figure 4-10. A schematic illustration of the synergistic inhibiting effect between PEG
and leveler.
XRD analysis of the deposited Cu films is presented in Fig. 4-11. The Cu film exhibited an obvious (220) peak and much weaker (111) and (200) peaks. PEG addition suppressed the (220) peak and increased the (111) and (200) peaks. However, both the 4-amino-2,1,3-benzothiadiazol and 6-aminobenzo-thiazole did not apparently alter the peak of diffraction peak. In the study of Chang et al. [13], they indicated that (111) plane was the lowest surface energy plane for Cu, and increased plating current density would improve the (111) peak. In our case, altering concentration of our
Figure 4-11. X-Ray diffraction patterns of the electroplating Cu films on the patterned
Surface roughness for the deposited Cu film was also studied. They are demonstrated in Fig. 4-12 and 4-13. The mean roughness of Cu film deposited by base electrolyte was 38.344 nm. In contrast, for PEG-containing electrolyte, the mean roughness was only 9.656 nm. The addition of PEG in the electrolyte not only changed the XRD pattern but also suppressed the deposition rate. However, it revealed an interesting result of reduced surface roughness. As shown in Fig. 4-12 (c) and (d), the surface roughness for the deposited Cu film from 25 and 100 μM 4-amino-2,1,3-benzothiadiazol addition electrolyte were 11.457 and 12.164 nm, respectively. Comparing to the surface roughness on these two concentrations (one revealed superfilling and the other one delivered poor filling performance), there was negligible difference between their surface roughness. It is likely that the concentration of leveler did not exert any influence on the Cu. Similar behavior was also observed from electroplating by 6-aminobenzo-thiazole. Although different concentrations of the leveler greatly affected the filling performance, no apparent variation on the surface roughness for the deposited films was observed.
From the studies of Leung and Kim et al. [3,5], the different concentration would greatly affect the roughness. However, the same behavior was not observed in our experiments. It was possible because a lower concentration or different substrate we chosen in our case.
Figure 4-12. AFM analysis on 2D surface roughness in (a) base electrolyte without
additives, (b) PEG, (c) 4-amino-2,1,3-benzothiadiazol at 25 μM, and (d) 4-amino-2,1, 3-benzothiadiazol at 100 μM.
Figure 4-13. AFM analysis on 2D surface roughness of 6-aminobenzo-thiazole in (a)
Chapter 5 Conclusions
In this study, we employed a simple galvanostatic method to evaluate the Cu filling performance in sub-micron trenches using a convection-dependent adsorption characteristic of levelers. Our technique simulates selective adsorption at the trench by different rotation speeds of RDE, and used their potential difference to predict the filling performance. SEM observation was used to conform what was predicted by RDE experiments. This method might be useful to evaluate other plating additives to detect the electroplating bath.
Two new levelers were studied and they exhibited considerable difference in filling performance. It is because their different amino groups were locating at different positions. Diffusion-adsorption mechanism and convection-dependent adsorption were used to explain their plating behaviors. Results from galvanostatic measurements on wafer fragments demonstrated that a synergistic inhibiting behavior between the PEG and leveler was operational in certain concentration ranges. Beyond this range, defects were formed. XRD and surface roughness analysis by AFM indicated a negligible variation with respect to leveler concentration.
References
[1]. R.H. Havemann and J. A. Hutchby, “High-performance interconnects: An .Integration Overview”, Proc. IEEE 2001, 89: 586-601.
[2]. D. Edelstein, J. Heidenreich, R. Goldblatt, W. Cote, C. Uzoh, N. Lustig, P. Roper,
.. T. McDevitt, W. Motsiff, A. Simon, J. Dukovic, R. Wachnik, H. Rathore,
..R. Schultz, L. Su, S. Luce, and J. Slattery, “Full Copper Wiring in a Sub-0.25 μm CMOS ULSI Technology”, Technical Digest, IEEE International Electron
. .Devices .Meeting 1997, 773-76.
[3]..T.Y.B. Leung, M. Kang, B.F. Corry, and A.A. Gewirth, “Benzotriazole as an .Additive for Copper Electrodeposition: Influence of Triazole Ring
.Substitution”, .J..Electrochem. Soc. 2000, 147: 3326-37.
[4]. T.P. Moffat, J.E. Bonevich, W.H. Huber, A. Stanishevsky, D.R. Kelly, G.R. .Stafford, and D. Josell, “ Superconformal Electrodeposition of Copper in 500-90 .nm Features”, J..Electrochem. Soc. 2000, 147: 4524-35.
[5]. J.J. Kim, S.K. Kim, and J.U. Bae, “Investigation of Copper Deposition in the .Prensence of Benzotriazole”, Thin Solid Films 2002, 415: 101-07.
[6]. W.P. Dow, and C.W. Liu, “Evaluating the Filling Performance of a Copper .Plating Formula Using a Simple Galvanostat Method”, J..Electrochem. Soc. . 2006, 153: C190-94.
[7]. P.C. Andricacos, C. Uzoh, J.O. Dukovic, J. Horkans, and H. Deligianni, .“Damascene Copper Electroplating for Chip Interconnections”, IBM J. Res.
.Electrorefining Electrolytes”, Hydrometallurgy 2000; 56: 255-68. [9]. J. Reid, ”Copper Electrodeposition: Principles and Recent Progress”, Jpn.
J. Appl. Phys. 2001; 40: 2650-57.
[10]. M. Georgiadou, D. Veyret, R.L. Sani, and R.C. Alkire, “Simulation of Shape .Evolution during Electrodeposition of Copper in the Presence of Additive”, J. .Electrochem. Soc. 2001, 148: C54-58.
[11]. A.C. West, “Theory of Filling of High-Aspect Ratio Trenches and Vias in Presence of Additives”, J..Electrochem. Soc. 2000, 147: 227-32.
[12]. S.C. Chang, J.M. Shieh, K.C. Lin, B.T. Dai, T.C. Wang, C.F. Chen, M.S. Feng, .Y.H. Li, and C.P. Lu, “Investigation of Effects of Bias Polarization and
.Chemical Parameters on Morphology and Filling Capability of 130 nm
.Damascene Electroplated Copper”, J. Vac. Sci. Technol. B 2001, 19: 767-73. [13]. S.C. Chang, J.M. Shieh, B.T. Dai, M.S. Feng, and Y.H. Li, “The Effects of
.Plating Current Densities on Self-Annealing Behaviors of Electroplated Copper
.Films”, J. .Electrochem. Soc. 2002, 149: G535-38.
[14]. J.J Kelly, C. Tian, and A.C. West, “Leveling and Microstructural Effects of Additives for Copper Electrodeposition”, J..Electrochem. Soc. 1999, 146: 2540-45.
[15]. W.P. Dow, H.S. Huang, and Z. Lin, “Interactions between Brightener and Chloride Ions on Copper Electroplating for Laser-Drilled Via-Hole Filling”, .Solid -State Lett.. 2003, 6: C134-36
[16]. W.P. Dow and H.S. Huang, “Role of Chloride Ion in Microvia Filling by Copper .Electrodeposition: Ⅰ. Studies Using SEM and Optical Microscope”,
.J..Electrochem. Soc. 2005, 152: C67-76.
![Figure 1-1. A comparison of Al subtractive RIE and Cu damascene process [1].](https://thumb-ap.123doks.com/thumbv2/9libinfo/8264508.172351/17.892.158.787.114.782/figure-comparison-subtractive-rie-and-cu-damascene-process.webp)
![Figure 1-2. A comparison between Cu single- and dual-damascene processes [1].](https://thumb-ap.123doks.com/thumbv2/9libinfo/8264508.172351/18.892.149.735.124.736/figure-comparison-cu-single-dual-damascene-processes.webp)
![Figure 2-1. Three possible ways of profile evolution in plated copper; subconformal, conformal, and superconformal deposition [7]](https://thumb-ap.123doks.com/thumbv2/9libinfo/8264508.172351/23.892.172.685.129.790/figure-possible-profile-evolution-subconformal-conformal-superconformal-deposition.webp)
![Table 2-1. Effect of CuSO 4 and H 2 SO 4 concentrations on the diffusion coefficient of Cu 2+ in electrolyte at 65 o C [8]](https://thumb-ap.123doks.com/thumbv2/9libinfo/8264508.172351/24.892.134.872.220.1079/table-effect-cuso-concentrations-diffusion-coefficient-cu-electrolyte.webp)
![Figure 2-2. Effect of the cylinder electrode rotation speed and current density on the leveling power [14]](https://thumb-ap.123doks.com/thumbv2/9libinfo/8264508.172351/27.892.136.741.107.772/figure-effect-cylinder-electrode-rotation-current-density-leveling.webp)
![Figure 2-3. Illustration of various outer and inner sphere electron transfer models of Cu 2+ complexes [17]](https://thumb-ap.123doks.com/thumbv2/9libinfo/8264508.172351/29.892.144.760.110.756/figure-illustration-various-sphere-electron-transfer-models-complexes.webp)
![Figure 2-5. A schematic diagram of PEG behavior model [19].](https://thumb-ap.123doks.com/thumbv2/9libinfo/8264508.172351/32.892.136.666.272.911/figure-a-schematic-diagram-peg-behavior-model.webp)
![Figure 2-6. A schematic illustration of the proposed mechanism for different filling aspects between MPSA and SPS/aged MPSA [27]](https://thumb-ap.123doks.com/thumbv2/9libinfo/8264508.172351/34.892.137.759.104.818/figure-schematic-illustration-proposed-mechanism-different-filling-aspects.webp)
![Figure 2-7. A schematic illustration of the suggested polymeric Cu(I)BTA complex [3]](https://thumb-ap.123doks.com/thumbv2/9libinfo/8264508.172351/37.892.130.758.461.814/figure-schematic-illustration-suggested-polymeric-cu-bta-complex.webp)
