國
立
交
通
大
學
材料科學與工程學系
碩
士
論
文
利用有機金屬化學氣相沉積法
研究砷化鎵於矽基板上成核成長之技術
Study of GaAs nucleation on Si substrate
by Metal-organic Chemical Vapor Deposition
研 究 生:PHAN VAN THANH HOA
指導教授:張翼 教授
利用有機金屬化學氣相沉積法
研究砷化鎵於矽基板上成核成長之技術
Study of GaAs nucleation on Si substrate
by Metal-organic Chemical Vapor Deposition
研 究 生: 潘文清和
Student: Phan Van Thanh Hoa
指導教授:張 翼 博士
Advisor: Prof. Edward Yi Chang
國立交通大學
材料科學與工程研究所
碩士論文
A Dissertation Submitted to Department of Materials Science and Engineering
College of Engineering
National Chiao Tung University
In Partial Fulfill of the Requirements
For the Degree of
Master of Science
November 2013
Hsinchu, Taiwan, Republic of China
利用有機金屬化學氣相沉積法
研究砷化鎵於矽基板上成核成長之技術
研 究 生: 潘文清和
指導教授:張 翼 博士
國立交通大學
材料科學與工程研究所
摘要
由於鎵原子與砷原子的高度表面擴散性,我們了解若於高溫下直接成長砷化鎵於矽 基板上,其表面型態易於趨向三維成長。當島狀結構開始結合時,高密度之低移動性與 固定的差排將被產生,最終形成高密度穿透差排的砷化鎵磊晶層。藉由精準控制有機金 屬化學氣相沉積法之初始成長階段,將可以達到平坦表面之砷化鎵成核層於矽基板上。 本研究論文主要探討,以適當的成長條件,利用有機金屬化學氣相沉積法,直接成長砷 化鎵於矽基板上。於實驗起初,我們將對矽基板進行仔細的化學與熱處理,並適度調控 其中的成核成長速率與五三比,以求得到較為平坦的砷化鎵成核層。如此,開發平坦砷 化鎵/矽的結構,將被視為極有潛力發展作為如砷化銦、砷化銦鎵、砷化銻與鍺等,高 遷移率通道材料之人造基板。 本研究已成功發展出直接成長砷化鎵/矽結構之技術。我們使用(001)面偏 60 切面朝 [110]方向之矽基板,並且於實驗起初使用氟化氫溶液清除基板上之氧化層,然後再以 40 sccm 之砷化氫氣體於高溫 6500 C 進行退火反應。這樣的退火技術,有助於形成完全 砷原子終止的覆蓋層之矽基板表面;此為形成砷化鎵磊晶層之重要關鍵。藉由控制成長溫度在 4000 C 與五三比為 18.4 之情況,砷化鎵成核層可控制在約 10 nm 的厚度。在此成 長條件,我們可以得到 RMS 值約 0.66nm,於矽基板上的平坦砷化鎵成核層。並且透過 TEM 影像,顯示在砷化鎵/矽結構的界面處,存在許多 900 錯位差排及少量的 600 錯位差 排;此為形成平坦表面的成核磊晶層之所需要件。
iii
Study of GaAs nucleation on Si substrate
by Metalorganic-Chemical Vapor Deposition
Student: Phan Van Thanh Hoa
Advisor: Prof. Edward Yi Chang
Deapartment of Materials Science and Engineering
National Chiao Tung University
Abstract
It was realized that a direct, high-temperature growth of GaAs on Si substrates led to a 3D initial growth morphology aided by the high rate of surface diffusion of the Ga and As adatoms. When those islands later coalesce, a high density of immobile and pinned dislocations are produced, resulting in a final GaAs film with high threading dislocation density. A careful control at initial stage of epitaxy growth is desirable to obtain a smooth surface morphology of GaAs nucleation layer on Si substrate. The scope of this thesis includes the investigation of optimum growth conditions for direct integration of GaAs on Si using Metal-Organic Chemical Vapor Deposition method. By careful Si surface chemical and thermal treatment, combining with tuning the nucleation growth temperature and V/III ratios, a very smooth surface of GaAs nucleation layer can be obtained. This smooth surface GaAs/Si integration is considered as a potential artificial substrate for further high mobility channel materials like InAs, InGaAs, InSb, Ge to be continuously grown.
In this thesis, we successfully investigated the conditions for GaAs/Si direct integration. The Si (001) with 60 off-cut angle toward [110] direction was used. The substrate was first cleaned in HF solution to strip out the thin oxide and subsequently exposed to AsH3 flux of 40
sccm during the high temperature 6500C annealing process. This annealing technique can help to form a fully-As-terminated Si surface which is very important for GaAs continuous film formation. The GaAs nucleation layer with thickness of ~10 nm was then grown with temperature of 4000C and V/III ratio of 18.4. This growth condition gave us very low roughness surface of GaAs nucleation layer on Si with the RMS value about 0.66 nm. The TEM images of GaAs/Si interface show mostly desirable 900 misfit dislocation and fewer 600 misfit that contribute to smooth surface morphology, a very desirable requirement for a nucleation layer.
v
Acknowledgements
I would like to thank my supervisor, Prof. Edward Yi Chang for his support and guidance through this work and all the members of Solar cell and III-V epitaxy group especially my mentor PhD Nguyen Hong Quan for their wisdom and encouragement. A big thank goes to my friends in NCTU and in Vietnam, for helping me to achieve a balance between school and life. I am very grateful for the endless love, support, and encouragement from my family. And finally, thank you for everything.
Hsinchu, Taiwan November 2013
List of tables
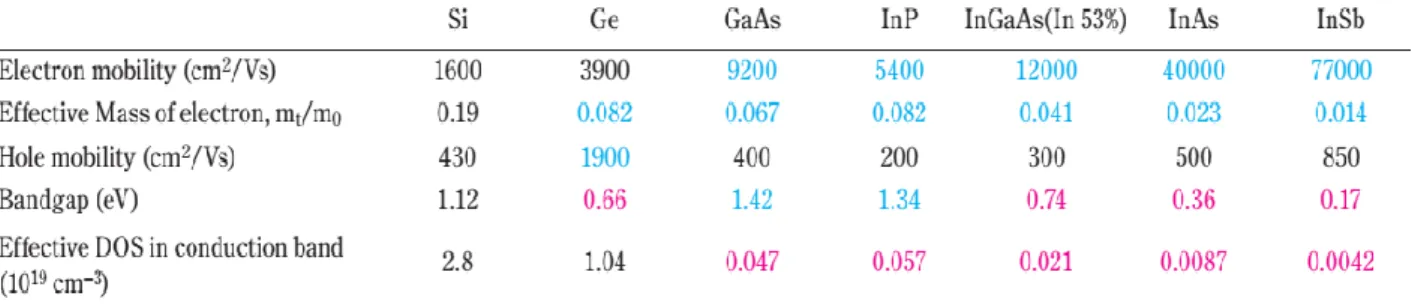
Table 1.1 Bulk carriers mobility, effective mass, bandgap of Si, Ge and main III-V
semiconductors. ... 2
Table 2.1 Fundamental properties GaAs, Ge and Si substrates. ... 5
vii
List of figures
Fig. 2-1 Matthews-Blakeslee criteria for critical thickness, hc, versus misfit . ... 7
Fig. 2-2 Schematic representation of misfit and threading dislocation segments typical for
growth of lattice mismatched systems. ... 8
Fig. 2-3 The two types of dislocations in zincblende and diamond crystalline semiconductors.
... 9
Fig. 2-4 Lattice constants and thermal expansion constants of III-V and Si materials. ... 11
Fig. 2-5 APD formation during growth of polar on nonpolar materials. . ... 12
Fig. 2-6 STM images of the morphology of Si(100) surfaces etched in pH-modified NH4F. . 15
Fig. 2-7 The four different step configurations on Si surface. ... 17
Fig. 2-8 Single domain a) and double domain b) reconstructed surfaces of Si (100). ... 18
Fig. 2-9 The presence of monolayer high steps can lead to the formation of APBs. ... 18
Fig. 3-1 The MOCVD EMCORE D180 system in Compound Semiconductor Devices
laboratory. ... 23
Fig. 3-2 Schematic of the MOCVD system. ... 25
Fig. 3-3 MO bubbler and its vapor transport process. ... 26
Fig. 3-4 Schematic of MOCVD process from mixing of gas streams to reaction on the
substrate surface. ... 27
Fig. 3-6 Schematic of the three different temperature regimes for growth of a compound
semiconductor by MOCVD. ... 29
Fig. 3-7 The structure of arsine, alternative TBAs and TMGa. ... 32
Fig. 3-8 Schematic diagram of the BEDE D1 HRXRD system. ... 35
Fig. 3-9 A schematic 3D description of an atomic force microscope (AFM). ... 38
Fig. 3-10 Interatomic force vs. tip-to-sample spacing curve in AFM. ... 39
Fig. 3-11 Block diagram of typical TEM with STEM capability. ... 42
Fig. 4-1 The two sequences for investigating the effect of substrate annealing ambient. ... 45
Fig. 4-2 SEM image on GaAs/Si top-view surface annealing in H2 ambient only. ... 46
Fig. 4-3 AFM results of three GaAs/Si samples: a) annealed in H2, b) in H2/10 sccm AsH3 and c) in H2/40sccm AsH3. ... 46
Fig. 4-4 Angle-integrated photoemission spectra taken for a) a clean Si surface and for the same surface b) after hydrogen exposure plus 3000C annealing.. ... 47
Fig. 4-5 TEM image of GaAs/Si interface with thermal treatment in a) 10 sccm AsH3 and b) 40 sccm AsH3 respectively. ... 48
Fig. 4-6 AFM images of GaAs/Si with different growth temperature a) 380, b) 400, c) 420 and d) 4600C. ... 49
Fig. 4-7 Hole concentration changes with temperature in GaAs growth. ... 50
ix
Fig. 4-9 Coalescence of large islands formed in the initial growth at high temperature. ... 51
Fig. 4-10 TEM images of GaAs/Si (001) interface grown at 3800C. ... 52
Fig. 4-11 TEM images of GaAs/Si (001) interface grown at 4000C. ... 53
Fig. 4-12 Surface morphology of GaAs/Si sample grown at 4000C with low V/III ratio a)11.5, b) 16 and c) 18.4. ... 53
Fig. 4-13 Hole concentration at 300K as a function of [AsH3] with [TMGa] as parameter. ... 54
Fig. 4-14 Surface morphology of GaAs/Si sample grown at 4000C with high V/III ratio c)18.4, b) 23 and c) 34. ... 55
Fig. 4-15 Surface morphology of GaAs/Si grown at 4000C with V/III 23... 56
Fig. 4-16 Schematic cross-sections of (a) [1-10] and (b) [110] steps ... 56
Fig. 4-17 Lateral growth rate of GaAs as a function of AsH3 pressure during growth . ... 57
Fig. 4-18 TEM image of GaAs/Si interface grown at V/III=11.5. ... 58
Fig. 4-19 TEM image of GaAs/Si interface grown at V/III=18.4. ... 58
Fig. 4-20 TEM image of GaAs/Si interface grown at V/III=23. ... 59
Fig. 4-21 900 misfit dislocation at the GaAs/Si interface for optimum growth condition. ... 59
Table of content
Abstract in Chinese ... i
Abstract in English ...iii
Acknowledgements ... v
List of tables ... vi
List of figures... vii
Chapter 1 Introduction and motivation ... 1
Chapter 2 Literature Review... 4
2.1 Epitaxial growth challenges for III-V/Si integration ... 4
2.1.1 Lattice constant mismatch ... 6
2.1.2. Thermal mismatch ... 10
2.1.3. Chemical mismatch ... 11
2.2 Direct GaAs-on-Si epitaxy technique ... 13
2.2.1 Si substrate cleaning ... 13
2.2.2 Si surface step preparation ... 15
2.2.3 Effect of As-terminated surface ... 18
2.2.4 GaAs film growth strategies ... 20
Chapter 3 Experimental Process ... 22
3.1 Epitaxial growth technique ... 22
3.1.1 Principle of Operation ... 23
3.1.2 Basic reaction kinetics ... 26
3.1.3 Precursors ... 30
3.1.4 MOCVD hazards ... 32
3.2 Epitaxial film characterization tools ... 33
3.2.1 HRXRD for thin film ... 34
3.2.2 Atomic Force Microscopy ... 38
xi
3.2.4 Scanning Electron Microscopy ... 42
Chapter 4 Results and Discussion ... 43
4.1 GaAs/Si thin film characterization... 43
4.1.1 Effect of annealing ambient on GaAs film formation ... 44
4.1.2 Effect of growth temperature ... 49
4.1.3 Effect of V/III ratio ... 53
4.2 Integration of Ge on GaAs/Si artificial substrate by UHVCVD... 60
Chapter 5 Conclusion and Future Work ... 62
5.1 Conclusion ... 62
5.2 Future work ... 63
Chapter 1
Introduction and motivation
Si has become a dominant semiconductor material used in electronic application due to its highly developed integration technology. Nowadays about 95% of electronic devices are fabricated by silicon. Silicon is the second most abundant element on Earth, is robust, allows the fabrication of large diameter wafer, has a good thermal conductivity, gives the possibility to integrate silicon dioxide as insulator and has a high mobility for the holes. These properties made possible the development of the Complementary Metal Oxide Semiconductor (CMOS) technology and allow the integration on a single chip of billion components. This technology is the base for the fabrication of microprocessors, micro-controllers, memories, image sensors and data converters. Considering the intense amount of investment which has gone into Si transistor technology in the last century and the ubiquity of Si transistors in modern electronic equipment, it seems that Si wafers will still dominate the microelectronics industry [1].
2
Table 1.1 Bulk carriers mobility, effective mass, band gap of Si, Ge and main III-V
semiconductors.
Despite of possessing many strength, Si is not a perfect material for large scale transistor integration. Recent advances in ultra high-speed and high-density microelectronic application, with the increasing transistor speed and density on Si wafers have begun to expose some of the inherit limitations of traditional Si devices. In particular, relatively low carrier mobility compared to the other semiconductor materials like Ge and GaAs, InP, InSb and the unsuitable indirect band gap for optoelectronic devices. For this reason III-V compounds like GaAs are widely used in optoelectronics. Also for the fabrication of solar cells and for high mobility devices direct gap materials have better performances than silicon [2] [3]. The possibility to integrate devices for applications in optoelectronics and photonics based on III-V semiconductors, directly on Si substrates would allow the use of the mainstream Si devices platform and avoiding the need for using of large diameter (> 300mm) costly III-V substrate [4].
While III-V materials have shown some very attractive and superior properties, many technical challenges need to be overcome before they will become practical for future high-speed and low power digital applications [5]. The buffer layer between the III-V and Si
material needs to be an effective blocking defects layer and should be sufficiently thin without degrading mobility for cost reduction and easy to integrate with Si substrate by means of epitaxy techniques. A high quality thin GaAs layers on Si substrate served as an alternative substrate will have a high market potential. Using the GaAs-on-Si also enable the development of monolithic integration technology for GaAs-based and other III-V material devices.
In this thesis we will investigate the possibility to integrate a thin layer of GaAs material used as a nucleation layer directly on Si (001) substrate. Based on the requirement for a smooth surface nucleation layer, appropriate epitaxy growth conditions at very early stage are necessary, because the coalescence of GaAs nuclei on Si substrate at the early stage is a source of the threading dislocations. The second chapter is dedicated to introduce the epitaxy of GaAs on Si substrate with the related issues. In the third chapter the experimental setup used in this work of thesis for the sample growth and characterization is described. The fourth chapter describes the experiments performed and the results obtained in the formation of GaAs film growth on Si as an artificial substrate.
4
Chapter 2
Literature Review
2.1 Epitaxial growth challenges for III-V/Si integration
The epitaxial growth of III-V compound semiconductors on Si substrates will provide low-cost, lightweight, and larger area III-V compound substrates with high mechanical strength and excellent thermal conductivity. The significant differences in basic crystal properties existing between the two materials make their integration not a straightforward process. In general, two different approaches need to be distinguished: direct growth on the Si substrate, through various buffer layers and wafer bonding. The first approach requires strategies to ensure sufficient material quality in the III-V layers. As it is very difficult to achieve good material quality for direct GaAs growth on Si, different buffer layers are investigated to increase the lattice constant gradually. Several of the investigated strategies have been implemented through GaAs/GeSi/Si, GaAs/GaAsP/Si, GaAs/InGaP/Si [6], [7], [8], [9], and [10]. The most well-developed buffer is the use of Ge/GeSi/Si heterostructure [6], [7]. Because Ge lattice parameter is similar to the one of GaAs, linearly increasing the content of Ge from 0% up to 100% makes the lattice parameter of the buffer layer suitable for the deposition of a GaAs epilayer. In second approach, the III-V structures are grown
independently and then combined with Si substrate through wafer bonding. After the bonding process, the substrate of the upper layer is removed by using lift-off techniques such as ion implantation, and laser, stress-induced, or wet chemical lift-off. Although the lift-off process and the bonding lead to technological challenges, promising results have already been accomplished [10], [11], [12].
Motivated by the above discussion, there is very strong interest in creating a technology that combines crystalline III-V materials on a more advantageous substrate Si, without significantly reducing the performance of the device. However, there are a number of fundamental differences between the material characteristics of the group III-V and group IV semiconductors. A summary of the differences between Si, Ge, and GaAs is presented in table 2.1[13].
Table 2.1 Fundamental properties GaAs, Ge and Si substrates.
GaAs Ge Si Crystal structure Mass density (g/cm3) Thermal expansion coefficient (@RT, ×10-6 C-1) Lattice constant (Å) Substrate diameter (inch)
Material cost Zincblende 5.318 5.8 5.653 4-6 High Diamond Cubic 5.323 5.9 5.658 3-4 Mid Diamond Cubic 2.329 2.6 5.431 8-12 Low
6
The integration of III-V on Si substrate inhibits fundamental mismatches at a basic material level, in particular thermal, chemical and lattice constant mismatch, introduces specific structural defects. The various differences between the materials will be studied separately for each of the properties discussed above.
2.1.1 Lattice constant mismatch
The lattice constant of bulk Si is 4.1% smaller than GaAs at room temperature. When the III-V material is epitaxially grown on Si the difference in lattice constant between the two materials is accommodated by straining the top epitaxial layer. For the case of GaAs/Si or GaAs/Ge growth, since the lattice constant of the top layer, a, is larger than the one of the substrate, a0, the resulting strain is compressive. Lattice mismatch is quantified by the misfit
f,
𝑓 =𝑎 − 𝑎0 𝑎0
As the top layer is grown, the strain (either compressive or tensile) keeps increasing, distorting the epilayer until it reaches a certain thickness, called the critical thickness, where all the strain is relieved by the formation of dislocations.
1Fig. 2-1 Matthews-Blakeslee criteria for critical thickness, hc, versus misfit, f [14].
The critical thickness is typically described by the Mathews Blakeslee criteria [14], shown in figure 2-1, depends on the amount of mismatch, the lattice constant and decreases as the misfit increases. For large misfit values, the thin of a few monolayers causes an immediate relaxation of the epitaxial layer by the formation of a large number of dislocations. The introduction of dislocations in the active layers degrade device performance since they form shunt paths and may act as recombination centers or traps for carriers. Si can diffuse from the substrate though the dislocations and causes auto doping in the epilayer [15]. In fact, the 4.1% misfit between GaAs and Si allows only a critical thickness of ~1nm when GaAs is directly grown onto Si generating a threading dislocations density of value as high as 109 cm-2.
8
2Fig. 2-2 Schematic representation of misfit and threading dislocation segments typical for
growth of lattice mismatched systems.
Direct epitaxy of large mismatched systems, such as GaAs/Si in which the critical thickness is less than 4 mono-layers of GaAs, results in uncontrolled lattice relaxation, such as three-dimensional growth and the introduction of a large number of immobile edge and threading dislocations. Figure 2-2 shows a schematic of the misfit dislocation (MD) segment and the corresponding threading dislocations (TDs) terminating at a free surface. Dislocations are often described in terms of Burgers vectors. In a perfect crystal is always possible to choose a closed path defined by a series of displacements of the Bravais lattice. In a crystal with a defect the same path fails to return to its starting point. The misfit accommodated by a dislocation is the projection of its Burgers vector onto the substrate plane. The commonly occurring dislocations in zincblende and diamond semiconductors can be classified in two different ways [16]: those whose Burgers vector are parallel to the growth plane (type I or 900 misfit dislocations) and others (type II dislocations or 600 misfit
dislocation, see figure 2-3). Type I dislocations are pure edge type, type II dislocations have their Burgers vector at an angle of 450 to the plane of the substrate and 600 to the dislocation line. Type II dislocations can easily move up through the GaAs epilayer and reach the surface. Such a propagation of dislocations from the interface through the epilayer is called threading. Threading dislocations cause impurity diffusion and degradation of optical and electrical properties of epilayers. The orientation of the burgers vector for TDs indicate that while the TD itself does not relieve strain, TD glide and the lengthening of the MD segment at the interface does provide strain relaxation. On the other hand, type I or 900 misfit dislocations do not become threading dislocations, because this type is sessible and has no glide plane. Therefore the formation of 900 dislocation is more favorable to produce high-quality GaAs epilayers.
3Fig. 2-3 The two types of dislocations in zincblende and diamond crystalline
semiconductors: type I with Burgers vector parallel to the interface and Type II with Burgers vector inclined at an angle to the [16].
10
compared with misfit dislocations because of the contribution of the stacking fault energy to the total energy of the system. It has been considered that the dominant formation mechanism of stacking faults and microtwins is atomic deposition mistake during the growth of {111} facetted islands. In addition, atomic steps and the difference between the thermal expansion coefficients of GaAs and Si have also been suggested as the source of stacking faults.
Unfortunately, for the highly mismatched GaAs/Si material system the uncontrolled nucleation of dislocations results in small, sessile misfit segments that require a high density of TDs and MD segments for adequate strain relief.
2.1.2. Thermal mismatch
Thermal mismatch, which arises from the difference in thermal expansion coefficient of the III-V material and Si, leads to the possible formation of micro-cracks that may act as shunt paths in the device. For heteroepitaxy, a thermal expansion coefficient mismatch indicates that the lattice constant of the epilayer (GaAs) changes at a different rate than that of the substrate (Si) as the temperature of the integrated material system is changed. For example, α(Si) = 2.6×10⁻⁶ K-1 and α(GaAs) = 5.8×10⁻⁶ K-1 at 300 K [17], this suggests that the Si lattice will expand less when heated and contract less when cooled when compared to the GaAs lattice. Assuming GaAs grown on Si is fully relaxed at growth temperature, the GaAs film will be in tension as the system is cooled to room temperature, which is opposite
of the compressive strain induced by the lattice mismatch.
4Fig. 2-4 Lattice constants and thermal expansion constants of III-V and Si materials.
While the thermal mismatch strain is significantly smaller than the lattice mismatch strain incorporated for the GaAs/Si material system, the thermal strain can become significant at large epitaxial layer thicknesses.
2.1.3. Chemical mismatch
Chemical mismatch occurs from the different crystalline structures of the group III/V and group IV materials. Group IV materials, such as Si or Ge is nonpolar with cubic diamond structure, whereas most of III-V materials crystallize in the polar cubic zincblende structure. When III-V materials are grown on group IV materials, and due to the lower symmetry of the zincblende lattice when compared to the diamond lattice, the interface between the two materials forms Antiphase Domains (APD), a 2-dimensional, electrically
12
active defect bound by the anti-phase boundaries (APBs) that consist of metallic As-As or Ga-Ga bonds, as shown in figure 1.4. APD’s are expected to form in atomically stepped surfaces where the location of group III and group V may interchange resulting in an alteration in the order of the atoms on the surface. APBs are charged structural defects. Ga-Ga bonds have electron deficiency and acts as acceptors, As-As bonds have excess electrons and so acts as donors. Thus, APBs provide deep levels inside the energy band gap, which act as strong scattering and recombination centers, degrading the GaAs electrical quality and p-n junction performance [18]. Furthermore, the presence of APBs is often accompanied by increased surface roughness, which further complicates device processing [19].Therefore, the elimination of extended APD formation was a critical step in achieving high quality III-V materials on Si, Ge and SiGe substrates.
5Fig. 2-5 APD formation (Ga-Ga, As-As bonds) during growth of polar on nonpolar
materials. The bold dashed line marks the wrong nearest-neighbor bonds lying on the plane of the APB [20].
The adjusted growth conditions can avoid APDs completely from GaAs/Si interfaces, including suitable growth temperature, the use of tilted substrates together with sufficient annealing. In this case, the growth starts with an As or Ga pre-layer. Whereas the As prelayer results in smooth, shiny, and APD-free epilayers with good optical quality, the Ga prelayer results in a rough surface with APDs and higher carbon incorporation [21]. For the role of substrate miscut on the suppression of APBs, several models have been proposed: the step doubling model [22] and the alternating single and triple step model [23]. However, no well-established explanation has been found so far to clarify the surface step arrangement at the Si surface. If APB-free nucleation is not achieved, it is possible that APBs propagating up from the GaAs/Si interfaces, through appropriate annealing process may annihilate at their intersection leaving single domain GaAs at the top surface [24]. The occurrence of self-annihilation processes of APBs is also considered to play an important role in the growth of GaAs/Si based devices.
2.2 Direct GaAs-on-Si epitaxy technique:
2.2.1 Si substrate cleaning:
Surface treatment is a basic procedure in the epitaxial growth of GaAs on Si substrate. There are two important points in this step, first is to remove the native oxide or any contaminations on Si surface, second is to form the desirable surface reconstruction. The
14
surface oxide removal can be done with wet cleaning using HF followed by thermal annealing. For reconstruction of surface, the desirable surface steps could be achieved through choosing a vicinal substrate, annealing in H2/AsH3 ambient and a monolayer of
Arsenic cover.
The silicon oxides formed on the long time air-exposed Si surface are stable and cannot be removed below 7000C [25],[26],[27]. The HF cleaning is a convenient technique to clear out the oxide. Moreover, it also helped to terminate the Si surface with H atoms that can protect the surface from reoxidation and contamination before transferring the substrate into reactors. Some reports said that the H-terminated Si surface is stable for about one hour [28]. This surface is believed stable against oxidants, and the H atoms are easily desorbed from the surface at the epitaxial growth temperature [29]. Bradon S. Aldinger reported that the pH of aqueous fluoride solution can affect the morphology structure of Si (100) surfaces. Low pH solutions (5 ≤ pH ≤ 7), such as the technologically important buffered oxide etchant (buffered HF), produce rough surfaces covered with nanoscale Si{110}-faceted hillocks. In contrast, higher pH solutions (7.8 ≤ pH ≤ 10), including 40% NH4F, produce atomically
6Fig. 2-6 STM images of the steady-state morphology of Si(100) surfaces etched in
pH-modified NH4F show hillock formation at pH ≤ 7 and atomically flat surfaces at pH ≥ 7.8. The pH is indicated in the upper left-hand corner of each image [31].
2.2.2 Si surface step preparation:
Steps are simply atoms missing from their place in the crystal. When just a monolayer of atom is missing, the step is said to be a monolayer high. The edge atoms at the steps are similar to the surface atoms and have dangling bonds and some of these dangling bonds may rebond at the step edge. The rebonding of dangling edge bonds influences the formation energy and stability of steps and can be altered by high temperature or chemical treatment [15]. We can consider the steps that are odd atomic layers high as monolayer high and even ones as double layer high. Thus, there are four different step configurations, mono-step with
16
step edge parallel (SA)/perpendicular (SB) to the dimerization direction and double-step with
step edge parallel (DA)/perpendicular (DB) to the surface dimerization direction. SA is the
simplest step structure on Si (100) surface. On a misoriented substrate, SA and SB alternate
with each other. Figure 1-8 shows the image of steps on a misoriented Si (100) substrate. According to Chadi’s calculation of the step formation energies for the four step configuration, on a misoriented substrate, DB steps are energetically favored [32]. Therefore
on a misoriented substrate the steps are usually double atomic layers high. A Si (100) substrate offcut towards [110] introduces a regular array of surface terraces separated by single-steps running along the [1-10] direction. As the offcut angle is increased, the density of steps and width of surface terraces decreases, a factor that may by itself promote early self-annihilation of APBs. Although there exist discrepancies in the literature regarding the exact mechanism of antiphase disorder suppression, in general, substrate offcut is expected to enhance surface transition kinetics, thereby diminishing the possibility of APB nucleation and propagation [33]. Thermal treatment along with the presence of arsenic is also known to induce the rearrangement of monolayer steps into double layer steps [32],[33]. Under thermal treatment, the energetically less favorable step edge diffuses towards the energetically more favorable step edge.
It has been noticed that the formation of antiphase disorders in the GaAs epilayers is aided by monolayer high steps. Since the GaAs (100) planes alternate between cation and
anion planes, the single step cause a perturbation of the order of the (100) planes, as illustrated in figure 1-9. However, the double-layer steps have the appealing feature that they naturally eliminate the formation of antiphase domains [23].Therefore, a vicinal substrate with double-layer high step configuration is desirable for ADBs-free GaAs epilayer on Si substrate. Another advantage of a misorientation substrate comes from the step flow growth mode. Unidirectional step flow is induced by substrate missorientation (off-cut angle). This trick is often used to avoid island formation, their coalescence and following columnar growth in epitaxy from the vapor phase [34].
18
8Fig. 2-8 Single domain a) and double domain b) reconstructed surfaces of Si (100) [20].
9Fig. 2-9 The presence of monolayer high steps can lead to the formation of APBs even
when the initial monolayer is uniform, and the a double-stepped surface demonstrating growth of a single domain of GaAs [15].
2.2.3 Effect of As-terminated surface:
The annealing ambient of Si (100) surfaces following chemical treatments also needs to be investigated. It can be seen that Si (100) surfaces annealed in H2 gas ambient were
hydrogen terminated [35] and well-defined Si (100) structure with alternating SA and SB
to the reduced diffusion length for adatoms moving along the surface [36], [37], [38], [39]. Atomic H may limit the surface diffusion length of adatoms by essentially increasing their incorporation rate into the growing layer [40]. This phenomenon may limit the migration of Ga and As adatoms on H-terminated Si surface, will contribute to the growth of GaAs islands at initial stage of epitaxy process. An As-terminated may not help to create a wetting layer for layer-by-layer growth but at least to prevent the effect of atomic H.
Depending on the substrate temperature and As flux irradiated, it is possible to obtain a surface coverage mainly composed by As dimers parallel or perpendicular to the steps, but in both cases the GaAs grown will have the same orientation and will not give raise to anti-phase boundaries. Each atom of an arsenic dimer features a lone pair of electrons rather than a dangling bond, resulting in a net surface energy decrease. The resulting arsenic passivated surface is highly inert and self-limited to a single monolayer of coverage. However, it has been noted in numerous studies that arsenic coverage modifies of the preexisting substrate step structure for single-domain GaAs growth. Passivating the Si surface with a uniform monolayer of arsenic is obviously a crucial step in the epitaxial growth of GaAs on Si substrate.
20
2.2.4 GaAs film growth strategies:
In the case of GaAs epitaxial layer on Si, the 4% lattice mismatch should lead to islanding (Volmer-Weber) or a layer-by-layer growth followed by islanding (Stranski-Krastanov SK). The growth mode of GaAs on Si depends on the energy criterion 𝛾𝑆 ≥ 𝛾𝑖+ 𝛾𝑙 , where 𝛾𝑆 and 𝛾𝑙 are the respective surface energies for the substrate and the
thin film and 𝛾𝑖 is the interfacial energy between the thin film and the substrate. When the
energy criterion is satisfied, the growth mode should be layer-by-layer [41]. However, the SK growth mode requires initial layer-by-layer growth, after which the island growth takes over to release stress when a critical thickness is reached [42]. Ideal layer-by-layer growth mode could be achieved when the surface energy of the substrate increase or surface energy of the growing layer decrease to satisfy the energy criterion. It has been reported that GaAs epilayer prefers to grow on substrates with high surface energy [43]. Substrates with lower surface energy are more stable due to the lower number of dangling bonds, which makes it more difficult for adatoms to be attached to. In the view of nature three-dimensional nucleation of GaAs on Si, it would be expected that low temperature growth should produce better surface morphologies by encouraging the initial formation of smaller, more numerous GaAs islands rather than fewer but larger islands resulting from the faster surface transportation velocities of Ga and As at high temperature. The As prelayer affects the surface mobility of Ga and initial island formation [44],[45]. After forming the initial As
monolayer on Si, the additional As stick exclusively to Ga on the surface. Ga will therefore favor larger clusters for high substrate temperatures (i.e., high Ga diffusion coefficient) and low As flux during growth (i.e., longer times for Ga to migrate freely). The Ga mobility is proportional to the surface temperature and inversely proportional to excess As present. A relatively high surface temperature and less As flux leads to higher mobility of Ga on the surface. However, the high mobility of Ga atoms due to low arsenic pressure (less As flux) at a low surface temperature has been successfully exploited to grow good quality epilayers of GaAs on Si [46]. In actual growth, a number of factors such as strain in the epilayer, growth temperature, and growth rate also play an important role in determining the morphology of epitaxial layers grown on a lattice mismatched substrate.
22
Chapter 3
Experimental Process
3.1 Epitaxial growth technique
Metalorganic chemical vapor deposition (MOCVD), also known as organometallic vapor phase epitaxy (OMVPE) or metalorganic vapor phase epitaxy (MOVPE), is a preferred epitaxial growth technique in industry and research facilities for fabrication of III-V semiconductor materials. It has all the necessary qualities for uniformed device growth, including the growth of a very high quality bulk material, abrupt materials interfaces, control the doping profile, control the thickness of epilayer, have a reasonable growth rate, be cost effective and being a very flexible technology with a relatively simple reactor design. Drawbacks include choice of only few in-situ characterization techniques and using expensive and extremely hazardous chemicals that require strict monitoring and handling procedures.
The LP-MOCVD system is designed to grow epilayers at low pressure instead of atmosphere pressure system. At the low pressure operation, there are less undesired reactions because it can effectively reduce the contact time and minimize the extent of the reactions due to the high gas flow velocity. Low pressure deposition is especially suitable for
large-area scale-up to volume production equipment.
This part of the dissertation will give a brief overview of the operating principle of MOCVD system.
10Fig. 3-1 The MOCVD EMCORE D180 system in Compound Semiconductor Devices
laboratory.
3.1.1 Principle of Operation:
A brief and simple growth sequence of MOCVD is as follows. A substrate is loaded into a reactor and is heated up. The source materials are transported to the substrate where they are thermally decomposed, partly in gas phase and partly on the surface. The introduced atoms are then incorporated into a crystal lattice growing on the substrate surface forming the thin film.
24
the gas cabinet and the scrubber. The interface module is the central nerve system. This is where the communication between the computer and machine takes place. The reactor is situated inside a glove box in the reactor cabinet and is of the vertical type with a close coupled showerhead above a rotating graphite susceptor. The glove box is kept under nitrogen to prevent oxygen and water vapor from contaminating the reactor when it is opened to be loaded. A substrate is loaded into the reactor via a load lock. On a panel of the reactor cabinet one finds the heater and the pressure control unit. All MO sources are stored in the gas cabinet. Also the gaseous sources (stored in bunkers) enter the system here.
All flows are set in this part of the system by means of (input, dilution and output) mass flow controllers, as are the bubbler pressures (by pressure controllers). Chemicals are sent to the reactor is regulated by the switching manifold. If a source line is not used, it is switched to the vent and sent directly to the waste gas treatment. Waste gasses coming from the reactor are sent through a scrubber. There are two big scrubber columns (to ensure continuous operation) filled with resin, a metal oxide that adsorbs the remaining toxics in the waste gasses.
11Fig. 3-2 Schematic of the MOCVD system.
Before every run, baking procedure is carried out using H2 flow at 700-8000C to clean
the reactor. After that a substrate is loaded into the reactor chamber, which is temperature- and pressure-controlled, the run can be started. First, the pressure is reduced to 40-70 torr and a low temperature bake-out (3000C) of the substrate is performed. Then the reactor temperature is increased to a higher value 420-7000C. Growth is then processed at low pressure, after which the reactor is cooled down again. Finally, the substrate, with the deposited layers on it, can be unloaded.
The group-III sources we use are trimethylgallium (TMGa), trimethylalluminum (TMAl) and trimethylindium (TMIn). For group-V sources we use arsine AsH3 and phosphine PH3.
26
n-type material. The metal-organic materials (MOs) are either liquid or solid and are kept in stainless steel bubblers (figure 3-3), at a certain temperature and pressure to obtain the desired equilibrium vapor pressure of the metalorganic material. To transfer the molecules to the reactor, a carrier gas H2 passes through the MO sources and become saturated with the
MO materials. The saturated hydrogen flow is then injected into the main carrier lines that go to the reactor. The source molecules then enter the heated reactor chamber where they are thermally cracked and adsorbed on the wafer surface. There further reactions cause crystal layers to be grown.
12Fig. 3-3 MO bubbler and its vapor transport process.
3.1.2 Basic reaction kinetics:
The precursors for III–V MOCVD are generally a simply alkyl for the Group III source and a hydride for the Group V source. Both have the essential properties of being volatile in a suitable carrier gas stream (usually hydrogen) and being chemically stable at ambient
temperature. These precursors are normally mixed outside the reaction chamber, introduced into the reaction chamber through a suitable injector arrangement and directed onto a hot substrate. This is shown schematically in Fig 3-4. The reaction of the precursors to yield the III–V compound on the substrate can occur either in the hot vapor above the surface or on the hot surface.
13Fig. 3-4 Schematic of MOCVD process from mixing of gas streams to reaction on the
substrate surface.
There have two kinds of thermally-activated reactions happening. The homogeneous reactions are reactions in the gas phase, e.g in boundary layer and heterogeneous reactions are reactions at reactor walls or at substrate surface, occur mostly at lower temperature than homogeneous reactions.
Surface kinetics are poorly known processes, in which a number of sub-processes can be identified such as adsorption of reactant species, heterogeneous decomposition reactions,
28
surface migration, incorporation and desorption of products. The general chemical reaction of III-V compound semiconductors in the MOCVD is given by [47].
AIIIR3 + BVX3 AIIIBV + organic by-products.
where R is an alkyl or other organic group, X is usually a hydrogen atom, but can also be an organic radical or even a halogen atom, AIII and BV are the cation and anion, respectively. The by-products can simply be alkanes or more complicated species depending on R and X. In reality this very simple reaction has covered a complexity of reaction steps that have to take place. The schematic shown in Fig. 3-5 gives some of the important reaction steps that have been identified for the reaction of GaAs. This gives some insight into the complexity of the reaction kinetics and it is worth remembering that this is just a relatively straight forward reaction for MOCVD.
14Fig. 3-5 Some of the important reaction steps of GaAs grown by MOCVD [48].
limits for the growth process, e.g. the driving force, maximum growth rate and number and compositions of the equilibrium phases in the bulk or on the surface. To gather information about reaction times, steps and rates that are involved in MOVPE growth, a kinetic approach has to be used.
The growth rate in MOCVD epitaxy process is usually lower than expected from thermodynamic calculations. This is due to the surface reaction rate controlled by kinetics and mass transport of reactants in vapor phase is not fast enough, the whole system can’t reach the thermal equilibrium state. The growth rate depends on the slowest reaction step. The relation between growth temperature and growth rate can be subdivided into the three regions. (a) surface kinetics limited growth , (b) mass transport limited growth and (c) thermodynamically limited growth. (Figure 3-6)
15Fig. 3-6 Schematic of the three different temperature regimes for growth of a compound
semiconductor by MOCVD.
The growth temperatures in the surface kinetics limited region are low, starting from about 600C and reaching as low as 4000C. Difficulties are encountered as the precursors
30
surface. The surface adsorption rate of reactant source is lower than the diffusion rate of reactant source in the boundary layer. Therefore, in this region, the growth rate depends on the surface reaction rate and increases with increasing temperature.
In the transport-limited regime there will be a small dependence on temperature due to the increase in diffusion rate with temperature. Most MOCVD growth processes will take place in the transport-limited regime where it is easier to control growth rate. However, there are a number of growth processes that will occur at lower temperatures in order to control the properties such as native defect concentrations of the epitaxial films.
In the high-temperature regime, the growth rate decreases with temperature, as the equilibrium vapor pressure of the constituent elements in the film will increase and give desorption rates similar to the deposition rate, leading to significant loss of material through evaporation to the gas stream.
A well-designed reactor can eliminate the thermal convections and other disturbances, and improves the uniformity of the epitaxial layer. Reducing reactor pressure increases the gas flow rate and decreases the thickness of the boundary layer. Moreover, the low-pressure MOCVD system also significantly decreases the pyrolysis rate of the reactants in the vapor phase.
3.1.3 Precursors:
The group III precursors are metalorganic (MO) precursors, which are composed of metal atoms with alkyl radicals attached. The group III precursors we used in this thesis are
trimethyaluminum (TMAl or (CH3)3Al), trimethylgallium (TMGa or (CH3)3Ga), and
trimethylindium (TMIn or (CH3)3In), which have the same configuration that each metal
atoms (Al, Ga, and In) with three methyl radicals ((CH3)3) attached. The precursor properties
such as saturation vapor pressure and molar flow rate should be considered clearly before the crystal growth. An important relation known as the Clausius-Clapeyron equation, which gives the slope of the vapor pressure curve must be discussed. The saturation vapor pressure (P) can be driven from the following equation:
LogP = A- B/T
where P is the vapor pressure, A and B are the known constants, and T is absolute temperature.
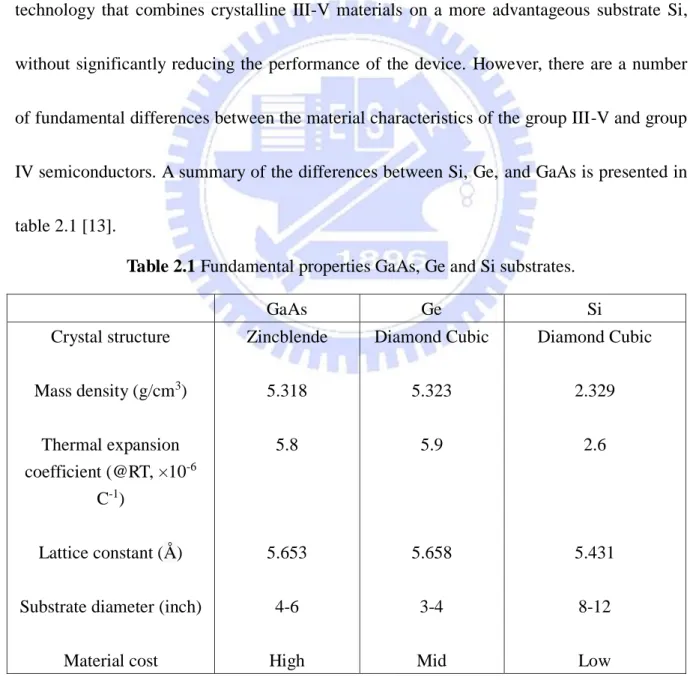
Table 3.1 Properties of group III precursors [43].
Element Symbol Melting Point (℃) Boiling Point (℃)
Vapor Pressure Liquid or Solid (15℃) A B Torr (15℃) Al TMAl 15.4 127 8.224 2135 6.477 S Al TEAl -52.5 186 10.784 3625 0.016 L Ga TMGa -15.8 55.8 8.07 1703 87.9(5℃) L Ga TEGa -82.3 143 8.083 2162 3.768 L In TMIn 88.4 133.8 10.52 3014 1.711(20℃) S In TEIn -32 184 8.93 2815 0.143 L
There are several possible group V precursors to choose from for growth of arsenide and phosphide materials. The conventional sources used by many research groups and especially used widely in industrial MOCVD process are arsine AsH3 and phosphine PH3
since they not only supply As and P but also provide H radicals on the surface leading to the removal of C-containing radicals generated from pyrolysis of the common group III precursors. The hydrides are also readily available with relatively high purity levels. Because
32
of the higher vapor pressure of group V precursors, the hydrides are used in excessive supply to prevent desorption of the group V species from the solid-gas interface, so the deposition procedure is carried out at a high V/III ratio ambient.
16Fig. 3-7 The structure of arsine, alternative TBAs and TMGa.
In general, the toxicity of As and P sources increases with the number of As-H or P-H bonds. Using metalorganic group V precursors such as tertiarybutylarsine (TBAs) and tertiarybutylphosphine (TBP) as alternative precursors could tackle this problem, as they are less hazardous and have a much lower vapor pressure than AsH3 and PH3, leading to a much
safer MOCVD process. Silane (SiH4) as n-type and carbon tetrabromide (CBr4) as p-type
dopant sources were used. Carbon could also be doped into (Al,Ga)As material by intrinsic method with the combination of low growth temperature and low V/III ratio.
3.1.4 MOCVD hazards:
Many gases used in MOCVD systems are toxic (hazardous to humans), corrosive (causes corrosion to stainless steel and other metals), flammable (burns when exposed to an ignition source and an oxygen source), explosive and/or pyrophoric (spontaneously burn or
explode in air, moisture or when exposed to oxygen). Therefore, many of the improvements in MOCVD have been driven by safety concerns [49]. The below table gives some typical interlocks associated with an MOCVD system. Reactor alarms will terminate reactor operation, laboratory alarms may terminate operation and cause evacuation of the laboratory, and facility alarms may trigger evacuation of the facility.
Reactor Laboratory Facility
Overpressure Overtemperature Loss of cooling water Toxic gas detection Exhaust loss in enclosure Emergency power off Low feed-gas pressure
Fire/smoke Toxic gas leak Exhaust loss to room Flammable gas leak
Toxic gas leak Fire
Exhaust loss Other
3.2 Epitaxial film characterization tools:
This chapter discusses the characterization techniques used for optimization of epitaxially grown semiconductor materials. The epitaxial layers are qualified by several important parameters, including film thickness, surface roughness and morphology, crystal quality and composition of epitaxial grown materials, and epitaxial layer microstructure. Each parameter can be characterized by one or more measurement techniques. The
34
knowledge of these techniques is essential to the growth of high-quality materials and to the development of high performance devices.
3.2.1 HRXRD for thin film
X-ray diffraction (XRD) is a very useful, fundamental and nondestructive characterization technique for semiconductor materials, from which the lattice constant, residual strain, alloy composition, etc. can be determined. In this study, the Bede D1 HRXRD system (Figure 3-8) equipped with a high power (2kW) X-ray source of CuKα line
was used. XRD techniques can be applied to semiconductors to measure the properties of epitaxial thin film in several forms: (1) X-ray rocking curves, (2) double crystal X-ray diffraction (DCXRD) for the determination of the compositions of grown layers, (3) reciprocal space mapping (RSM) to measure the amount of the built-in compressive or tensile strain in films and its relaxation, and (4) glancing incident angle X-ray analysis (GIXA) for epitaxial layer thickness and interface roughness [50].
17Fig. 3-8 Schematic diagram of the BEDE D1 HRXRD system.
X-rays are electromagnetic radiation with typical photon energies in the range of 100 eV to 100 keV. For diffraction applications, only short wavelength X-rays in the range of a few Angstroms to 0.1 Angstrom (1 keV – 100 keV) are used. Because these wavelength are comparable to the size of atoms, they are ideally suitable for probing the structural arrangement of atoms and molecule.
Diffraction is a phenomenon that happens when certain phase relationships exist between two or more waves. It can occur when an electromagnetic wave interacts with a periodic structure whose repeat distance is about the same as the wavelength of the wave. In-phase waves cause constructive interference and out-of-phase waves cancel each other. To measure the diffraction pattern, X-ray photons at a wavelength of λ= 1.5405Å obtained from a Cu Kα1 source are used. This wavelength is chosen since it is comparable to the periodicity
36
spacing of the crystal planes. (In a semiconductor, the typical lattice constant is around 5Å, such that this periodicity or distance between any adjacent parallel lattice planes is on the order of the X-ray wavelength). The Bragg’s law express the diffraction condition as
2dhklsinθB = nλ (Eq 3.1)
where dhkl is the spacing between adjacent lattice planes, θB is Bragg’s angle between the
lattice plane and incident X-ray, n is the order of the diffraction, and λ is the wavelength of X-ray. For the cubic crystal, the spacing dhkl is given by
𝑑ℎ𝑘𝑙 = √ℎ2+𝑘𝑎2+𝑙2 (Eq 3.2)
where a is lattice constant of interest in the semiconductor, and (h k l) are the Miller indices of the scanned lattice plane. Bragg’s approach in the analysis of DCXRD is very simple and fairly accurate method to determine the ternary semiconductor compositions and the quality of epitaxial layer and its interfacial property. Since lattice constant a of any semiconductor is related to Bragg’s angle through Equation 3.1 and Equation 3.2, a can be obtained from the spacing of planes (h k l), dhkl that is calculated from the measured θB with
fixed wavelength of X-rays. Using the single crystal substrate with a known lattice constant and orientation (nominally {100}) as a reference, the interplanar spacing of an epitaxial layer’s crystalline planes can be determined and the perpendicular and in-plane lattice parameters can be extracted. Typical XRD analysis uses the measured interplanar spacing of {004} planes and either {224} planes or {115} planes. The composition of a ternary alloy
film can be determined from these extracted lattice parameters since there is a unique relaxed lattice parameter for each alloy composition.
The full width at half maximum (FWHM) of the measured peak is another important parameter from which to determine the quality of epitaxial layer. The narrow FWHM of measured peak is the good indication of high quality material. The peak broadening of a very thin layer like a quantum well is inevitable because of the broadening effect, even though the atomic planes in the layer are perfectly periodic and defect-free. This analysis is used in growth parameter optimization by comparing the FWHM of films grown under varying conditions.
To evaluate the built-in strain or relaxation of the strain in the epitaxial layer, reciprocal space mapping (RSM) is very useful technique. When a thick semiconductor layer is grown on a substrate with a smaller lattice constant, the compressive strain starts to relax depending on its thickness. If the thickness of the grown layer is much greater than the critical thickness, the strain is fully relaxed and the heteroepitaxial semiconductor structure returns to its original cubic structure by relaxation of all three lattice constants (two from in-plane lattice constants and one from growth direction lattice constant). The compressive strain relaxation can be detected by measuring an asymmetric RSM.
38
3.2.2 Atomic Force Microscopy
Atomic Force Microscopy (AFM) is a more recently developed technique that is capable of providing atomic scale imagenary of surfaces. AFM can be used to scan the surfaces of various samples such as insulators, organic materials, ceramics, polymers, and semiconductors in different environments (atmosphere, liquid, and vacuum) because it uses mechanical forces to scan the surface. AFMs resolution is directly related to the dimension of its probe tip, while imaging resolutions of other optical or electrical microscopes are limited by diffraction effects. When a very fine probe tip comes close to surface of a sample, it can detect variety of induced forces between the surface and the probe tip. By detecting these forces, AFM is possible to reconstruct the topography of the sample.
18Fig. 3-9 A schematic 3D description of an atomic force microscope (AFM).
The scanning methods of AFM can be categorized three modes based on the tip spacing from sample surface. The inter-atomic force versus tip-to-sample spacing is shown in Figure
3-10. When the probe tip, which is attached to the end of flexible cantilever, makes physical contact with the sample surface during a scan, it is called contact mode or repulsive mode AFM. As the tip moves on the sample surface, the contact force results in bending of cantilever in response to the sample topography. By tracing this deformation, AFM gives a surface image.
19Fig. 3-10 Interatomic force vs. tip-to-sample spacing curve in AFM.
Non-contact AFM (NC-AFM) is one of the oscillating cantilever techniques and exploits the attractive force region in Figure 3-10. The typical spacing between the tip and sample surface is on the order of tens to hundreds of angstroms. NC-AFM is very desirable because it is a method for measuring the sample topography without contact, which can cause contamination or damage on sample surface. However it is more difficult to detect the force between the tip and sample than in contact mode, because the force is very small.
40
known as tapping mode. IC-AFM is very similar to NC-AFM in terms of the oscillating cantilever technique, except that for IC-AFM, at the bottom of its oscillation, the oscillating tip touches or “taps” the sample when it is brought closer to the sample surface. According to the tip-to-sample spacing, the oscillation amplitude changes. By monitoring the changes, IC-AFM images the topography of the sample surface. Since IC-AFM eliminates sample damage from lateral forces (drag or friction) in contact AFM, and overcomes artificial image due to surface contaminations in NC-AFM, it has become an important non-destructive AFM technique.
With AFM measurement, the surface smoothness, dislocation defect density, and epitaxial growth modes can be observed. Smooth surface mophorlogy is expected to be an indication of good material properties and final device performance. The root mean square (rms) roughness extracted from the AFM image is an important data to evaluate the material properties. The rms roughness is
𝑅𝑀𝑆 = √〈[ℎ(𝑟) − ℎ̅]2〉
where ℎ̅ is the mean height of the surface and h(r) is the height of the surface at a distance r.
3.2.3 Transmission Electron Microscopy
Transmission electron microscopy (TEM) is very useful characterization technique used to study metal, crystalline, polycrystalline, and organic materials with sub-atomic resolution.
A schematic of a TEM is shown in Fig 3-11. Electrons from an electron gun are accelerated by high voltages typically 100 – 400 kV, and focused on the sample by condenser lenses. The sample is placed on a small copper grid a few mm in diameter. The static beam has a diameter of a few microns. The sample must be sufficiently thin (a few tens to a few hundred nm) to be transparent to electrons, in which the thickness restriction is critical to avoid the resolution problem caused by the beam spreading after the electrons scatter into thick film. When the electron beam is passing through sample, it interacts with the material. Electron interacts strongly with the dense part of the material and weakly with the soft part of the material. This interaction difference from the different areas creates an electron intensity distribution on the imaging plane after transmission through the sample. The difference in intensity, also known as contrast can be recorded on film or on a screen and gives an image of the sample. If the direct beam from the sample is selected, the resultant image is called a bright-field (BF) image, and if any scattered electrons are selected for imaging, it is called a dark-field (DF) image.
Exploiting both image and diffraction pattern modes, TEM can determine the atomic scale morphology features and the thickness of very thin layers as well as the presence of lattice defects such as dislocations, and stacking faults.
42
20 Fig. 3-11 Block diagram of typical TEM with STEM capability [51].
3.2.4 Scanning Electron Microscopy
Scanning Electron Microscopy (SEM) is a very convenient characterization technique. When a fine electron beam with energy in the range of 10 – 30 keV is focused on a sample surface, low-energy secondary electrons are ejected from the sample by scattering between the incident electrons and the material. The secondary electrons are captured by a detector and processed to make an image of the sample. SEM has several benefits over both conventional optical microscopy and TEM. It is much better in resolution and magnification than those of the optical microscopy and much easier in sample preparation than TEM. In this study, the SEM is mainly used to observe the cross-sectional view of the epitaxially grown layers. The cross-sectional SEM image gives fairly accurate thickness information for each layer and it can be used for growth rate calibration to make precisely controlled device Structures.
Chapter 4
Results and Discussion
4.1 GaAs/Si thin film characterization:
Heteroepitaxial growth of GaAs on Si has attracted much attention due to its potential application for devices of monolithic opto-electronic integrated circuit. However, the inherent difficulties such as 4.1% lattice mismatch, 60% thermal coefficient difference and antiphase domain formation will easily create a large number of threading dislocations that cause the quality of devices critically decrease. Therefore, an appropriate growth condition at very early stage are required for the epitaxy growth because the coalescence of GaAs nuclei on Si substrate is the source of threading dislocations at the early stage.
Si (001) substrate with a 6˚ offcut toward [110] was chosen to be sufficiently high angle so as to ensure diatomic steps. A homogeneous coverage is enhanced at the early stage of nucleation of crystalline GaAs because adatoms diffusing on surface preferentially adsorb at the step edge sites and step-flow growth is promoted [52],[53]. Because the substrates are not “epi-ready” and long-time exposure to air, a chemical cleaning process in buffered oxide etch solution (BOE) was used to eliminate the thick silicon oxide on the Si substrate. Just before the growth the oxide layer on the Si surface was stripped by a BOE solution for 30
44
seconds, finally dried with dry nitrogen to obtain a hydrogen-terminated surface. The Si surface after cleaning was considered oxide-free, hydrophobic and terminated by H atoms. This H-terminated Si surface is supposed stable during the transfer to reactor.
4.1.1 Effect of annealing ambient on GaAs film formation:
The wafer after dipping in a dilute HF solution to clean out the surface oxide was put into the reaction chamber and followed by an annealing process. Due to the possibility of oxidation and contamination during the transfer, an annealing step at high temperature is necessary not only for oxide removal, but also for the surface reconstruction [20]. The annealing procedure was carried out in two different sequences all at 6500C in 5 min, then subsequencely reduced to GaAs thin film growth temperature at 4000C with V/III ratio of 23. The sequence A was done in H2 gas ambient only and the sequence B was in the flow of H2
including AsH3 flux. The AsH3 flux during the annealing period was chosen as 0 sccm, 10
sccm and 40 sccm. The influence of annealing time and temperature were not studied in detail, however, as keeping the wafer annealed longer time damage the substrate surface, that lead to an increasing roughness.
21Fig. 4-1 The two sequences for investigating the effect of substrate annealing ambient.
When the annealing treatment was done in a flow of H2 like in the sequence A, there
were only large GaAs islands formed on the surface. The surface morphology on the wafer area between islands is similar to the surface of Si substrate after BOE cleaning, the same roughness mean square (RMS) value of 0.47 nm. The distance between islands were very large and there is no evidence for GaAs coverage of the substrate between these islands. This indicates that epitaxy has progressed mainly by growth of islands rather than nucleation of new islands. On the other hand, when the thermal treatment was done with introducing an AsH3 flow of 10 sccm, the GaAs still nucleated in form of small islands but reduced in size
and higher density. When the As flux increased to 40 sccm, a GaAs continuous film has been achieved.
46
22Fig. 4-2 SEM image on GaAs/Si top-view surface annealing in H2 ambient only.
The growth of epitaxial film involves the increased adatom migration. If the adatom migration is increased, then the adatoms can migrate over longer distances thereby enhancing the step growth mode. There was evidence that the Ga and As are mobile on the H-terminated Si surface [54]. Whereas, atomics H limit the surface diffusion length of adatoms by essentially increasing their incorporation rate into the growing layer [55]. Therefore, if a 3D growth started at the early stage, the presence of H atoms would further enhance the islands to grow bigger. For continuous film growth, an As-fully-passivated surface should be produced, rather than a partial H-terminated one. All of Si-H bonds should be replaced by Si-As bonds in the GaAs epitaxy growth on Si substrate.
23Fig. 4-3 AFM results of three GaAs/Si samples: a) annealed in H2, b) in H2/10 sccm
AsH3 and c) in H2/40sccm AsH3 show the RMS value of 0.47 nm, 2.24 nm and 0.93 nm,

![Table 3.1 Properties of group III precursors [43].](https://thumb-ap.123doks.com/thumbv2/9libinfo/8246218.171523/44.893.131.818.449.833/table-properties-group-iii-precursors.webp)
