以虛擬實境動態駕駛系統進行駕駛員暈車狀態與腦波反應之關連性研究
84
0
0
全文
(2) 以虛擬實境動態駕駛系統進行駕駛員暈車狀態 與腦波反應之相關性研究 Study of Relationship between Electroencephalogram Dynamics and Motion Sickness of Drivers in a Virtual Reality Dynamic Driving Environment 研 究 生:李 欣 泓 指導教授:林 進 燈. 教授. Student:Hsin-Hung Li Advisor:Prof. Chin-Teng Lin. 國立交通大學 電機與控制工程學系 碩 士 論 文 A Thesis Submitted to Department of Electrical and Control Engineering College of Electrical Engineering and Computer Science National Chiao Tung University in partial Fulfillment of the Requirements for the Degree of Master in Electrical and Control Engineering July 2005 Hsinchu, Taiwan, Republic of China. 中華民國九十四年七月.
(3) Copyright © 2005 by Hsin-Hung Li All rights reserved.
(4) 碩士論文授權書 本授權書所授權之論文為本人在_國立交通_大學(學院)_電機與控制工程_系所 ___C___組__九十三__學年度第_二_學期取得_碩_士學位之論文。 論文名稱:_以虛擬實境動態駕駛系統進行駕駛員暈車狀態與腦波反應之關連性研究_ 指導教授:_林進燈_教授_______________ ________ 1.5同意 不同意 本人具有著作財產權之上列論文全文(含摘要)資料,授予行政院國家科學委員會科學 技術資料中心(或改制後之機構),得不限地域、時間與次數以微縮、光碟或數位化等 各種方式重製後散布發行或上載網路。 本論文為本人向經濟部智慧財產局申請專利(未申請者本條款請不予理會)的附件之 一,申請文號為:______________,註明文號者請將全文資料延後半年再公開。 2.5同意 不同意 本人具有著作財產權之上列論文全文(含摘要)資料,授予教育部指定送繳之圖書館及 國立交通大學圖書館,基於推動讀者間「資源共享、互惠合作」之理念,與回饋社 會及學術研究之目的,教育部指定送繳之圖書館及國立交通大學圖書館得以紙本收 錄、重製與利用;於著作權法合理使用範圍內,不限地域與時間,讀者得進行閱覽 或列印。 本論文為本人向經濟部智慧財產局申請專利(未申請者本條款請不予理會)的附件之 一,申請文號為:______________,註明文號者請將全文資料延後半年再公開。 3.5同意 不同意 本人具有著作財產權之上列論文全文(含摘要),授予國立交通大學與台灣聯合大學系 統圖書館,基於推動讀者間「資源共享、互惠合作」之理念,與回饋社會及學術研 究之目的,國立交通大學圖書館及台灣聯合大學系統圖書館得不限地域、時間與次 數,以微縮、光碟或其他各種數位化方式將上列論文重製,並得將數位化之上列論 文及論文電子檔以上載網路方式,於著作權法合理使用範圍內,讀者得進行線上檢 索、閱覽、下載或列印。 論文全文上載網路公開之範圍及時間 – 本校及台灣聯合大學系統區域網路:96 年 01 月 01 日公開 校外網際網路:96 年 07 月 01 日公開 上述授權內容均無須訂立讓與及授權契約書。依本授權之發行權為非專屬性發行權利。依 本授權所為之收錄、重製、發行及學術研發利用均為無償。上述同意與不同意之欄位若未 鉤選,本人同意視同授權。 研究生簽名: 學號: 9212364 (親筆正楷) (務必填寫) 日期:民國. 九十四. 年. 七. 月. 二十七. 日. 1. 本授權書請以黑筆撰寫並影印裝訂於書名頁之次頁。.
(5) 國家圖書館博碩士論文電子檔案上網授權書 本授權書所授權之論文為本人在_國立交通_大學(學院)_電機與控制工程_系所 _______組_九十三__學年度第_二_學期取得_碩_士學位之論文。 論文名稱:以虛擬實境動態駕駛系統進行駕駛員暈車狀態與腦波反應之關連性研究 指導教授:_ 林 進 燈 _ 教 授 _ _ _ _ _ _ _ _ _ _ _ _ _ _ _ _ _ _ _. 5同 意. 不 同 意. 本人具有著作財產權之上列論文全文(含摘要),以非專屬、無償授權國家圖書館,不 限地域、時間與次數,以微縮、光碟或其他各種數位化方式將上列論文重製,並得將 數位化之上列論文及論文電子檔以上載網路方式,提供讀者基於個人非營利性質之線 上檢索、閱覽、下載或列印。 上述授權內容均無須訂立讓與及授權契約書。依本授權之發行權為非專屬性發行權 利。依本授權所為之收錄、重製、發行及學術研發利用均為無償。上述同意與不同意 之欄位若未鉤選,本人同意視同授權。 研究生簽名: (親筆正楷) 日期:民國. 學號: 9212634 (務必填寫) 九十四. 年. 七. 月. 二十七. 日. 1. 本授權書請以黑筆撰寫,並列印二份,其中一份影印裝訂於附錄三之一(博 碩士論文授權書)之次頁﹔另一份於辦理離校時繳交給系所助理,由圖書館 彙總寄交國家圖書館。.
(6) To my wonderful family.
(7) Stop asking about technical issues and start asking about process.. Jean Michael Mistrot.
(8) 以虛擬實境動態駕駛系統進行駕駛員暈車狀態 與腦波反應之關連性研究 指導老師:林進燈 教授. 研究生:李欣泓. 國立交通大學電機與控制工程研究所碩士班. 摘. 要. 暈車是每個人共有的生活經驗,但顯少有研究探討暈車與腦波的關 係。本論文以動態虛擬駕車之平台為基礎,用非侵入式的方式量測並探討 腦波在駕駛員暈車時的變化。由虛擬實境場景配合史都華平台所發展出來 的虛擬動態駕車環境,提供一個接近真實的駕駛環境,也是一個低成本、 高安全的實驗環境。一般的暈眩實驗,均僅使用問卷來做為受測者主觀的 暈車指標評定,個體間存在無法評估的差異性,而本論文同時參考受測者 主觀的暈眩問卷分數及包括心電圖、胃電圖及皮膚電導的客觀生理反應, 再將各指標數據交叉驗證,以確保受測者處於暈車狀態下。針對主客觀都 有暈車反應的受測者腦波進行分析,首先,將去除雜訊的腦波以獨立成分 析技術(ICA)分離出與暈車相關的獨立成分,再針對這些與暈車相關的獨立 成分做頻譜分析。發現受測者在暈車現象產生時,在腦部頂葉 (parietal lobe) 位置附近之獨立成分的 10Hz 或 20Hz 附近的活動能量明顯被抑制。根據實 驗結果,本實驗成功的找出腦部與暈車高度相關的位置及其能量被抑制的 現象。. i.
(9) Study of Relationship between Electroencephalogram. Dynamics and Motion Sickness of Drivers in a Virtual Reality Dynamic Driving Environment Student: Hsin-Hung Li. Advisor: Prof. Chin-Teng Lin. Department of Electrical and Control Engineering National Chiao Tung University. ABSTRACT. The nausea-related Electroencephalogram (EEG) dynamics corresponding to motion sickness inclining tasks is studied in this thesis with the virtual-reality based dynamic driving environment. The VR-based dynamic driving environment provides the advantages of safety, low cost, and the realistic stimuli to the subjects. The Motion Sickness Questionnaire. (MSQ). is. designed. and. the. physiological. responses. (including. Electrocardiogram (EKG), Electrogastrography (EGG) and galvanic skin response) are recorded to assess the motion sickness. The EEG changes correlated to motion sickness will not only refer to the MSQ score, but the objective indices should also be involved for systematic evaluation. It was found from the result that the EGG signal is an efficient index, which is suitable for most of the subjects with excellent response time. The independent component analysis (ICA) combined with power spectral analysis is applied to investigate the EEG dynamics during the motion sickness. The experiment results demonstrated that the subjects have the power-suppressions in some specific frequency bands (10 Hz and/or 20 Hz) in the parietal lobe region. The nausea-related region and the nausea-influenced power spectrum suppression can be successfully obtained with our experimental results.. ii.
(10) Acknowledgements I would like to express my gratitude to my advisor, Prof. Chin-Teng Lin, for his help and guidance during my student career. Special thank is for Prof. Tzyy-Ping Jung, Institute for Neural Computation in University of California San Diego, Prof. Jeng-Ren Duann, Institute for Neural Computation in UCSD, Dr. Sheng-Fu Liang, Brain Research Center in NCTU, and Mr. Ruey-Song Huang, Institute for Neural Computation in UCSD, for their valuable suggestions during these years. Thanks are also accredited to the members of my research group members for their concern and encouragement. The days with you all were so wonderful. I further thank my family for their love and total support throughout the years.. 誌 謝 首先,感謝林進燈教授提供一個領先全球的高科技實驗環境,並實際給予許多寶 貴的經驗與建議,感謝口試委員陳永耀教授及楊谷洋教授對於論文提供多方面的建 議。在論文寫作時感謝梁勝富博士的指導及陳玉潔學姐的兩肋插刀。感謝趙文鴻學長 及吳瑞成學長給予的諸多建議,感謝黃冠智學長及黃騰毅學長長期以來在研究及生活 上的支持與幫助。也感謝董行偉同學、陳俞傑同學及高士政同學的相互扶持,及謝弘 義學弟、蕭力碩學弟及謝宗哲學弟的熱情相挺。另外,要特別感謝龜阿姨及胖叔叔對 於我無理的任性給予最大的包容,更感謝父親李正寬先生及母親賴素香女士的養育之 恩及無私的奉獻,在此謹將本篇論文獻給你們,並致上最高的敬意。. 謝. 辞. この論文を完成するにあたり、お世話になった皆様にお礼申し上げます。今日ま で沢山の方々 に守られ、支えられ、生きてこられたことをこの場におきまして皆様 への感謝の気持ちでいっぱいです。先輩達には当初右も左もわからなかった自分に 基本的なことから教えていただきました。色々 な優秀な後輩達はさまざまな場面で お世話になりました。また GVO の山岡先生、喜瀬先生、李お姉様、樫様、智様と曾 様には多くの有益な助言をいただきました。みな個性的であり、おかげで楽しく過 ごすことができました。そして応援して下さった新竹地域の学生同盟の皆様にも深 く感謝したい。最後にこれまで自分を育ててくれた両親に感謝致します。 iii.
(11) CONTENTS Abstract in Chinese ………………………………………………………….... i. Abstract in English …………………………………………………………… ii Acknowledgements …………………………………………………………… iii Contents ……………………………………………………………………… iv List of Figures ………………………………………………………………… vi List of Tables ………………………………………………………………… viii Abbreviations ………………………………………………………………… ix. Chapter 1 Introduction …………………………………………………….... 1. 1.1 Research Background Survey …………………………………………. 2. 1.2 Organization of the Thesis ……………………………………………. 4. ………………….……………………. 6. 2.1 Introduction of Motion Sickness ………………………………………. 6. 2.1.1 The Vestibular System ……………………………………………. 6. 2.1.2 The Symptoms of Motion Sickness ………………………………. 9. 2.1.3 Findings from Previous Studies ……………………………………. 9. Chapter 2 Design of Experiments. 2.2 Experimental Protocol ………………………………………………… 14 2.3 Virtual-Reality-based Dynamic Driving Environment ………………… 15 2.3.1 Stewart Platform. ………………………………………………… 16. 2.3.2 Apparatus in the Real Car ………………………………………… 17 2.3.3 Design of the VR Scene …………………………………………… 19 2.4 Data Acquisition ……………………………………………………… 20 2.4.1 Subjects …………………………………………………………… 20 2.4.2 Data Collection Sensors …………………………………………… 21 Chapter 3 Assessment of Motion Sickness Symptoms …………………… 28 3.1 Subjective Evaluation of Motion Sickness: Motion Sickness Questionnaire (MSQ) Design ………………………………………… 28 3.2 Physiological Responses induced by Motion Sickness ……………… 30 3.2.1 EKG Changes during Motion Sickness …………………………… 30 iv.
(12) 3.2.2 EGG Changes during Motion Sickness …………………………… 33 3.2.3 GSR Changes during Motion Sickness …………………………… 35 3.3 Assessment of Motion Sickness Symptoms with Subjective Evaluation and Physiological Responses ………………………………………… 38 Chapter 4 Analysis Results of EEG Response during Motion Sickness … 41 4.1 EEG Signal Analysis Procedure ……………………………………… 41 4.1.1 Independent Component Analysis ………………………………… 43 4.1.2 Spectral Analysis ………………………………………………… 46 4.1.3 Dynamic Spectral Analysis ……………………………………… 47 4.2 Relationship between the Power Spectrum of ICA components and Motion Sickness ……………………………………………………… 49 4.3 Spectral Dynamic Changes of ICA Components ……………………… 51 Chapter 5 Discussions ……………………………………………………… 54 5.1 Motion Sickness Influence Region on Human Cortex ………………… 54 5.1.1 The 20 Hz power suppression in left and right parietal region …… 54 5.1.2 The 10 Hz power suppression in left and right parietal region …… 56 5.1.3 The 10/20 Hz power suppression in the central parietal region … 57 5.1.4 The nausea-related regions on human cortex. …………………… 59. 5.2 Power Spectrum Suppression Induced by Motion Sickness…………… 60 5.3 Reliability of Different Physiological Responses. …………………… 61. Chapter 6 Conclusions and Future Work ………………………………… 63 References …………………………………………………………………… 64. v.
(13) LIST OF FIGURES Fig. 2-1. The vestibular system and its measurement principles. ………….... 6. Fig. 2-2. A cross section of a semicircular canal ……………………………. 8. Fig. 2-3. A rotating chair in a metal cylinder ………………………………… 10 Fig. 2-4. A rotating drum in a metal cylinder ………………………………… 11 Fig. 2-5. A rotorcraft simulator ……………………………………………… 13 Fig. 2-6. The virtual reality scene of Byung-Chan’s experiments …………… 13 Fig. 2-7. The experimental scheme …………………………………………… 14 Fig. 2-8. A 360-degree 3D Virtual Environment. …………………………… 15. Fig. 2-9. The Stewart platform in the BRC lab ……………………………… 16 Fig. 2-10. A real car fixed on the Steward platform ………………………… 17 Fig. 2-11. A video camera placed beside the steering wheel ………………… 18 Fig. 2-12. The NuAmps and the GSR100C ………………………………… 19 Fig. 2-13. Development flow of the VR scene ……………………………… 20 Fig. 2-14. The 10-20 international electrode placement system……………… 21 Fig. 2-15. The 32 EEG electrodes locations ………………………………… 22 Fig. 2-16. The electrode cap and the EEG signal amplifier ………………… 23 Fig. 2-17. Locations of the EKG electrodes on subject’s chest ……………… 24 Fig. 2-18. Locations of the EGG electrodes ………………………………… 25 Fig. 2-19. Typical set up of galvanic skin response electrodes ……………… 27 Fig. 2-20. Galvanic skin response electrodes setup in our experiments ……… 27 Fig. 3-1. Motion Sickness Questionnaire (MSQ) designed in this study …… 29 Fig. 3-2. A typical spectral changes of EKG dominant frequency during our experiment (subject 1) ………………………………………… 31 Fig. 3-3. Variations of the EKG dominant frequency ………………………… 33 Fig. 3-4. Variations of the EGG dominant frequency ………………………… 35 Fig. 3-5. The GSR waveform of subject 7 …………………………………… 36 Fig. 3-6. The GSR waveform of subject 1 …………………………………… 37 Fig. 3-7. The comparison results of both subjective evaluation and physiological responses. ………………………………………… 39. Fig. 4-1. Flowchart of the EEG signal analysis procedure …………………… 42 vi.
(14) Fig. 4-2. The scalp topographies of ICA weighting matrix W ……………… 46 Fig. 4-3. The three epochs for the spectral analysis ………………………… 47 Fig. 4-4. Moving-averaged log power spectral analysis for for time courses of ICA components ………………………………………………… 48 Fig. 4-5. Spectral analysis results of subject 10 ……………………………… 49 Fig. 4-6. Spectral analysis results of subject 5 ……………………………… 50 Fig. 4-7. Subject 10’s spectral dynamic variations of ICA component 13 (left parietal lobe) at 23 Hz ……………………………………………… 51 Fig. 4-8. Subject 1’s spectral dynamic variations of ICA component 17 (right parietal lobe) at 18 Hz ……………………………………………… 52 Fig. 5-1. The 20 Hz power activity suppression of subject 1 in two different ICA components …………………………………………………… 55 Fig. 5-2. The 20 Hz power suppression in the side parietal lobe …………… 55 Fig. 5-3. The 10 Hz power activity suppression of subject 5 in two different ICA components …………………………………………………… 56 Fig. 5-4. The 10 Hz power suppression in the side parietal lobe …………… 57 Fig. 5-5. The nausea-related area in the central parietal region. …………… 58. Fig. 5-6. The 10 Hz and 20 Hz power suppression in the central parietal lobe 58 Fig. 5-7. The region of parietal lobe ………………………………………… 60. vii.
(15) LIST OF TABLES Table 1-1: Comparisons of Researches …………………………………….... 3. Table 2-1: NuAmp Specifications …………………………………………… 23 Table 2-2: The Specification of GSR Amplifier ……………………………… 26 Table 3-1: The results of MSQ ……………………………………………… 30 Table 3-2: EKG dominant frequency (Hz) variations of different subjects in the three different sessions ……………………………………… 32 Table 3-3: EGG dominant frequency (Hz) variations of different subjects in the three different sessions ……………………………………… 34 Table 3-4: Variation performance comparison of different motion sickness indices …………………………………………………………… 38 Table 5-1: Comparison of nausea-related regions …………………………… 59 Table 5-2: Comparisons of indices …………………………………………… 62. viii.
(16) ABBREVIATIONS ANS. Autonomic Nervous System. EEG. Electroencephalogram. EGG. Electrogastrography. EKG. Electrocardiogram. FFT. Fast Fourier Transform. GSR. Galvanic Skin Response. HRV. Heart Rate Variability. ICA. Independent Component Analysis. MSQ. Motion Sickness Questionnaire. PSD. Power Spectrum Density. VR. Virtual Reality. WTK. WorldToolKit. ix.
(17) Chapter 1 Introduction. History of car industry has been more than 100 years. The performance of the cars makes progress with each passing day during the past 100 years. The car has become a major transportation method which is widely applied in nowadays. Some researches are focused on the manufacture of intelligent car for the purpose of safety driving. The concern with the related works has been growing for the last several years. The problem of traffic accidents has been brought to public attention for the reason of high fatality rate. Plenty of researches are interested in the analysis of the physiological signals of drowsy subjects. Accidents caused by drivers’ drowsiness have a high fatality rate due to the decline of drivers’ abilities in perception, recognition, and vehicle control abilities while sleepy. Besides, the symptoms of motion sickness sometimes occur to the drivers and passengers, where the symptoms are headache, pallor, sweating, dryness of mouth, fullness of stomach, nausea, and vomiting. The malaise of sickness can sometimes cause self-control ability decline and lead to serious traffic accident fatalities. Several researches have been made on symptoms of motion sickness. A study of R. S. Kellog et al. described that the malaise of sickness may last more than one hour [1], and D. W. Gower et al. further proved that the duration of sickness can even last for one day [2]. Many previous studies have indicated that the malaise of sickness can sometimes induce decline of thinking and response ability. However, very few attempts have been made at relationship between electroencephalogram (EEG) dynamics and motion sickness. The main purpose of our research in this thesis is to investigate the nausea-related feature of EEG signals.. 1.
(18) 1.1 Research Background Survey In earlier 19th century, Flourens indicated that the symptoms of motion sickness can be induced by proper stimuli applied to the subjects’ with their semicircular canals are actuated [21]. Regularly movements are found on the subjects’ eye-balls during the experiments when the subjects feel sick, where the phenomenon can be also found after the subjects spin themselves. Some electrical effects are found on the vestibular in the inner ear when people do some particular exercises. This phenomenon was first discovered by Robert Barany in early 20th century [22]. He proposed that the vestibular is an organ highly related to the sense of balance, in the other word, people feel dizzy when the stimuli between vestibular and brain are different. He also found that the function of the vestibular will be changed or disturbed by the impulse information passed from the cerebellum cortex. He was awarded the Nobel Prize for this work in the field of Physiology and Medicine in 1914. The physiological signal analysis of the motion sickness research was first started in 1970s. Some signals, such as heart rate, body temperature were first used at the initial stage of the research; some researches were then focused on breathe, electrogastrography (EGG), galvanic skin response (GSR) signals [3-7]. Some works in recent years were focused on the analysis of electroencephalogram (EEG) [8]. For motion sickness study, the representative researches are listed in the Table 1-1. The first famous research of motion sickness was done by Graybiel et al. [3] in 1980. The subjects were asked to sit on a rotation chair in a metal cylinder. The physiological signals including heart rate, blood pressure and body temperature were then analyzed after the 30-second rotating duration. Stern et al. [4] first used EGG to study the onset, time course and symptoms of motion sickness induced by circularvection around the subject’s spinal axis in 1985. Cowings et al. [5] induced the symptoms of motion sickness of 58 subjects with two rotating-chair tests. They studied the self-regulation of autonomic nervous system activity. The measured physiological 2.
(19) responses measured heart rate, finger pulse volume, respiration rate, and skin conductance. Refering to the scores of subjective questionnaire, they examined the stability of specific magnitude responses across both tests.. Table 1-1: Comparisons of the related Researches.. Authors. Induced Method. Graybiel (1980) [3]. Rotation chair. Recorded Signals. Heart rate, blood pressure and body temperature. Stern (1985) [4]. Rotation screen. EGG. Cowings (1990) [5]. Rotation chair. Heart rate, breathe and GSR. Miller (1993) [6]. Simulated spacecraft Heart rate, breathe and GSR. Hirohisa (1996) [7]. Boat in the sea. Heart rate and EGG. Min (2004) [8]. Virtual reality scene. 3. EEG, ECG, GSR,and skin temperature.
(20) A rotorcraft simulator was used by Miller et al. for the study of simulator-induced sickness in1993 [6]. Their objective was to demonstrate sensitivity of physiological measures relative to self-reports of simulator sickness severity. The data suggested that heart period, tachygastria, and skin conductance level were more sensitive to simulator sickness than were vagal tone and normal myoelectrical gastric activity. The effect the heart rate variability and electrogastrogram (EGG) corresponding to severe or mild motion sickness has been examined by Hirohisa et al. in 1996 [7]. The experiments were done on a boat in the Tokyo Bay to record the physiological signals in a severe sea sickness. It was shown that 0.05 Hz rhythm of EGG slightly enhanced during the mild motion sickness whereas HRV spectra had no significant difference. Min et al. project the virtual reality (VR) scene on a LCD monitor to induce motion sickness [8]. Both subjective evaluation and electroencephalogram (EEG) signals of each 5-min interval were analyzed to evaluate motion sickness. The results indicated that the frequency band 4 ~ 8 Hz of Fz EEG channel and the scores of subjective questionnaire are highly correlated. However, the stimuli of the previous researches are not realistic to the subjects. The Stewart platform and the VR technology can provide a realistic environment in our application. And also, the symptoms of motion sickness are investigated with multi-stream physiological signals and the motion sickness questionnaire (MSQ). The assessment of both physiological responses and subjective evaluation guarantees the objectivity of motion sickness.. 1.2 Organization of the Thesis The thesis is organized as follows. The experimental setup including data collection, the setup of the virtual environments and the design of the virtual reality scene is given in Chapter 4.
(21) 2. The analysis procedures of the multi-stream physiological signals related to motion sickness are given in Chapter 3. Chapter 4 describes the analysis EEG change corresponding to motion sickness. The discussions of experimental results are summarized in Chapter 5. Finally, the conclusions and future research directions are given in the closing chapter.. 5.
(22) Chapter 2 Design of Experiments. The induce factors of motion sickness are going to be introduced in this chapter, by means of a simple introduction to the vestibular system in human barin and inner ear. The experimental setup and environment are also given in this chapter, including design of the experiment scheme, Stewart platform, VR technology and physiological signal collection.. 2.1 Introduction of Motion Sickness Motion sickness begins when the brain receives visual and sensory clues that contradict each other. The introduction of the vestibular system in the inner ears are going to be introduced in the first subsection. A short description of motion sickness symptoms and the motion sickness experiments design in previous studies are summarized at follow subsections.. 2.1.1 The Vestibular System The vestibular system, a sensory apparatus localized bilaterally in the inner ears, provides information about movement and orientation of the head and body in space. The vestibular system is comprised of the otoliths and the non-acoustic portion of the inner ear which consists of three semicircular canals. The otoliths are the blue and green colored areas in Fig. 2-1, which detect linear acceleration. The three semicircular canals are the red, orange and pink areas in Fig. 2-1, which detect angular acceleration [23].. 6.
(23) Fig. 2-1. The vestibular system and its measurement principles [23]. The otoliths provide the inertia required to drag the hair cells from side to side to provide the perception of motion. Once a constant speed is achieved, the otoliths stabilize and perceive motion disappears with respect to the vestibular system. An example of this phenomenon is sitting in a car when it first accelerates and then stabilizes. Normal function of this system is essential in many types of sensory-motor processes (e.g. compensatory eye movements, postural control, etc.). The three semicircular canals correspond to the three dimensions of human movement can take place, respectively. Therefore, each canal detects motions in a single plane. Each canal is filled with a fluid called endolymph, which flows through the canal as the head experiences angular acceleration. As the fluid flows through the canal, it deflects small hair-like cells, called cupula, which send signals to the vestibular receiving areas of the brain, as shown in Fig. 2-2. It is noted that there are two vestibular components, located on two sides of the head that mirror each other and act in a push-pull manner. Since each group of hair cells is polarized, they can be either excited (pushed) or inhibited (pulled) based on which direction the cupula move. It is important for both vestibular apparatuses to agree with each other. Under normal operation, one side of the head should push and the other should pull. If both sides are pushed, for example, vertigo will result [24]. 7.
(24) Fig. 2-2. A cross section of a semicircular canal [52].. Furthermore, vestibular information plays important roles in perceptual tasks such as ego motion estimation. More recently, vestibular information was shown to disambiguate the interpretation of dynamic visual information experienced simultaneously during observer’s movement. As an example, considering the constant small wavers and rocking back and forth when someone is trying to stand still. This is a direct reflection of the vestibular system at work. Under normal circumstances, the brain gathers information using the eyes, the inner ear, expectations and previous experiences. The problem begins when the brain receives visual and sensory clues that contradict each other. For example, if someone is inside a ship, with no view of the horizon, the room appears to be still but the balance mechanism in his inner ear detects that he is rocking back and forth when motion sickness begins.. 8.
(25) 2.1.2 The Symptoms of Motion Sickness The malaise of motion sickness can be detected in several ways. Paleness is often the first symptom, then cold sweat on the forehead when people feel sick. There are a number of symptoms that can occur due to motion sickness including eye strain, headache, pallor, sweating, dryness of mouth, fullness of stomach, disorientation, vertigo, ataxia, nausea and vomiting [27]. There is an important concept which should be declared, that the symptoms of motion sickness are not identical to everyone. Symptoms are greatly depending on different individuals. It is possible that there could be some symptoms which are not listed here. According to the study of Kolasinski [9], some people get motion sickness easier, while the others not. People who suffer from migraines are five times more likely to be affected. Women are more susceptible than men, and children are also more susceptible than adults. Some researches [28] have indicated that children age from 2 to 12 is easiest to get motion sickness, and the Asian suffer more than the others. Some abilities of individuals are also highly related to susceptivity of motion sickness. People with low ability of mental rotation or low concentration ability get the symptoms of nausea easier than others. These researches reveal that the individual difference between different subjects is large even in the same environment or stimuli condition.. 2.1.3 Findings from Previous Studies Study of motion sickness by meaning and analysis the physiological signals started in 1970s. Heart rate, and body temperature were first used at the initial stage [3]. Then, some researches involved more other physiological signals such as breathe, electrogastrography (EGG), galvanic skin response (GSR) signals to this study [4-7]. Analysis of electroencephalogram (EEG) related to motion sickness was approached in recent years [8]. The first famous research of motion sickness was done by Graybiel et al. in 1980 [3]. 9.
(26) The subjects were asked to sit on a rotation chair in a metal cylinder as shown in Fig. 2-3. The physiological signals including heart rate, blood pressure ,and body temperature were recorded and then analyzed after the 30-second rotating duration. They concluded that the symptoms of motion sickness are not related to those recorded signals according to their results.. Fig. 2-3. A rotating chair in a metal cylinder [3].. However, the symptoms of motion sickness are reaction results between sympathetic nervous system and the parasympathetic nervous system, which are very dynamic. Graybiel et al. may wrong when they said that the symptoms of motion sickness are not related to the heart rate, blood pressure ,and body temperature, because they first analysis the signal with a 30-second averaging procedure, the operation has eliminated the dynamic property of the signals.. 10.
(27) Stern et al. [4] first used EGG to study the onset, time course and symptoms of motion sickness induced by circularvection around the subject’s spinal axis, as shown in Fig. 2-4. A metal cylinder 91.5 cm in height and 76 cm in diameter was designed to provide visual stimulus. The interior of the cylinder was covered with alternating 3.8 cm-wide black and 6.2 cm-wide white vertical stripes. The subject’s head was maintained in the center of the drum by means of a chin rest. Based on visual inspection of the EGG waveform with time, Stern et al. [4] reported a shift in the dominant frequency of myoelectrical activity from 3 cycles per minute (cpm) to 5-8 cpm in all symptomatic subjects. 14 symptomatic subjects were labeled as “tachygastria” among a total of 21 subjects.. Fig. 2-4. A rotating drum in a metal cylinder [4].. 11.
(28) A later definition of by the same authors specifically indicated that tachygastria is the absence of the 3 cpm and an increased tachygastria activity in the 4-9 cpm frequency range. Sickness was defined as when subjects reported one or more of following symptoms: nausea, salivation, dizziness, and/or warmth. In the 14 symptomatic subjects, tachygastria appeared on the average 5 min after the start of drum rotation. In addition, tachygastria preceded the symptoms of motion sickness by 1 min in 9 of 14 symptomatic subjects. Cowings et al. induced the symptoms of motion sickness of 58 subjects during two chair-rotating tests [5]. They studied the self-regulation of autonomic nervous system (ANS) activity. The measured physiological signals included heart rate, finger pulse volume, respiration rate, and skin conductance. According to the scores of the subjective questionnaire, they examined the stability of specific magnitude responses across both tests. Correlation analysis revealed marked, but quite stable, individual differences in ANS responses to both mild and severe motion sickness. These findings confirmed their prior observation that people are sufficiently unique in their ANS responses to motion sickness provocation such that it necessary to tailor self-regulation training individually. They also observed that individual ANS patterns are sufficiently consistent from test to test to serve as an objective indicator of individual motion sickness malaise levels. As shown in Fig. 2-5 Miller et al. used a rotorcraft simulator to study the simulator-induced sickness [6]. Their objective was to investigate the sensitivity of physiological measures relative to self-reports of simulator sickness severity. The data suggested that heart period, tachygastria, and skin conductance level were more sensitive to simulator sickness than vagal tone and normal myoelectrical gastric activity. The effect of the motion sickness to the heart rate variability (HRV) and electrogastrogram (EGG) has been examined by Hirohisa et al. in 1996 [7]. The experiments were done on a boat in the Tokyo Bay to record the physiological signals in the motion sickness. It is seen EGG 0.05 Hz rhythm slightly enhanced during the motion sickness whereas HRV spectra show no significant difference. 12.
(29) Fig. 2-5. A rotorcraft simulator [6].. Min et al. project the virtual reality (VR) scene on a LCD monitor to induce motion sickness [8] as shown if Fig. 2-6 to induce motion sickness. Both subjective evaluation and EEG signals of each 5-min interval were analyzed to evaluate motion sickness. The results indicated that the frequency band 4 ~ 8 Hz of Fz EEG channel and the scores of subjective questionnaire are highly correlated.. Fig. 2-6. The virtual reality scene of Min’s experiments [8]. 13.
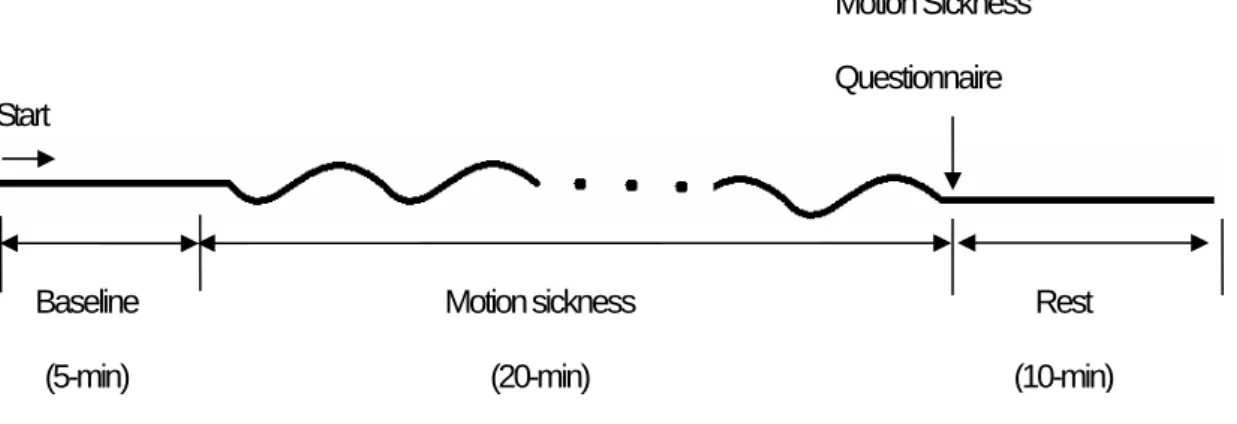
(30) In this research, a consecutive curve-road driving experiment on a virtual-reality dynamic motion platform is designed to induce motion sickness that can be experienced in the real world. Various physiological signals of the subject including EEG, EKG, EGG, and GSR are recorded simultaneously when he/she is driving. More details are presented in the following sections.. 2.2 Experimental protocol For the reason of safety and reality, the virtual reality (VR) technology is used in our experiments to induce motion sickness. It takes the advantages of low cost, reality and time saving. The VR scene combined with the Stewart dynamic platform can provide the visual and kinesthetic stimuli to subjects. The subjects can interact directly with the environment and perceive more realistic driving conditions during the experiments. A three-stage driving task is designed for this study. A ten minutes practice session was hold before each experiment which allowed the subjects to get used to the situation and the control methods. It consists of a 5-minute session of straight road driving at the beginning of the experiment, a 20-minute consecutive-curve road driving to induce motion sickness, and a 10-minute straight road for rest. The experimental scheme is shown in Fig. 2-7.. Motion Sickness Questionnaire Start. Baseline. Motion sickness. Rest. (5-min). (20-min). (10-min). Fig. 2-7. The experimental scheme. 14.
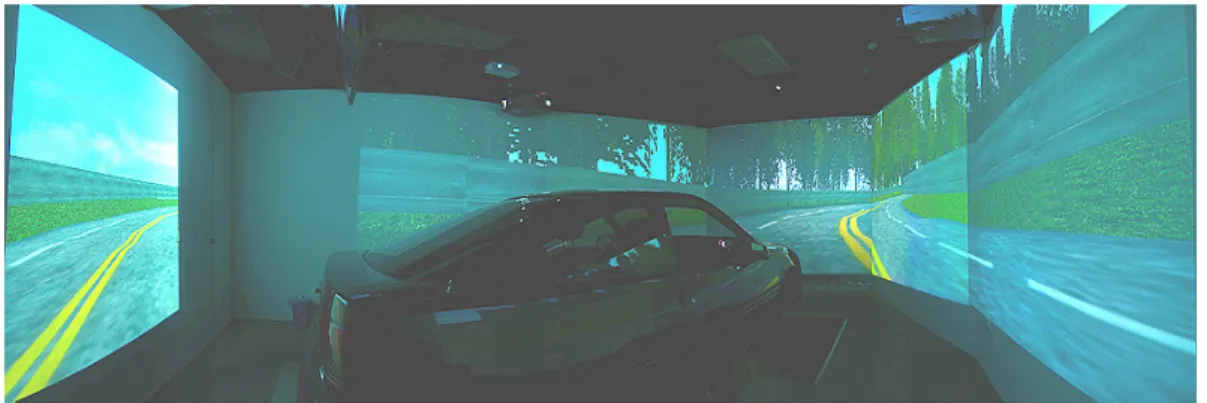
(31) The first 5-min session of each experiment, was regarded as the baseline. It is assumed that the subjects will fall into motion sickness after the 20-min curve road driving session. The physiological signals collected during the “Motion-Sickness” session are then compared with those in the “Baseline” session. We assume that the differences of signals between the two sessions may be induced by motion sickness. The assumption is more impregnable if the differences of signals are vanished in the 10-min “Rest session”. Different from a four-lane street scene used in the study of Min et al. [8], a VR tunnel scene was designed for our experiments. The VR tunnel scene provides shallow depth of the field that is suitable for the purpose of the study since fast movement of objects can induce the motion sickness effectively. In addition, the subjects are asked to answer a motion sickness questionnaire (MSQ) after the navigation of “Motion-Sickness” session as shown in Fig. 2-7 for subjective evaluation of motion sickness. The designed MSQ will be introduced in section 3.1.. 2.3 Virtual-Reality-based Dynamic Driving Environment Some previous works indicated that the malaise of motion sickness can sometimes cause self-control ability decline and lead to serious traffic accident fatalities[27]. For the purpose of safety, a VR-based dynamic driving environment was developed for the motion sickness experiments to mimic realistic stimuli.. Fig. 2-8. A 360-degree 3D VR dynamic driving environment. 15.
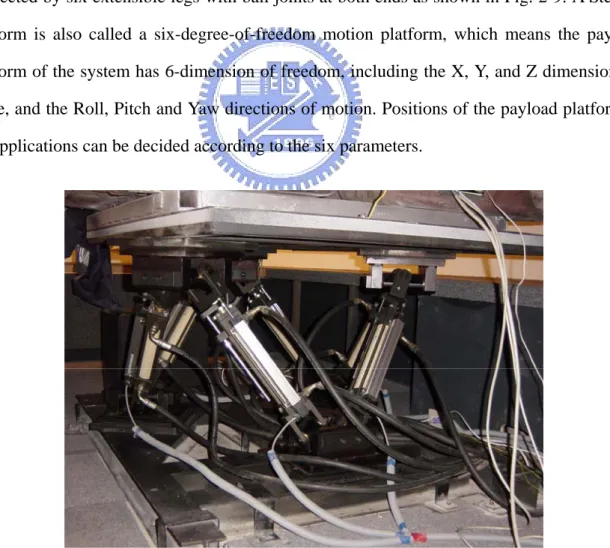
(32) The developed VR dynamical simulation system mainly consists of three elements: (1) a six-degree-of-freedom motion platform, (2) a real car, and (3) an interactive VR scene. The subjects are asked to sit inside the car on the platform with their hands holding the steering wheel to control the car in the VR scene. Seven projectors are used in the experiment to construct a 360-degree 3D scene as shown in Fig. 2-8. The movements of the platform are according to the operation of the subject and the condition of the road surface.. 2.3.1 Stewart Platform A typical Stewart platform has a lower base platform and an upper payload platform connected by six extensible legs with ball joints at both ends as shown in Fig. 2-9. A Stewart platform is also called a six-degree-of-freedom motion platform, which means the payload platform of the system has 6-dimension of freedom, including the X, Y, and Z dimensions in space, and the Roll, Pitch and Yaw directions of motion. Positions of the payload platform in the applications can be decided according to the six parameters.. Fig. 2-9. The Stewart platform in NCTU Brain Research Center. 16.
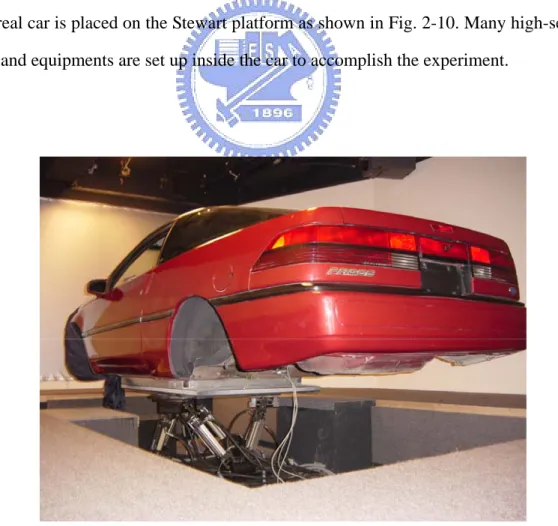
(33) The Stewart platform has excellent performance in position control while comparing with the traditional series manipulator. Non-accumulation of position errors provides high-precision in the operation of platform control. The six extensible legs equally share the loading on the platform, which provide high loading capability in realistic applications. Inverse kinematics analysis is used to treat the problem of converting the position and orientation of the payload platform with respect to the base platform. Excellent possibility of high-speed platform application can be provided because a singular solution of the inverse kinematics can be evaluated by simple formulae [32].. 2.3.2 Apparatus in the Real Car A real car is placed on the Stewart platform as shown in Fig. 2-10. Many high-sensitivity sensors and equipments are set up inside the car to accomplish the experiment.. Fig. 2-10. A real car fixed on the Stewart platform. 17.
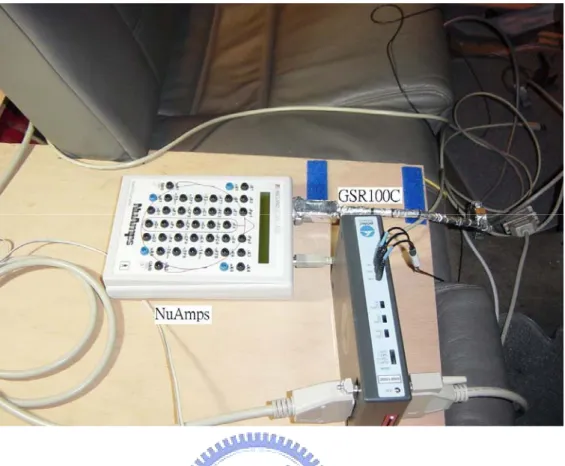
(34) A video camera was placed beside the steering wheel as shown in Fig. 2-11 to capture the movements and facial expression of subjects during the experiments. The operating staff can remotely monitoring the subject in the operation room. The experiments will be terminated by the operating staff immediately when the subject seems unable to continue.. Fig. 2-11. A video camera placed beside the steering wheel.. Two physiological signal amplifiers, NuAmps [47] and GSR100C [48] are also fixed on the car for the purpose of data acquisitions as shown in Fig. 2-12. An EEG electrode cap was mounted the on the subject’s head to record the EEG signals. Four Ag-AgCl electrodes were placed on the chest of subjects to record EKG and EGG signals respectively. The 32-channel EEG, 2-channel EKG and 2-channel EGG signals were collected and enhanced by NuAmps amplifier. The galvanic skin response (GSR) signal was collected at the back of the neck of the subject with two Ag-AgCl electrodes and the recordings were enhanced with the GSR amplifier, GSR100C.. 18.
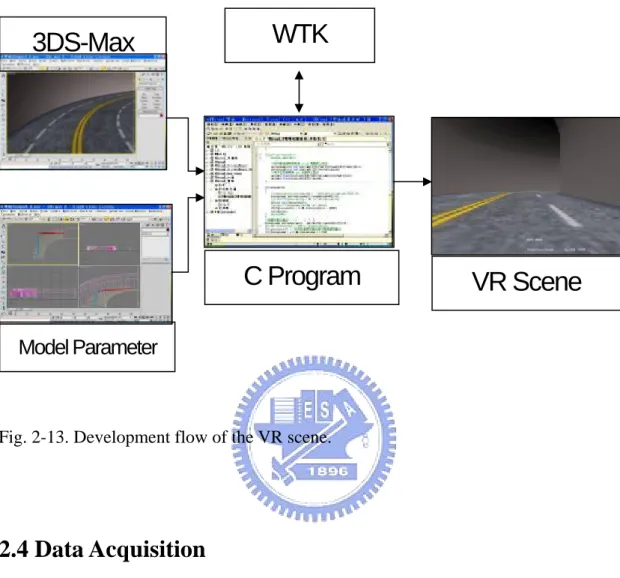
(35) Fig. 2-12. The NuAmps and the GSR100C for physiological signal acquisition.. 2.3.3 Design of the VR Scene For the development of the VR driving scene, the 3DS-max software is used to create the three-dimensional models and the WorldToolKit (WTK) library is used to program the VR scenes. The 3DS-man software is a popular graphic software to create a three-dimensional model. The WTK library is an advanced cross-platform development environment for high-performance, real-time and three-dimensional graphics applications. The development flow of the VR sense is shown in Fig. 2-13. Firstly, the 3DS-max is used to build three-dimensional models accurately for a true system (such as the road) and to define the parameters of each model (such as the width of the road). Then, the C program including the WTK library is used and its library function is called up to move the three-dimensional models.. 19.
(36) 3DS-Max. WTK. C Program. VR Scene. Model Parameter. Fig. 2-13. Development flow of the VR scene.. 2.4 Data Acquisition 2.4.1 Subjects Ten healthy volunteers (including five males and five females) with no history of gastrointestinal, cardiovascular, or vestibular disorders participated in the experiments of the motion sickness study. The ages of these subjects are from 18 to 26 years with a average of 22 years. They were requested not to smoke, drink caffeine, use drugs, or drink alcohol for a week prior to the main experiment to avoid influencing the central and autonomic nervous system.. 20.
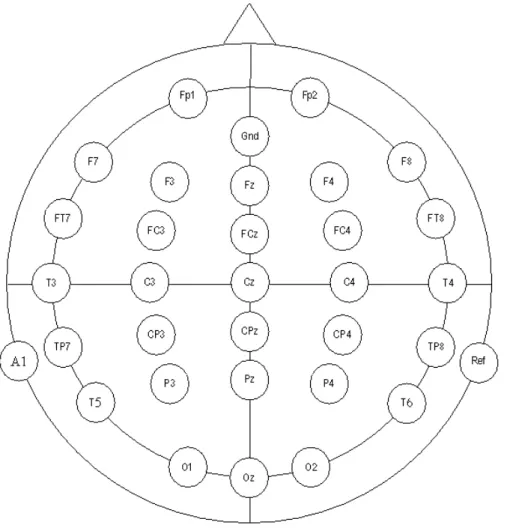
(37) 2.4.2 Data Collection Sensors According to the symptoms of motion sickness discussed in subsection 2.1.2, some physiological signals can be considered as important indices related to the motion sickness. For instance, the galvanic skin response (GSR or skin conductance response) and the Electrogastrography (EGG) are highly related to the symptoms of sweating and vomiting, respectively. The EGG and EKG are the most popular ones used in the studies of motion sickness. Some researches indicated that EEG and EKG are related to the onset of motion sickness directly [7,8].. In this study four different physiological signals including EEG, EGG,. EKG and GSR were recorded simultaneously for further analysis.. 2.4.2.1 Electroencephalogram (EEG) An electrode cap is mounted on the subject’s head for signal acquisitions on the scalp. The 10-20 International System of Electrode Placement standard to place the EEG electrodes proposed by Jasper in 1958 [10], was used in this study. An illustration of the 10-20 system is shown in Fig. 2-14.. Fig. 2-14. The 10-20 international electrode placement system [10].. 21.
(38) The letters F, C, T, P, and O represent the frontal, central, temporal, parietal, and occipital cortical regions on the scalp, respectively. The term “10-20” means 10% and 20% of the total distance between specified skull locations. The percentage-based system allows differences in skull locations. A total of 32 electrodes are used in this system and the top view of the scalp is shown in Fig. 2-15.. Fig. 2-15. The 32 EEG electrodes locations.. The NuAmps, manufactured by NeuroScan Company, is a high-quality 40-channel digital EEG amplifier that is capable of 22 bit sampling at 1000 Hz, measuring signals from. 22.
(39) DC to 260Hz. Table 2-1 shows that the specifications of the NuAmps. The 500 Hz sampling frequency was uesd in this study. Photos of the NuAmps amplifier and the electrode cap are shown in Fig. 2-16.. Table 2-1: NuAmps Specifications NuAmps Specifications Analog inputs. 40 unipolar (bipolar derivations can be computed). Sampling frequencies. 125, 250, 500, 1000 Hz per channel. Input Range. ±130mV. Input Impedance. Not less than 80 MOhm. Input noise. 1 µV RMS (6 µV peak-to-peak). Bandwidth. 3dB down from DC to 262.5 Hz, dependent upon sampling frequency selected. Fig. 2-16. The electrode cap and the EEG signal amplifier. 23.
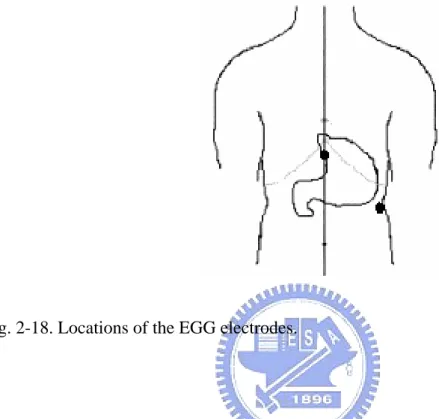
(40) 2.4.2.2 Electrocardiogram (EKG) An electrocardiogram (EKG) is one of the simplest and fastest procedures used to assess the condition of heart. Some researches have demonstrated that EKG is highly related to the symptoms of motion sickness [7]. Two electrodes (small, plastic patches) are placed at certain locations on subject's chest, the placement locations are shown in Fig.2-17. The heart electrical activity of subjects is simultaneous recorded with the EEG signal through the NuAmps amplifier with sampling rate 500 Hz.. Fig. 2-17. Locations of the EKG electrodes on the subject’s chest.. 2.4.2.3 Electrogastrography (EGG) The electrogastrography (EGG) is a non-invasive measurement of stomach activity using surface electrodes positioned over the abdominal surface. Over the past few decades, EGG has been used as an objective measure of nausea experienced in visually induced sickness. EGG has been reported to be a successful indication for the symptoms of motion sickness.. 24.
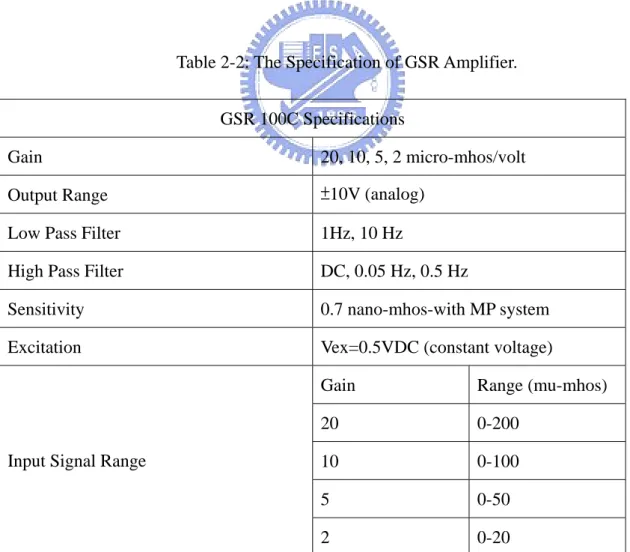
(41) The EGG signals are roughly sinusoidal and typically identified by its slow frequency and low amplitude (between 100 and 500 mV).. Fig. 2-18. Locations of the EGG electrodes.. Bipolar Ag-AgCl electrodes were commonly used because they provide the greatest signal-to-noise ratio in most subjects. The stomach electrical activity in this study is also measured by the NuAmps amplifier with sampling rate 500 Hz. The electrode locations are shown in Fig. 2-18 that were used in Holmes’s study [11]. They suggested that these locations may get largest possible amplitude, lowest artifacts from EKG and body movements.. 2.4.2.4 Galvanic skin response (GSR) The GSR100C sensor and amplifier manufactured by BIOPAC Systems Instruments was used to detect galvanic skin response in this research. The unit is specified to have a gain of 20, 10, 5, or 2 micro-mhos / volt, and a DC excitation voltage of 0.5 V. It contains a hardware low pass filter with an upper cutoff frequency of 1 Hz or 10 Hz to prevent aliasing. It also 25.
(42) contains a hardware high pass filter whit a lower cutoff frequency of DC, 0.05 Hz, or 0.5 Hz to prevent aliasing. The specification of the amplifier is given in Table 2-2. The 6mm Ag-AgCl electrodes were applied with an electrode paste of 0.5 % saline in a neutral base. The electrodes are mounted on the subject’s finger tips are shown in Fig. 2-19 in typical applications. The polyurethane glue is used between the electrodes and skin to improve conductance. However, we placed the GSR electrodes on subjects’ back of neck in our experiments for two reasons: (1) the movements of subjects’ hand while controlling the steering wheel can induce unexpected artifacts; (2) the skin conductance response on the back of neck is more sensitive than that on the finger tips in our experiments. The GSR electrodes setup in the motion sickness experiments is shown in Fig. 2-20. The sampling rate was 30 Hz in our experiment.. Table 2-2: The Specification of GSR Amplifier. GSR 100C Specifications Gain. 20, 10, 5, 2 micro-mhos/volt. Output Range. ±10V (analog). Low Pass Filter. 1Hz, 10 Hz. High Pass Filter. DC, 0.05 Hz, 0.5 Hz. Sensitivity. 0.7 nano-mhos-with MP system. Excitation. Vex=0.5VDC (constant voltage). Input Signal Range. Gain. Range (mu-mhos). 20. 0-200. 10. 0-100. 5. 0-50. 2. 0-20. 26.
(43) Fig. 2-19. Typical set up of galvanic skin response electrodes [48].. Fig. 2-20. Galvanic skin response electrodes setup in our experiments.. 27.
(44) Chapter 3 Assessment of Motion Sickness Symptoms. The symptoms of motion sickness are investigated with the motion sickness questionnaire (MSQ) and multi-stream physiological signals in this chapter. The assessment of both subjective evaluation and physiological responses guarantees the objectivity of motion sickness. The results of subjective evaluation are given in section 3.1, and the results of physiological response are given in section 3.2. Finally, the results of the assessment of both subjective evaluation and physiological responses are given in section 3.3.. 3.1 Subjective Evaluation of Motion Sickness: Motion Sickness Questionnaire (MSQ) Design The famous motion sickness questionnaire (MSQ) developed by Kennedy et al. [12] in 1993 is a commonly used MSQ in the related research field of study. In this study, we also designed a motion sickness questionnaire (MSQ) according to several references for subjective evaluation of motion sickness. Our MSQ composes of 10 items, and each of which has six score levels (0-‘not at all’, 5-‘very much’). The total motion sickness score was the aggregate score of these 10 items. The full range of total motion sickness score was within 0-50 points. The MSQ we designed in this study is shown in Fig. 3-1. The MSQ results and the information of the subjects in our experiment are summarized in Table 3-1. Two subjects (subject 2 and 4) terminated the experiments because of the severe symptoms of motion sickness. Two subjects (subject 6 and 8) claimed they did not feel any symptom of motion sickness. The MSQ score of subject 3 and 9 indicated that they were in a severe motion sickness. The MSQ score served as a subjective method to appraise various states of motion sickness (high or low) in the experiments. 28.
(45) Motion Sickness Questionnaire Experiment Data: __________. Subject No.: __________. 1.Do you feel motion sickness? 0 Not At All. 1. 2. 3. 4. 5 Very Much. 2. 3. 4. 5 Very Much. 2. 3. 4. 5 Very Much. 4. 5 Very Much. 2.Are your eyes feeling tired and sore? 0 Not At All. 1. 3.Can you focus on the object? 0 Not At All. 1. 4.Do you have any pain in your head at the moment? 0 Not At All. 1. 2. 3. 5.Are you feeling tired or sleepy? 0 Not At All. 1. 2. 3. 4. 5 Very Much. 3. 4. 5 Very Much. 2. 3. 4. 5 Very Much. 2. 3. 4. 5 Very Much. 2. 3. 4. 5 Very Much. 3. 4. 5 Very Much. 6.Are you feeling dizzy when you eyes open? 0 Not At All. 1. 2. 7.Are you feeling dizzy when you eyes close? 0 Not At All. 1. 8.Do you feel off-balance? 0 Not At All. 1. 9.Do you feel vomitous? 0 Not At All. 1. 10.Do you feel queasy in your stomach? 0 Not At All. 1. 2. Fig. 3-1. Motion Sickness Questionnaire (MSQ) designed in this study.. 29.
(46) Table 3-1: The results of MSQ. Subject. Date(yy/mm/dd). Age. Gender. MSQ Score. Subject 1. 2005/03/25. 22. Female. 17/50. Subject 2. 2005/04/12. 18. Male. X. Subject 3. 2005/04/13. 22. Female. 28/50. Subject 4. 2005/04/13. 26. Male. X. Subject 5. 2005/04/13. 22. Female. 11/50. Subject 6. 2005/04/22. 22. Female. 8/50. Subject 7. 2005/04/26. 23. Male. 17/50. Subject 8. 2005/05/02. 22. Female. 5/50. Subject 9. 2005/05/09. 21. Male. 34/50. Subject 10. 2005/05/17. 24. Male. 12/50. 3.2 Physiological Responses induced by Motion Sickness In this study, the EEG changes correlated to motion sickness will not only refer to the MSQ score, but the objective indices should also be involved for systematic evaluation. The physiological signals recorded for objective motion sickness assessment included electrocardiogram (EKG), electrogastrography (EGG) and galvanic skin response (GSR).. 3.2.1 EKG changes during Motion Sickness The electrical activity of the heart can be recorded at the surface of the subject’s chest using an electrocardiogram (EKG). The EKG is simply a voltmeter that uses up to two electrode wires with gel patches placed on designated areas of the body. The EKG dominant frequency of a normal adult is around 1 to 1.6 Hz in a relax situation. However, we can expect. 30.
(47) that the EKG dominant frequency will increase in some special conditions, such as motion sickness. A typical spectral changes of EKG dominant frequency during our experiment are shown in Fig. 3-2.. Fig. 3-2. A typical spectral changes of EKG dominant frequency during our experiment (subject 1).. According to Fig. 3-2, in the “Baseline” session, the dominant frequency was 1.05 Hz with the magnitude of 60-dB, which means 63 cpm of heart rate (1.05 Hz * 60 s = 63 cpm). The dominant frequency shifted to 1.3 Hz in the “Motion-Sickness” session, which means 78 cpm of heart rate (1.3 Hz * 60 s = 78 cpm). The results indicate that the subject’s heart rate 31.
(48) may change when they are in motion sickness. The variations of the EKG dominant frequency of all subjects during the three sessions: “Baseline”, “Motion-Sickness” and “Rest” in the experiments are summarized in Table 3-2 and Fig. 3-3.. Table 3-2: EKG dominant frequency (Hz) variations of different subjects in the three different sessions.. Subject. Baseline. Motion-Sickness. Rest. Subject 1. 1.05. 1.3. 1.1. Subject 3. 1.15. 1.25. 1.15. Subject 5. 1.3. 1.5. 1.3. Subject 6*. 0.95. 0.95. 0.95. Subject 7. 1.25. 1.3. 1.3. Subject 8*. 1.4. 1.4. 1.2. Subject 9. 1.1. 1.25. 1.1. Subject 10. 1.2. 1.4. 1.2. * No distinguish able difference between the “Baseline” and “Motion-Sickness” sessions. Some EKG analysis results show no distinguish able difference between the “Baseline” and “Motion-Sickness” sessions such as the results of subjects 6 and 8. For subjects 1, 3, 5, 7, 9 and 10, a 0.05 Hz to 0.2 Hz raise of EKG dominant frequency can be found in “Motion-Sickness” sessions compared with the “Baseline” sessions. Some of these subjects could be proved that they could recover from the symptoms of motion sickness after the 10-min “Rest” session by the evidence that the EKG dominant frequency shifted back to the state as “Baseline” session.. 32.
(49) EKG Dominant Freq. (Hz). Fig. 3-3. Variations of the EKG dominant frequency.. According to Fig. 3-3, EKG changes can be regarded as a good index of motion sickness for subjects 1, 3, 5, 9 and 10. However, EKG is easy to be influenced by many other factors according to some researches [36].. 3.2.2 EGG Changes during Motion Sickness Electrogastrography (EGG) is a method of recording stomach electrical activity from electrodes placed on the abdominal surface. The EGG signals are roughly sinusoidal and typically identified by its slow frequency and low amplitude (between 100 and 500 mV). It was reported that the myoelectrical activities originate from the pacemaker region located at the upper half of the gastric body and migrate aborally towards the duodenum through the gastric body and the antrum. EGG has been used as an objective measure of epigastric. 33.
(50) symptoms and nausea during motion sickness for more than 10 years [39]. EGG has been reported to be a successful indication for motion sickness by Hu et al. [13], Uijtdehaage et al. [14] and Xu et al. [15]. In addition, it has been reported that EGG is a reliable measure of motion sickness [16]. The EGG-activity in a normal condition is 3 to 6 cpm of a healthy adult which means 0.05 Hz to 0.1 Hz. The increased activities of EGG will be induced by the symptoms of nausea or vomiting. On the rest time after motion sickness, subjective symptoms of motion sickness should subside, and then the severity of gastric symptoms will expected to be reduced over time as well. The variations of the EGG dominant frequency for different subjects in the three sessions: “Baseline”, “Motion-Sickness” and “Rest” are summarized in Table 3-3 and Fig. 3-4.. Table 3-3: EGG dominant frequency (Hz) variations of different subjects in the three different sessions. Subject. Baseline. Motion-Sickness. Rest. Subject 1. 0.09. 0.15. 0.09. Subject 3. 0.09. 0.15. 0.12. Subject 5. 0.09. 0.15. 0.12. Subject 6. 0.09. 0.12. 0.09. Subject 7. 0.09. 0.12. 0.09. Subject 8. 0.09. 0.09. 0.09. Subject 9. 0.06. 0.12. 0.09. Subject 10. 0.09. 0.15. 0.09. 34.
(51) EGG Dominant Freq. (Hz). Fig. 3-4. Variations of the EGG dominant frequency.. Some EGG analysis results show distinguish able differences between the “Baseline” and “Motion-Sickness” sessions, which indicate the increase gastric activities. The increase of gastric activities is sometimes the direct reason of gastralgia, and highly related to the symptoms of motion sickness. An evident shift of EGG dominant frequency is found in session “Motion-Sickness” of majority subjects. Some of these subjects could be proved that they could recover from the symptoms of motion sickness after the 10-min “Rest” session by the evidence that the EGG dominant frequency shifted back to the state as “Baseline” session. According to Fig. 3-4, EGG changes can be regarded as a good index of motion sickness for most of the subjects.. 3.2.3 GSR Changes during Motion Sickness The galvanic skin response (GSR) is a simple, useful and reproducible method of capturing the autonomic nerve response as a parameter of the sweat gland function [49]. It is the conductance of the skin to the passage of a very small electric current. Physically GSR is a 35.
(52) change in the conductance of the skin in response to different kinds of stimuli. Any stimulus capable of an arousal effect can evoke the response of GSR changes and the amplitude of the response is more dependent on the surprise effect of the stimulus than on the physical stimulus strength [50]. It has been known for decades that the magnitude of this electrical conductance is affected, not only by the subject's general mood, but also by immediate emotional reactions [51]. In measurements changes in the voltage measured from the surface of the skin are recorded. The GSR or skin conductance will increase when the subject is sweating. Sweating is one of the important symptoms of motion sickness, so one can expect some distinguish changes in the GSR signal. A typical changes of GSR during our experiments are given in Fig.3-5.. Fig. 3-5. The GSR of subject 7.. 36.
(53) A 10-second moving average filter was applied to the recoded GSR signals. The blue line in Fig. 3-5 is in the duration of “Baseline” session (i.e. straight road), the red line is the “Motion-Sickness” session (i.e. consecutive-curve road), and the green line represent the “Rest” session (i.e. straight road). Firstly, the skin conductance is about 4 μ-mho in the “Baseline”, and then becomes about 11μ-mho in the “Motion-Sickness”. Finally, the skin conductance is 8μ-mho in the “Rest” session. However, similar to Min’s study [8] GSR signals of majority subjects have no distinguish able changes during the experiments, as shown in Fig. 3-6. However, the individual difference between subjects is large, and the signals can only to used for the subjects who sweat during motion sickness. GSR changes can be regarded as a good index of motion sickness only for subject 7 and 10. The GSR changes of subject 7 is shown in Fig. 3-5. The analysis of the GSR signals is that a moving average filter in time domain is used for analysis of motion sickness. So, it is an instantaneous physiological index for the real-time experimental monitoring.. Fig. 3-6. The GSR of subject 1. 37.
(54) 3.3 Assessment of Motion Sickness Symptoms with Subjective Evaluation and Physiological Responses The MSQ has served as a subjective index of motion sickness in many previous researches. However, it is an arbitrary assessment method which can be too subjective for scientific studies. Both subjective and objective evaluations are used in our study for the systematic motion sickness estimation. Table 3-4 is the performance comparison of different motion sickness indices we investigate in this study.. Table 3-4: Variation performance comparison of different motion sickness indices.. Dominant Frequency. MSQ Subject. GSR Score. EKG. EGG. Subject 1. 17/50. 1.05 (Hz) → 1.3 (Hz). 0.09 (Hz) → 0.15 (Hz). X. Subject 3. 28/50. 1.1 (Hz) → 1.2 (Hz). 0.09 (Hz) → 0.15 (Hz). X. Subject 5. 11/50. 1.3 (Hz) → 1.5 (Hz). 0.09 (Hz) → 0.15 (Hz). X. Subject 6. 08/50. 0.9 (Hz) → 0.9 (Hz). 0.09 (Hz) → 0.12 (Hz). X. Subject 7. 17/50. 1.2 (Hz) → 1.3 (Hz). 0.09 (Hz) → 0.12 (Hz). O. Subject 8. 05/50. 1.4 (Hz) → 1.4 (Hz). 0.09 (Hz) → 0.09 (Hz). X. Subject 9. 34/50. 1.1 (Hz) → 1.25 (Hz). 0.06 (Hz) → 0.12 (Hz). X. Subject 10. 12/50. 1.2 (Hz) → 1.4 (Hz). 0.09 (Hz) → 0.15 (Hz). O. 38.
(55) According to Table 3-4, for subject 1, 17 points of MSQ score refers to mild sickness in the subjective assessment. The EKG dominant frequency shifted from 1.05 Hz to 1.3 Hz, and the EGG dominant frequency shifted from 0.09 Hz to 0.15 Hz in “Motion-Sickness” session. Although there is no able distinguish change in the GSR response, subject 1 was selected for the further EEG signals analysis.. Fig. 3-7. The comparison results of both subjective evaluation and physiological responses.. The MSQ scores of subject 3 and subject 9 are 28 and 34, respectively, which indicate severe sickness in the subjective assessment. By contrast, the MSQ score of subject 6 and subject 8 are only 8 and 5, respectively. The MSQ score lower than 10 ponits in our experiment is considered as indistinct-sickness in the subjective assessment. For objective. 39.
(56) indices, EKG, EGG and GSR, if more than two of the three indices have significant changes, the subject is considered as a subject with motion sickness in the experiment. The normalized scores of subjective and objective indices of different subjects are shown in Fig. 3-7. The EKG and EGG scores show the normalized signal differences between the “Baseline session” and the “Motion-Sickness session” for different subjects. The three curves in Fig. 3-7 are highly related to each other. It shows strong evidence to the validity of the indices such that we can study the EEG changes related to motion sickness base on these results. More details are discussed in the next chapter.. 40.
(57) Chapter 4 Analysis Results of EEG Response during Motion Sickness. The EEG data analysis is based on the cross-demonstrations of subjective evaluation and physiological responses to ensure the objectivity of sickness assessment. The EEG signals analysis procedure is given in section 4.1, and the relationship between the power spectrum of ICA components and motion sickness is given in section 4.2. Finally, the results of spectrum ICA component dynamic changes are given in section 4.3.. 4.1 EEG Signal Analysis Procedure Flowchart of the EEG signal processing procedure is show in Fig. 4-1. The 32-ch EEG data was collected through an electrode cap and amplified by the NuAmps. The sampling rate of the EEG data is 500Hz. It consists of artifacts removal, independent component analysis, useless component rejection, spectral analysis, nausea-related components selection and dynamic spectral analysis. A 500-pt high pass filter with a cut-off frequency at 1 Hz is used to remove breathing artifacts. The width of the transition band of the high pass filter is 0.2 Hz. A 30-pt low pass filter is then applied to the signal with the cut-off frequency at 50 Hz to remove muscle artifacts and line noise. The transition band width of the low pass filter is 7 Hz. The independent component analysis (ICA) is applied to the filtered EEG signals to obtain the independent components. Some artifacts can be rejected in the process of useless components rejection. The effectiveness of eye blinking and other artifacts removal by using ICA had been 41.
(58) demonstrated in the Jung et al.’s study [17]. The spectral analysis is then applied to the useful independent components to calculate their frequency response. The detailed introduction of the algorithm is given in subsection 4.1.1. The feature of the motion sickness symptoms can be evaluated by the selection of nausea-related components. And finally, the continuous frequency responses of the ICA components are evaluated with dynamic spectral analysis.. Fig. 4-1. Flowchart of the EEG signal analysis procedure.. 42.
(59) 4.1.1 Independent Component Analysis The joint problems of EEG source segregation, identification, and localization are very difficult since the EEG data collected from any point on the human scalp includes activity generated within a large brain area, and thus, problem of determining brain electrical sources from potential patterns recorded on the scalp surface is mathematically underdetermined [19]. Although the resistivities between the skull and brain are different, the spatial smearing of EEG data by volume conduction does not involve significant time delay and suggests that the ICA algorithm is suitable for performing blind source separation on EEG data by source identification from that of source localization. We attempt to completely separate the twin problems of source identification and source localization by using a generally applicable ICA. Thus, the artifacts including the eye-movement (EOG), eye-blinking, heart-beating (EKG), muscle-movement (EMG), and line noises can be successfully separated from EEG activities. The ICA is a statistical “latent variables” model with generative form:. x( t ) = A s( t ) ,. (1). where A is a linear transform called a mixing matrix and the S i are statistically mutually independent. The ICA model describes how the observed data are generated by a process of mixing the components S i . The independent components S i (often abbreviated as ICs) are latent variables, meaning that they cannot be directly observed. Also the mixing matrix A are assumed to be unknown. All we observed are the random variables xi , and we must estimate both the mixing matrix and the ICs S i using the xi . Therefore, given time series of the observed data x(t ) = [ x1 (t ) x 2 (t ) ⋅ ⋅ ⋅ x N (t )]T in. N-dimension, the ICA is to find a linear mapping W such that the unmixed signals u(t) are statically independent. u( t ) = W x( t ) ,. (2). Supposed the probability density function of the observations x can be expressed as:. 43.
數據
![Fig. 2-6. The virtual reality scene of Min’s experiments [8].](https://thumb-ap.123doks.com/thumbv2/9libinfo/8129239.166175/29.892.309.670.801.1087/fig-virtual-reality-scene-min-s-experiments.webp)
+7
相關文件
印度嘟嘟車駕駛賈維德.汗(Mohammad Javed Khan)看到民眾因負擔不起約新 台幣 1891 元到
近年科技業工程師、客運業駕駛、保全人員及醫療機構醫師等接連發
煞停距離:駕駛者從黃燈始亮 到決定煞車,且安全緩和的停
• 一般的內燃機 (Internal combustion engine) 因為行駛狀況差異,很
將建議行車路線、車輛狀態等 資訊投影於擋風玻璃 ,創造猶如科 幻電影一般的虛擬檔風玻璃系統所整合。在以液晶螢幕彌補視覺死角
• A delta-gamma hedge is a delta hedge that maintains zero portfolio gamma, or gamma neutrality.. • To meet this extra condition, one more security needs to be
在軟體的使用方面,使用 Simulink 來進行。Simulink 是一種分析與模擬動態
The first stage is to accuse five illegal driving behaviors that include driving on freeway shoulder, without keeping safety spacing, illegal lane change, slowing vehicle driving
