國
立
交
通
大
學
分子醫學與生物工程研究所
碩
士
論
文
幽門螺旋桿菌之熱休克蛋白 60 可藉由乙型轉化生長因
子訊息傳遞路徑抑制週邊血液單核球細胞之增生
Helicobacter pylori-derived Heat Shock Protein 60 Induce the Decrease
in the Proliferation of Peripheral Blood Mononuclear Cells and the
Increase in Treg Cells via TGF-ß signaling pathway
研 究 生:徐維瞳
指導教授:廖光文 教授
幽門螺旋桿菌之熱休克蛋白 60 可藉由乙型轉化生長因子訊息傳遞
路徑抑制週邊血液單核球細胞之增生
Helicobacter pylori-derived Heat Shock Protein 60 Induce the Decrease
in the Proliferation of Peripheral Blood Mononuclear Cells and the
Increase in Treg Cells via TGF-ß signaling pathway
研 究 生:徐維瞳 Student:Wei-Tung Hsu 指導教授:廖光文 Advisor:Kuang-Wen Liao 國 立 交 通 大 學 生物醫學所 碩 士 論 文 A Thesis
Submitted to Institute of Molecular Medicine and Bioengineering National Chiao Tung University
in partial Fulfillment of the Requirements for the Degree of
Master in
Molecular Medicine and Bioengineering
January 2010
Hsinchu, Taiwan, Republic of China
Helicobacter pylori-derived Heat Shock Protein 60 Induce the Decrease in the
Proliferation of Peripheral Blood Mononuclear Cells and the Increase in Treg Cells via TGF-ß signaling pathway
Student: Wei-Tung Hsu Advisor: Dr. Kuang-Wen Liao Institute of Molecular Medicine and Bioengineering
National Chiao Tung University Abstract
Helicobacter pylori can lead to variety of upper gastrointestinal disorders such as chronic
gastritis, peptic ulcer disease, gastric mucosa- associated lymphoid tissue (MALT) lymphoma and gastric cancer. Without treatment, H. pylori would become chronic infection in almost all of those patients. Although the virulent factors of H. pylori such as CagA, VacA have been demonstrated to play roles in H.pylori colonization and persistent infection, not all the strains isolated form clinic carry those virulent factors. Thus, the universal mechanism of the chronic infection for all stains of this pathogen still is unclear. Maybe, certain factor(s) is involved in this immunosuppressive mechanism, which is necessary to be explored.
Interestedly, researchers found that Heat shock protein 60 (Hsp60) seems to be related to the regulation of immune responds in chronic infection disease. Literatures indicated that Hsp60s in C. albicans or M. tuberculosis can induce persistent colonization in the murine experimental model. Therefore, the Hsp60 of H. pylori was considered that it may be an immunosuppressive factor. In this study, we investigated the role of H. pylori Hsp60 (HpHsp60) in immunosuppression. The results showed that the treatment with HpHsp60 to human peripheral blood mononuclear cells (PBMCs) decreased the proliferation rate, changed the cytokine secretion profile, and induce cell cycle arrest. Intracellular FoxP3 staining showed the regulatory T cells were increased after HpHsp60 treatment. Furthermore, TGF-ß signaling pathway is shown to be involved in the generation of HpHsp60-induced Treg cells. Taken together, the treatment of HpHsp60 might generate the regulatory T cells and thus help
幽門螺旋桿菌之熱休克蛋白 60 可藉由乙型轉化生長因子訊息傳遞路
徑抑制週邊血液單核球細胞之增生
研究生:徐維瞳 指導教授: 廖光文 博士 國立交通大學分子醫學與生物工程研究所 中文摘要 幽門螺旋桿菌的感染與許多上消化道的疾病相關,像是慢性胃炎、消化性潰瘍、黏 膜相關淋巴組織淋巴癌(MALT lymphoma)以及胃癌。感染幽門螺旋桿菌患者若無以抗生素 加以治療,將轉變為慢性、持續性感染;而上述疾病的發生責主要起因於該病源菌的慢性 感染。 因此幽門螺旋桿菌在胃部造成慢性感染機制是一重要研究課題。 在過去的研究中, 許多幽門螺旋桿菌的毒性因子(virulence factors)都曾被報導與該病源菌在胃部的慢性 感染相關,像是 CagA、VacA 等等。然而,並非每一臨床上所分離之菌株都具備這些毒性因 子的基因,或能製造具有功能性的蛋白質。因此,造成幽門螺旋桿菌在位部慢性感染真正 的機制仍有待探討、釐清。 在另一方面,近年來有許多研究指出,熱休克蛋白 60 似乎在人體免疫系統抵禦病源 菌慢性感染的過程中扮演調節的角色。例如,披衣菌( C. albicans) 及肺結核桿菌 ( M. tuberculosis) 來源之熱休克蛋白 60 都曾在老鼠實驗模式中被證實與該病源菌所引發的 慢性感染相關。因此我們認為,幽門螺旋桿菌來源之熱休克蛋白 60(HpHsp60)可能是幽門 螺旋桿菌用以逃脫免疫攻擊,甚或抑制免疫反應的一個重要分子。在本篇研究中,我們利 用人類週邊血液單核球(human peripheral blood mononuclear cells, PBMCs)作為研究 系統,探討 HpHsp60 對其活化、增生所造成之影響。研究結果顯示,HpHsp60 能夠降低 PBMCs 之增生、影響細胞激素表現以及造成細胞週期的停滯;透過細胞內 FoxP3 分子之染色,發 現 HpHsp60 可能是藉由引發調控型 T 細胞(regulatory T cells) 的增生而造成對 PBMCs 生長抑制。而 HpHsp60 則是藉由非傳統之 TGF-ß 訊息傳遞路徑誘發調控型 T 細胞的產生。 根據上述研究結果,我們認為幽門螺旋桿菌來源之熱休克蛋白 60 能夠藉由誘發調控型 T 細 胞之增生來幫助幽門螺旋桿菌逃脫免疫攻擊,在胃部造成慢性感染。誌謝 提筆要開始寫誌謝的時候,才驚覺時光荏苒,碩士班兩年的生活即將要隨著論文的付 梓而結束。雖然我的研究生生活仍然要繼續,但是在這兩年中,的確有許多讓我感謝的人、 事,存留在我的心裏,值得我用這短短篇幅的謝誌紀錄下來。 首先要感謝我的指導教授廖光文博士,引領我進入學術研究的殿堂。謝謝老師一 再的諄諄教誨:“我希望你們將來比我更好“,警策我們求進步。兩年的時間裏從老師身上 看到作為一位科學家須有的嚴謹邏輯與智慧的思維,實在使學生受益匪淺。也感謝百忙之 中抽空參與口試的朱瑞民教授、黃憲達教授、鄭添祿教授、吳彰哲教授、蔡女滿教授,謝 謝老師們在學生的研究主題上給予的指導與建議,以及在口試後餐會中所分享在研究這條 路上的經歷。2009 年 12 月 30 日,我想應該是我人生中值得紀念的一個日子;不僅是因為 我完成了碩士學位的口試,更是因為這幾位在學術上、人生歷練上都值得學生欽佩的老師 們,教給了我最重要的功課。 在實驗室的日子也是讓我回味的。作為我實驗的啓蒙者,要謝謝靜宜學姐給與的 指導和許多時候願意放下手邊的事與我討論實驗設計和結果。作為我並肩作戰的夥伴,親 愛的筱薇,我想誌謝的最大篇幅應該是給你的,如同你曾經告訴我:沒想到在研究所的時 候還能認識好朋友—我們的友誼值得一輩子的珍惜。同為碩二的靜敏和馬馬,謝謝你們溫 暖的關心和你們的每一個笑容。還有在實驗室經過的每一位前輩後生:鈺珊學姊、于鈴學 姐、DG、James、RT、Chenyu、小護士、阿伯、筑婷、何姵、小溫、小莉、雙雙 、小美、 欣怡 ,不論與你們共事的時間是長或短,都要謝謝你們曾經給過我的鼓勵和祝福。 兩年的碩士生涯將近,我也準備前往下一個人生的站口;謝謝我的父母在這二十多 年的時間裏對我無盡的照顧,讓我能沒有後顧之憂的求學、深造。盼望無論時間有多少, 我都能陪在他們身邊,也叫他們以我為傲。最後要將感謝獻給愛我的主耶穌,願我的一生 被祂得著,成為祂手中有用的器皿。 2010/01/15 維瞳
Contents
Abstract ....……….…………..…i Acknowledgement...iii Contents ……….………iv Introduction………..………1 Helicobacter pylori………1Virulent factors of H. pylori that suppress human immune response……….2
Heat shock protein 60……….………3
Regulatory T cell……….4
Materials and Methods……….………6
Materials Reagent, Antibody, Kit, Instrument, Others…………..……….………...……6-8 Methods Expression and purification of rHpHsp60 protein ……….9
Peripheral blood mononuclear cells (PBMCs) Isolation……...………...10
Cell culture………...……....11
PBMC proliferation assay……….………...…....12
Human cytokine antibody array………..………...12
Cell surface marker staining……….………...13
Cell cycle….………..………...14
Annexin V-FITC/PI apoptosis assay……..….………...14
Cell-dependent experiments……….………15
FoxP3 intracellular staining………….………..………...16
RNA isolation………...………17
Reverse transcription………...…….18
Real-time PCR……….…...………..18
Statistical analysis………….……….……...20
Results………...21
The effects of HpHsp60 on PBMCs proliferation and cytokine expressions……....21-22 HpHsp60 inhibits PBMCs proliferation through inducing cell cycle arrest but not apoptosis……….………...…..22-23 HpHsp60 inhibits PBMCs proliferation through a cell-dependent manner…………23-25 TGF-ß signaling pathway is involved in the induction of Treg and the proliferative inhibition of PBMCs………...25-26
Discussion………....27 Figure and Legend……….….32
List of Figure and Legend
Figure and Legend
Figure 1. Treatment with HpHsp60 to PBMCs decreases the proliferation in the present of
anti-CD3 antibody………...………..…………32
Figure 2. The treatment of HpHsp60 altered the cytokine expression profile of activated PBMCs………...………34
Figure 3 T cell population is the major target of HpHsp60 in their proliferation inhibition function………...36
Figure 4. HpHsp60 induces cell cycle arrest at G0/G1 phase ………...38
Figure 5. HpHsp60 dose not induce PBMC apoptosis………….………..40
Figure 6. The inhibition is through a cell-dependent manner….………42
Figure 7. The inhibition is not through a supernatant-dependent manner………...44
Figure 8. T cell percentage of HpHsp60-treated PBMCs………..……46
Figure 9. Treatment with HpHsp60 increases the percentage of regulatory T cell………47
Figure 10. TGF-ß signaling pathway may be involved in the proliferative inhibition…………...49
Figure 11. TGF-ß signaling pathway is involved in the generation of HpHsp60-induced Treg cells……….51
Figure 12. TGF-ß signaling pathway may be involved in the proliferative inhibition caused by HpHsp60-induced Treg cells………..…52
Introduction
1. Helicobacter pylori (H. pylori)
H. pylori was first isolated by Warren and Marshall in 1982 [1]. It is a Gram-
negative, spiral-shaped, microaerophilic bacterium. The bacterium will survive briefly when exposure to pH< 4, but grows only at the relatively narrow pH range of 5.5 to 8.0, with optimal growth at neutral pH. Epidemiology studies show that over half of world population is infected with this organism [2]. World Health Organization classified this pathogen as type I carcinogen in 1994. Chronic infection of H. pylori is associated with variety of upper- intestinal diseases such as chronic gastritis, peptic ulcer diseases; gastric mucosa- associated lymphoid tissue (MALT) lymphoma and gastric cancer [3-5].
Gastric mucosal biopsies from patients reveal an increased concentration of various types of immune cells, such as neutrophils, monocytes, macrophages, dendritic cell and lymphocytes [6-8]. This indicates H.pylori surely induce a host immune response. Of interest, CD4+T cells are typically more abundant than CD8+T cells in the infiltration area [9-10]. Several studies have noted that the T helper cell response to H. pylori is polarized, since the cytokines in the gastric
mucosa of infected individuals that produced by CD4+ T cells are the Th1 cytokines, interleukin-12 and interferon-gamma [11-12].
Although H.pylori induces a host immune response, the persistence of the infection suggests that the response is not effective. Furthermore, multiple lines of evidence suggest that the immune response contributes to the pathogenesis associated with the persistent infection. Thus, how H.pylori escape the immune attack to colonize in the gastric mucosa and cause the chronic inflammation is an important question remained to be investigated.
2. Virulent factors of H. pylori that suppress human immune response
Variety of virulence factor that derived from H. pylori has been proven to associate with immune evasion, including CagA, VacA, arginase. CagA can inhibit B lymphocyte proliferation through suppressing the JAK-STAT signaling [13] and it is also responsible for the inhibition of T cell proliferation [14]. Furthermore, CagA affects T lymphocyte differentiation by reducing the expression of IL4 mRNA [15]. VacA is a more powerful virulence factor for immunosuppression because it can not only inhibit lymphocyte proliferation but also affect their normal function. VacA can inhibit the processing of antigen in B cell, block il-2 gene expression in T cell and cause cell cycle arrest in PBLC (peripheral blood
competing the substrate of NO synthase, thus escape the intracellular killing of macrophage [18]. Other factors such as flagella, LPS etc. are also shown to have contribution to the immune evasion of H. pylori [19-20].
However, there are some conflicts. CagA can be isolated from only 60% of clinical H. pylori strains that cause persistent infection [21]. Only 50% of H. pylori strains can secrete functional VacA protein, although almost every H. pylori strains carry VacA gene [22]. Furthermore, some researches show that VacA-knockout strains of H.pylori do not have any deficiency in inhibiting T-cell proliferation [23-24]. Other possible immune modulators like flagella and arginase can only defense against the innate immunity but not the adaptive immune response. Thus, if there is any possible mechanism or universal immune modulator factor to evade the host immune system remains to be investigated.
3. Heat shock protein 60
Heat shock proteins (Hsps) are the stress-inducible proteins that distribute widely in the natural and have been shown to be a highly conserved molecule in both prokaryotic and eukaryotic cells. According to molecular weight, HSPs are classified into Hsp100, Hsp90, Hsp70, Hsp60, Hsp40 and small Hsps (Hsp10). Hsps are initially indicated as molecular chaperon [25]. However, evidence is
recently [26]. Hsp60 derived from some pathogens have been identified with immunosuppressive abilities: C. trachomatis, M. tuboclusis [27-28]. According to the literatures, Hsp60 of H. pylori has been demonstrated it is expressed on surface of the bacterium [29] and recognized by TLR-4 or TLR-4, thus interact directly with immune cells and cause mainly inflammatory responses [30-31]. However, our lab’s previous data have shown that it may have the immunomsuppressive properties since it can induce THP-1, a human macrophage cell line, to produce the suppressive cytokines interlukin-10 and TGF-beta [32].
4. Regulatory T cell
Regulatory T cells (Tregs) constitute about 7%–15% of peripheral CD4 T cells and function in suppressing autoimmune response to self-antigen, or down regulating of excessive immune responses to the pathogens that are deleterious to the host. They are initially characterized by high level of surface expression of CD25 [33]. In 2003, Foxp3, a forkhead family transcription factor, was found to have the critical roles in regulation of Treg development, function, and homeostasis [34-36]. Recent studies on both mouse and human model have shown that numbers of CD4+CD25+ Foxp3+ regulatory T cells (Tregs) were increased in the H. pylori-infected area and involved in the suppressive of immune response to H. pylori
[37-However, the mechanism how dose the Treg be triggered to increase is unclear.
In the study, PBMC isolated from healthy human was examined their responses to the HpHsp60. The immunosuppressive ability of HpHsp60 was confirmed by monitoring the proliferation and cytokine expression in this study. According the results, we suggested HpHsp60 cause the proliferative inhibition by interfering with the cell cycle but not inducing apoptosis. In addition, HpHsp60 also increase the population of Treg cells in PBMC. Thus, the immunosuppressive activity of HpHsp60 may result from the generation of Treg cells in PBMC.
Material and Method
Materials
1. Reagent
The following reagents and chemicals were obtained as indicated: RPMI1640, Fetal Bovine Serum (FBS), Tryzol from Invitrogen (Gaithersburg, MD, USA). Penicillin/ Strreptomycin/ Amphotericin (PSA) from Biological industries (Beithaemek, Israel). DNA agarose, Tryptone from MDBio Inc.(Rockville, MD, USA).Isopropyl-beta-D-thiogalactopyranoside (ITPG), Sodium chloride (NaCl), Yeast extract and imidazole from Amresco (Solon, OH, USA). Ficoll- paquePlus from GE healthcare (Uppsala,Sweeden). Sephadex G-25 Medium from Amersham Bioscciences (Uppsala, Sweeden). Propidium iodide (PI), RNase A, and Thiazolyl blue tetrazdium bromide (MTT), Ammonium persulfate (APS), Sosium dodecyl sulfate (SDS) Developer, fixer, SB431542 and SIS3from SIGMA-ALDRICH (Steinheim, Germany). EDTA and chloroform from TEDIA (Fairfield, OH, USA). H3PO4, KH2PO4, Na2HPO4, Tween 20, MgCl2
Kogyo Co., Ltd., Tokyo, Janpan). Coomassie Plus reagent (Thermo Scientific, Rockford, IL, UAS). Isopropanol (ECHO Chamical, Miaoli, Taiwan). Tris-HCl and Triton X-100 (Amresco Inc., OH, USA). Recombinant human interleukin-2 (rhIL2) was kindly provided from Dr. Steve R. Roffler (Institute of BioMedical Sciences, ACADEMIA SINCA). Recombinant green fluorescence protein was kindly provided from Dr. Chia-Ching Chang (Department of Biological Science and Technology, National Chiao Tung University).
2. Antibody
The following antibodies were obtained as indicated: Rabbit anti-mouse IgG-FITC from Novus Biological, Inc. (Littleton, CO, USA). Mouse anti-human CD4-FITC (RPA-T4) from Biolegend (Sandiego, CA, USA). Mouse anti-human FoxP3-PE (259D/C7) from BD Biosciences (Bedford, MA, USA). Mouse anti-human CD3 (OKT3) was kindly provided from Dr. Steve R. Roffler (Institute of BioMedical, Sciences ACADEMIA SINCA).
The following kits were obtained as indicated: SuperScript III RT kit and AnnexinV-FITC apoptosis detection kit from Invitrogen (Gaithersburg, MD, USA). Human FoxP3 Buffer Set from BD Pharmingen (Franklin Lakes, NJ, USA). Human cytokine antibody array from RayBiotech (Norcross, GA, USA). Enhanced chemiluminescence kit (ECL) from Pierce (Rockford, IL, USA). RealQ-PCRmater mix kit from Ampliqon (Copenhagen, Denmark)
4. Instrument
FASCan flowcytometry from Becton, Dickinson and Company (Franklin Lakes, NJ, USA). ABI prism 7000 from Applied Biosystems (Drive Foster City, CA, USA). Sunrise remote control (TECAN Group Ltd., AG, Switzerland).
5. Others
Escherichia coli (BL21) from Yeastern Biotech Co., Ltd. (Taipei,
Taiwan). HisTrap HP column from GE Healthcare (Uppsala,Sweeden). Nitrocellulose paper from Millipore (Billerica, MA, USA).
Methods
1. Expression and purification of rHpHsp60 protein
E. coli [BL21(DE3)] were transformed with pET-Hphsp60 and grew
on LB plate containing kanamycin (30mg/ml) at 37C for 16 hours. Then single colony was picked and inoculated in 100 ml LB medium containing kanamycin (30mg/ml). After 16 hours incubation at 37C, the bacteria in the LB broth were refreshed in 900 ml LB with vigorous shaking. Assayed the OD value until OD600 reaches 0.6~0.8, then protein induction was performed by adding 1.25 ml of IPTG (800mM). After 4 hours incubation, harvested the bacteria by centrifugation at 5000 rpm for 15 min at 4 C. Discarded the supernatant and resuspended the pellet with 30ml binding buffer (20 mM Na2HPO4, 0.5 M NaCl, 40 mM imidazole, pH 7.4). Total
lysates were sonicated for 15 min and then centrifuge at 12,000 rpm for 30 min to collect the supernatant which containing rHpHsp60. HisTrapHP column (1cm) was used to purify rHpHsp60. All the buffers and protein samples needed to be filtered with 0.45µm syringe filter. After protein sample loading into the column, washed the column with 30X volume of binding buffer to remove the unwanted proteins and then eluted the
rHpHsp60 with 10X volume of elution buffer (20 mM Na2HPO4, 0.5 M
NaCl, 500 mM imidazole, pH 7.4). Eluted rHpHsp60 were collected and loaded into G-25 column to remove the unnecessary salt and replace the buffer with PBS (Phosphate Buffer Saline, 140 mM NaCl, 2.7 mM KCl, 10 mM Na2HPO4, 1.8 mM KHPO4, pH 7.4). Protein concentration was
quantified by Coomassie Plus reagent (BSA was used as the standard). SDS-PAGE and western blotting with anti-His conjugate HRP were used to confirm the purity of rHpHsp60.
2. Peripheral blood mononuclear cells (PBMCs) Isolation
PBMCs were isolated from human whole blood by using Ficoll-PaquePlus. Dilute human whole blood with equal volume of PBS. Added 6 ml Ficoll-PaquePlus into the 15 ml centrifuge tube and loaded 8 ml of the diluted blood sample on Ficoll-PaquePlus reagent carefully. Then centrifuged the tubes at 400g for 40 min at 18C. After centrifuge, removed the plasma layer and collect the PBMC carefully between the plasma layer and Ficoll-PaquePlus solution. Washed the cell with 2X volume of PBS, centrifuged at 1,500 rpm for 15 min. Discarded the supernatant and added 10 ml of ACK lysis buffer (0.15M NH4Cl, 10 mM KHCO3, 0.1 mM Na2EDTA)
to lyse the red blood cells. Centrifuged at 1,500 rpm for 15 min to remove the supernatant and then washed the cell with 10ml PBS again. Counted the cell number and seeded the PBMCs into 96-well culture plate with RPMI1640 culture medium.
3. Cell culture
PBMC were cultured with RPMI1640 containing 10% heat-inactivated FBS, 1% PSA and incubated at 37C, 5% CO2 in the incubator.
4. PBMC proliferation assay
To mimic the action occur when the immune cells encounter antigen, anti-CD3 antibody (OKT3, an antibody that specifically binds to CD3 surface marker and transduces signals continually to activate T lymphocytes) was used to selectively activate T lymphocyte (1µg/ml, 30µl per well of 96-well culture plate, incubate in 37C for two hours). Fresh blood samples from healthy donors were obtained and the PBMCs were isolated by Ficoll-Pague reagent. Then seeded the cells into anti-CD3 mAb pre-coated 96-well plates (2*105/well, triplicate for each treatment) and treated with
different dosages of HpHsp60 (0.02 ng to 2000 ng), GFP or boiled HpHsp60 for four days incubation. Cell proliferation was verified by MTT assay. In briefly, 96-well was centrifuged at 1,500 rpm for 15 min to remove the supernatant. Added 100 µl MTT solution into each well and incubated the plate at 37C for four hours. Then centrifuged again, removed the supernatant and dissolved the purple crystal with 100 µl DMSO each well. Shook the plate for 10 min then measured the OD value at 595nm. The proliferation index was calculated with following equation: proliferation index = (OD value of HpHsp60-treated PBMC) (OD value of PBMC treated without HpHsp60)*100%.
5. Human Cytokine Antibody Array
PBMCs (2*105 cell/well, quintuple for each sample) were seeded in 96-well plates that pre-coated with anti-CD3 mAb (1µg/ml OKT3, 30µl/well) with RPMI1640 containing 2% FBS. Treated the cell with 200ng rHpHsp60 and incubate at 37C. Harvested the cells and collected the supernatant by centrifuge at twenty-foure hours later and 4 days after seeding. Human cytokine antibody array was used to measure the cytokine expression profiles in the supernatant according to the manufacturer’s specification. In briefly,
cytokine array membranes were blocked with 1X blocking buffer for 30 min, and then 2 ml of sample mixtures (For each one membrane, supernatants collected from two different samples was used.) were added and incubated without shaking at room temperature for 2 hours. After 3 times of wash with wash buffer I and wash buffer II, added 1 ml of biotin-conjugated anti-cytokine antibodies and incubated at room temperature for 1 hour. Washed the membranes 3 times with wash buffer, added the horseradish peroxidase-strepavidine for 1 hour incubation, then developed with ECL.
6. Cell surface marker staining assay
To analyze the cell population changes in HpHsp60-treated PBMC, cell surface marker staining was performed. PBMCs were seeded in anti-CD3 mAb pre-coated 96-well plate and treated with 200 ng of HpHsp60 for four days. Pooled the cells with the same treatment together and counted the total cell number. Stained the cells with 1 µg OKT3 (1 Ab) in 250 µl staining buffer (0.5% cold skim milk) on ice for 1 hour in the dark. Washed the cell with 1 ml cold PBS, centrifuged at 4,000 rpm for 5 min to remove the unbound antibodies. Then stained the cell with 0.5 µg rabbit anti-mouse IgG-FITC (2 Ab) in 250 µl staining buffer on ice for 30 min in the dark.
with 1 ml PBS for the following FACScan analysis. T cell number was calculated as following equation: Total cell number * Gate % of CD3 positive population. Number of non- T cell population= Total cell number- T cell number.
7. Cell cycle
PBMCs were seeded into the anti-CD3 pre-coated 96 well plates and treated with 200 ng of HpHsp60. After four days incubation, harvested the cells and counted the cell number. Took 106 of treated PBMC and washed the cells with 3 ml of cold PBS. Centrifuged at 4C, 1,500 rpm for 15 min to remove the supernatant. Resuspended the cell in 200 µl cold PBS. Then transferred the cell rapidly into 5 ml of 70% cold ethanol for fixation. After one-hour standing at -20C, centrifuged the cell at 4C, 1,500 rpm for 15 min. Discarded the ethanol and resuspended the cell pellet with 100 µl staining solution (50ng/ml PI and 1µg/ml RNase in PBS). Stained the cell at room temperature in the dark for 30 min. Added 900 µl PBS and analyzed the cell cycle of each sample on FACScan.
To evaluate the apoptosis of HpHsp6-treated PBMC, Annexin V-FITC/ PI apoptosis assay was used. PBMCs were seeded with the same conditions of cell surface marker staining assay. After four days, cells were harvest by versin and washed with 1 ml PBS. Count the cell number of samples and take 2*105 cells for each treatment to stain with Annexin V and PI. Cells were stained with 5 µl Annexin V-FITC, 1 µl PI (final conc.=1 µl/ml) in 100 µl staining buffer (10mM HEPES, 140 mM NaCl and 2.5 mM CaCl2, pH=7.4) for 15 min at room temperature in the dark. Add 900 µl PBS
before FACScan analysis.
9. Cell-dependent experiments
To demonstrate whether the inhibitory activity of HpHsp60 through the effective molecules on the cell or in the supernatant, the following experiments were performed. PBMCs were treated with anti-CD3 only or with both anti-CD3 and HpHsp60. After four days incubation, treated cell were washed to remove any soluble factors and the culture supernatants were collected for the following experiment. For cell-dependent exp., mixed the treated PBMC with fresh PBMC in different ratios (Fresh PBMC: Treated
into the anti-CD3 pre-coated 96-well (2*105 cells/ well, triplicate for each treatment). Treated 2*105 of fresh PBMC with 200 ng HpHsp60 as the positive control. For supernatant-dependent exp., different amounts of the supernatants were mixed with fresh culture medium (RPMI) and the mixtures were used to culture with fresh PBMC (2*105 cells/ well, triplicate for each treatment) in the anti-CD3 mAb pre-coated 96 well plates for four days. After the next four days incubation, MTT assay was used to determine the cell proliferation.
10. FoxP3 intracellular staining
To confirm the percentage of Treg cell in HpHsp60-treated PBMC, FoxP3 intracellular staining was performed. PBMC were seeded with the same conditions of Annexin V-FITC/PI apoptosis assay. After four days incubation, harvested the cells and counted the cell number. Took 106 of treated PBMC and washed with 1 ml of cold PBS. Before FoxP3 intracellular staining, stained the cell with mouse anti- human CD4- FITC (20µl antibody in 250 µl staining buffer, incubate on the ice in the dark for 30 min) first. Washed the cell with 1 ml cold PBS, then processed to cells to the following fixation and permeabilization by the Human FoxP3 Buffer Set
1 ml of 1x Buffer A for 10 min at room temperature. Washed the cells with 1 ml PBS. Then add 500 µl of Buffer C to pemeabilize cells for 30 min at room temperature in the dark. Washed the cell with 1 ml PBS once again. After fixation and permeabilization, stained the cell with 20 µl of mouse anti-Human FoxP3-PE mAb in 250µl staining buffer for 30min at room temperature in the dark. Added 900 µl PBS before FACScan analysis.
11. RNA Isolation
PBMCs were seeded with the same conditions of the cell surface marker staining assay. After harvested the cells and counted the cell numbers, took 106 cells of each treatment and homogennizated the cells by adding 1 ml f Trizol reagent. Stood the samples at room temperature for 2~3 min, then added 200µl choloroform and shook the samples vigorously by hand for 15 sec. Incubated the samples at room temperature for 3 min and centrifuged at 12,000 rpm for 15 min at 4C. After centrifuge, transferred the aqueous phase to a fresh tube and precipitate the RNA by adding 500µl of isopropanol. Incubated the samples at room temperature for 10 min. Centrifuged the samples at 12,000 rpm for 10 min to obtain the RNA precipitation. Washed the RNA pellet with 1 ml of 70% ethanol by vortex
DEPC water and incubated at 60C on the dry-bath. Checked the RNA quality and quantity by measuring the OD 260 and OD 280.
12. Reverse transcription
Superscript III RT kit was used to convert the total RNA into cDNA according to the manufacturer’s specification. For each reverse transcription reaction, took 1 µg of total RNA to mix with 1 µldNTP and 1µl ramdom haxamer, then added the DEPC water to the final volume of 10 µl. Incubated the mixtures at 65C for 5 min and followed by incubation on the ice for at least 2 min. Then, added 2 µl of 10XRT buffer, 4µl of 25mM MgCl2, 2µl of
DTT, 1µl of SuperScript III (reverse transcriptase) and 1µl RNaseOUT into the sample mixtures and incubated the samples as following program: 25C for 10 min, 50C for 50 min, and 85C for 5 min. Chilled the samples on the ice, then added 1µl of RNase H into the sample and incubated at 37C for 20 min to remove the RNA templates.
13. Real-time PCR
PCR. The qPCR reactions were performed with API 7000 in 25µl reaction mixtures with CyberGreen and gene-specific primers. The primer sequences of FoxP3 and ß-actin were indicated as follow: human FoxP3 sense primer: 5’- ACT GGG GTC TTC TCC CTC AA-3’, human FoxP3 anti-sense primer: 5’- CGT GGG AAG GTG CAG AGT AG-3’, human ß-actin sense primer: 5’- TTG CCG ACA GGA TGC CAG AA-3’, human ß-actin anti-sense primer: 5’- GCC GAC TCC ACA CGG AGT ACT-3’. The reaction mixture contained 0.5µl of each primer, 1µl of cDNA, 12.5µl of 2X realQ PCR master mix (with 10mM MgCl2, Green DNA dye) and 10.5µl of distilled
water. PCR cycling conditions were 50C for 2 min, 95C for 10 min, 40 cycles of 95C for 15 sec, 60C for 1 min. The relative expression of FoxP3 was determined by normalizing the expression of each sample to the ß-actin expression of negative control.
14. TGFß inhibitor assay
PBMCs were seeded with the same conditions of the PBMC proliferation assay. 2µl of SB431542 was added into the culture cells, which were treated 200ng of HpHsp60 at the same time or the second day after seeding. After 4 days incubation, cell proliferation was verified by MTT
15. Statistical analysis
The results are presented as mean SD. Significant is calculated by T test. The P value < 0.05 is considered as statistically significant.
Results
The effects of HpHsp60 on PBMCs proliferation and the cytokine expressions
To investigate the effect of H. pylori Hsp60 (HpHsp60) on human immune system, the proliferative activities of peripheral blood mononuclear cells were first examined. PBMCs were mainly composed of monocytes and lymphocytes that were involved in both adaptive and innate immunity. Fresh PBMCs were activated by anti-CD3 monoclonal antibodies to cause the proliferation and different dosages of HpHsp60 (0.02 ng to 200 ng) were respectively added to determine whether they could interfere the growths of PBMCs. The results showed that HpHsp60 inhibited the proliferations of PBMCs and the inhibition effect is in a dose-dependent manner. Conversely, the addition of IL-2 would reverse the inhibitory effect of HpHsp60 (Fig. 1A). To verify the inhibitory effect not due to LPS contamination in the recombinant proteins, boiled HpHsp60 and the other recombinant GFP proteins were used to treat the PBMCs in the same system. The results showed that the treatment with neither boiled HpHsp60 (Fig. 1B) nor recombinant GFP (Fig. 1C) would not induce the phenomenon of proliferation inhibition.
Since HpHsp60 could inhibit PBMCs proliferation, whether HpHsp60 has any impact on cytokine expression profile was also examined. In this study, the
cytokine expression profile was evaluated by cytokine array. As shown in figure 2A, treated PBMCs with 200ng of HpHsp60 for 24 hours, the cytokine expressions were different from the PC group, which was treated with anti-CD3 only. Cytokines such as IL-15, TNF-alpha, MCPs, GRO, RANTES were dropped down significantly after treatment with HpHsp60 (Fig. 2B). After four days treatment, the expressions of most cytokines were continued to decrease compared to PC group. However, one of the inhibitory cytokines, TGF-ß, was up regulated apparently (Fig. 2C).
Sequentially, the proliferative capability of which cell was influenced by the HpHsp60 was investigated. As shown in figure 3A, T cell numbers of total PBMCs with HpHsp60 treatments were decreased. Similarly, IL-2 plus HpHsp60 treatment also decreased the numbers of T cell. However, the treatments of HpHsp60 had no effect on the growth of non-T cell population (Fig. 3B).
HpHsp60 inhibits PBMCs proliferation through inducing cell cycle arrest but not apoptosis
To verify whether the decreases in proliferation were resulted from cell cycle arrest or cell death, the HpHsp60-treated PBMCs were determined their cell cycle. In figure 4A, the cell populations at S phase and G2/M phase of HpHsp60-treated
no differences for the sub G1 phase among the three groups. As shown in figure 4B, the percentages of cells at G0/G1 phase were risen with the treatment of HpHsp60, whereas both S phase and G2/M phase were decreased.
Meanwhile, apoptosis of HpHsp60-treated PBMCs was also examined. HpHsp60 did not induce apparent apoptosis as shown in PBMCs treated with mitomycin C (Fig. 5A). And in figure 5B, the apoptosis percentage of HpHsp60-treated PBMCs had no significance compared with cells HpHsp60-treated with anti-CD3 antibodies only. The similar results were also observed when samples were treated with IL-2.
HpHsp60 inhibits PBMCs proliferation through a cell-dependent manner.
To evaluate the inhibitory activity of HpHsp60 through the effective molecules on cell or supernatant, HpHsp60-treated PBMCs were monitored their effects on the proliferative rates of fresh PBMCs. Figure 6A showed the HpHsp60-treated cells significantly caused the decrease in the proliferation index to 69% (Treated cell: Fresh PBMC=1:1), comparing with the group which the treated cell were treated with anti-CD3 only (proliferation index = 78%). Similarly, lower numbers of the treated cells also resulted in growth inhibition of fresh PBMCs (Treated cell: Fresh PBMC=1:4). The proliferation index was significantly
decreased from 94% to 87%. In addition, IL-2 abolished the inhibition phenomenon on fresh PBMCs growth (Fig. 6B).
Furthermore, the supernatants of treated cells were added into the fresh PBMCs to determine their effects on growth inhibition. As shown in figure 7A, the supernatants derived from PBMCs treated with anti-CD3 antibodies and HpHsp60 had no significant difference with the supernatants derived from PBMCs treated with anti-CD3 antibodies to lower the proliferation index. In addition, the supernatants derived from the two treatments had no significant difference to lower the proliferation index, when combined with IL-2 treatment (Fig. 7B).
These results indicated that the effective molecules to cause PBMCs proliferative inhibition are on (in) the HpHsp60-treated cells. Therefore, the HpHsp60-treated cells play an important role in proliferative inhibition. The HpHsp60-treated cells were verified their cell population. The results showed the treatment caused almost 89% of treated cells were T-cells (Fig. 8), and the distribution of CD4+ or CD8+ sub-population of T-cells did not change after HpHsp60 treatment (Data not shown).
Subsequently, the effect of HpHsp60 on the population of percentage of regulatory T (Treg) cells was determined. Figure 9A revealed that percentage of Treg in CD4+ T cell was increased in HpHsp60-treated PBMCs. Figure 9B showed the CD4+FoxP3+ cells percentages of three independent experiments. Treatment
72%. Meanwhile, FoxP3 gene expression was verified at mRNA level. As shown in figure 9C, FoxP3 mRNA relative expression was increased when PBMCs treated with HpHsp60.
TGF-ß signaling pathway is involved in the induction of Treg and the proliferative inhibition of PBMCs.
To confirm the role of the TGF-ß signaling pathway in this study, two of the TGF-ß inhibitors, SIS3 and SB431542, were used to validate their effects on the induction of regulatory T cells and the proliferation inhibition of HpHsp60-treated PBMCs. Figure 10A showed the addition of SB431542 combined with HpHsp60 mildly reversed the proliferative inhibition of PBMCs without significance. However, SIS3 had no effect on the proliferative inhibition (Fig. 10B). Subsequently, since the treatment with HpHsp60 significantly increased Treg cell percentage on the second day (Fig. 11A), SB431542 and SIS3 were treated at the same time with HpHsp60 or on the second days after seeding respectively. Figure 11B showed the simultaneity addition of SB431542 and HpHsp60 significantly decreased the percentage of HpHsp60-induced regulatory T cells. Furthermore, addition of SB431542 on the second day significantly reversed the proliferative inhibition and increased the proliferation index to 91% (Fig.12A). However, SIS3
still did not influence the proliferative inhibition when treated on the second day after treatment with HpHsp60 (Fig.12B).
Discussion
Recently, microbial Hsp60s were demonstrated to serve as immunomodulators. Kinnune et al. found C. trachomatis Hsp60 responding T cells produce IL-10 to down-regulate hosts’ immune response, and the pathogenic Hsp60 has ability to shift the immune response from Th1 to Th2 [27]. In addition, mycobacterial Hsp60 can reduce the level of IFN-gamma and inhibit cell proliferation of PBMC isolated from periodontitis patients [41]. However, whether the Hsp60 of H. pylori play immunomodulater roles in their pathogenic mechanism is still unknown. In the study, HpHsp60 was found it could inhibit PBMCs proliferation. To exclude the possibility for the LPS contamination would cause the same inhibitory phenomenon, we boiled HpHsp60 to denatures proteins but not LPS. In the result, the effect of HpHsp60 on proliferation inhibition was completely inhibited by boiling, which indicated the inhibitory effect was not likely due to the LPS contamination. Furthermore, since rGFP could not induce the same inhibition of PBMCs proliferation, the inhibitory ability might be restricted to the HpHsp60. Something interesting was, the inhibition effect could be abolished when additional IL-2 was administrate.
The effects of HpHsp60 on PBMCs were not only on cell growth but also on cytokine secretion. Figure 2 indicated HpHsp60 has different levels of influence on different cytokine. Cytokines and chemokines that involved in T cell activation and macrophage maturation were all down regulated with the treatment of HpHsp60. On the scanning photograph of the forth day, the cytokine expression profile was quite similar with the first day, but the intensities of IL-8, IL-10, GRO-alpha, IL-6 and RANTES were much lower. This indicated activation of PBMCs continued to be blocked by HpHsp60.
HpHsp60 has effect on the proliferation of T cells but has no effect on non-T cells in PBMCs (Fig. 3). The results showed the proliferative inhibition is resulted from cell cycle arrest but not cell death. HpHsp60 induces cell cycle arrest at G0/G1 phase and lowers the cell population in S and G2/M phases. In addition, no significant change was observed in sub G1 phase, which indicated HpHsp60 could not induce apoptosis. And the results were coincided with the results from annexin-V staining (Fig. 4). Together these results, it was proposed that HpHsp60 could result in proliferative inhibition for T-cell by interfering the DNA replication but not apoptosis.
(Fig. 8). Thus, Treg cells maybe play an important role in this inhibition. Figure 9 revealed percentages of regulatory T cells (CD4+ and FoxP3 + T cells) rise in the HpHsp60-treated PBMCs, which proved the proposition. Indeed, H. pylori have been found their infection will cause the increase of Treg cell at infectious sites [38-40]. Moreover, HpHsp60 are also revealed that they can be secreted out by H.
pylori [29]. Therefore, we proposed that H. pylori would cause increase in Treg cell
by Hsp60 secretion after the infection to impair host immunity.
In this study, we first demonstrated that the pathogenic HpHsp60 acts on the increase of Treg cell. In 2006, Alexandra Z. Z. et al. also reported that human Hsp60 acts as a costimulator of human Tregs. Treatment of human Hsp60 enhanced the ability of the CD4+CD25+ T cells to inhibit the growth of untreated CD4+CD25- cells by cell-to-cell contact and the secretion of TGF-ß and IL-10 [42]. In addition, regulatory T cells have been indicated that they are associated with the suppression of inappropriate or excessive immune response in human immune system. There are two types of Treg cells: natural Treg (nTreg) cells and induced Treg (iTreg) cells in periphery bloods. Natural Treg cells are developed in the thymus whereas the iTreg cells can be generated through the TCR activation in the present of immunosuppressive cytokines like IL-10 and TGF-ß [43]. According the literatures, HpHsp60 can induce the TGF- and IL -10 expressions in monocytes [32].
preferentially enhancing the expressions of immunosuppressive cytokines in PBMCs. The suppressive mechanisms induced by Treg cells can be divided into three categories: cell–cell contact, secretion of inhibitory cytokines and competition for growth factors. Figure 4 showed the HpHs060-treated cells significantly contributed on the proliferative inhibition, which proposed the suppressive mechanism might be through the cell–cell contact.
Furthermore, TGF-ß signaling pathway was shown to be involved in the generation of HpHsp60-induced Treg cells and may have contribution to their suppressive functions (Fig. 10-12). SB431542 is an inhibitor specific to the ALK-4, 5, 7 (activin-like kinase, i.e. TGF-ß receptor I) [44-45] whereas SIS3 is an inhibitor selectively blocked the phosphorylation and functions of Smad3 [46]. In the study, we showed SB431542, but not SIS3, could efficiently block the forming of HpHsp60-induced regulatory T cell as well as their suppressive activity. There is one possibility for the phenomenon: HpHsp60 induced the generation of Treg cells engages the TGF-ß signaling different from classical Smad-dependent pathway. According to literatures, tyrosine residues on both TGF-ß receptor I and II can be phosphorylated through TGF-ß stimulation thus resulted in activation of Erk, p38 and JNK MAP kinases [47-51]. On the other hand, phosphorylation of p38 and MAPK were both demonstrated up regulated in the induced regulatory T cells.
[52-Smad-independent TGF-ß signalling pathway. In the other hand, addition of SB431542 on the second day could reverse the proliferative inhibition about 57%, whereas SIS3 still had no effect on proliferative inhibition. These results indicated that the mechanism of how the HpHsp60-induced regulatory T cells cause the proliferative inhibition of PBMCs might be just partially relative to TGF-ß.
In conclusion, this study showed that Helicobacter pylori-derived Hsp60 has immune suppressive ability in a dose-dependent manner. The proliferative inhibition is on T cell populations mainly and caused by HpHsp60-induced Treg cells through stopping the cell cycles at G0/G1 phase. And the generation of regulatory T cell by HpHsp60 engages Smad-independent TGF-ß signaling pathway.
Figure and Legend
Figure 1 A. 0 20 40 60 80 100 120 140 0 0.02 0.2 2 20 200 HpHsp60 (ng) Without IL-2With IL-2 (100IU/ml)
B. 0 20 40 60 80 100 120 140 0 0.02 0.2 2 20 200
Boiled HpHsp60(ng)
*
*
*
*
C. 0 20 40 60 80 100 120 140 0 0.02 0.2 2 20 200
GFP (ng)
Figure1. Treatment with HpHsp60 to PBMCs decreases the proliferation in the present of anti-CD3 antibody. PBMCs were isolated from healthy donors and seeded with or without IL2 (100IU/ml) in 96- well, which was coated with anti-CD3 antibody (OKT3, 1ug/ml). Different dose of recombinant proteins were co-culture with PBMCs for four days. After four days incubation, MTT assay was used to detect the proliferation of PBMCs. Proliferation Index = OD595 of PBMCs
treated with HpHsp60/ OD595 of PBMCs treated without HpHsp60* 100%. (A)
HpHsp60 inhibited PBMC proliferation significantly in a dose-dependent manner (N=5 for the group treated without IL-2; N=4 for the group treated with IL-2. P < 0.05 from 0.2ng to 200ng). However, when the cells seeded with IL2, inhibition was abolished. (B) The inhibition effect was disappeared when the HpHsp60 was boiled to denature. (N=3) (C) Treatment with green fluorescence protein (GFP) instead of HpHsp60 was as a negative control. GFP did not induce proliferation
Figure 2 A.
B.
Cytokine Intensity (%) PC (1 Day) HpHsp60 (1 Day)
TNF-alpha 33 UD IL-5 26 UD MCP-1 42 18 MCP-2 21 UD IFN-gamma 13 UD RANTES 63 53 IL-8 90 84 IL-10 92 87 IL-6 97 95 GRO 96 94 GMCSF 76 75 GRO-alpha 16 26 Anti-CD3 Ab + HpHsp60 (1 Day) Anti-CD3 Ab + HpHsp60 (4 Day) Anti-CD3 Ab (1 Day)
C.
Cytokine Intensity (%)
(Normalized with cell no.) PC (1 Day) HpHsp60 (4 Day)
IL-8 275 UD IL-10 281 121 IL-6 296 157 GRO 293 157 GMCSF 232 146 IL-5 79 UD RANTES 192 113 TNF-alpha 101 30 MCP-1 128 87 IL-15 40 UD TGF-beta UD 87 MCP-2 64 103 TNF-beta UD 22 GRO-alpha 49 51
Figure2. The treatment of HpHsp60 altered the cytokine expression profile of activated PBMCs. PBMCs isolated from two healthy donors were treated with 200 ng of HpHsp60 under activation of OKT3 (anti-CD3 Ab). Supernatants were collected and mixed on the first day and the forth day, respectively. The cytokine expression profile of supernatant mixtures was assay by cytokine array. (A) Scanning photographs of membrane array after development. Cytokine array map was adapted from the user manual of RayBio Human Cytokine Antibody Array. (B) & (C) The intensity of each spot was analyzed by ImageMaster™ 2D Platinum v7.0 (GE Healthcre). The relative intensity of different cytokines was normalized with the positive spots. The values of relative cytokine expression were shown on the table B and C (UD: undetectable). (N=1)
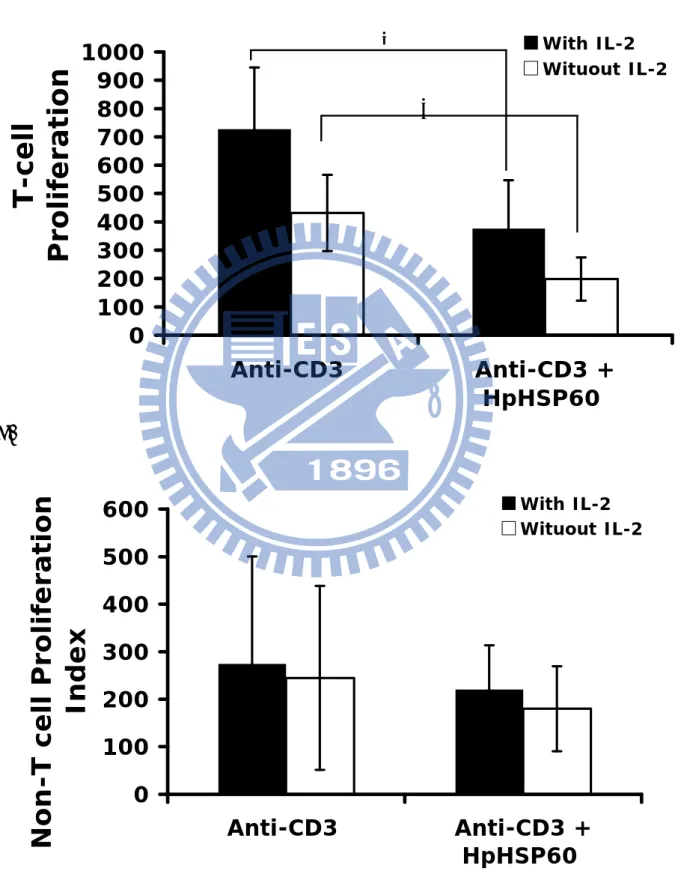
Figure 3 A.
0
100
200
300
400
500
600
700
800
900
1000
Anti-CD3 Anti-CD3
+
HpHSP60
T-cell
Proliferation
With IL-2 Wituout IL-2 B.0
100
200
300
400
500
600
Anti-CD3 Anti-CD3
+
HpHSP60
Non-T cell Proliferation
Index
With IL-2 Wituout IL-2
*
*
Figure3. T cell population is the major target of HpHsp60 in their proliferation inhibition function. PBMCs isolated from two healthy donors were treated with 200 ng of HpHsp60 under activation of OKT3 (anti-CD3 Ab). Treated PBMCs were stained with anti-CD3-FITC and their cell population variation was analyzed by flowcytometry. T cell numbers of the cells treated without anti-CD3 (NC) is considered as the 100%. After OKT3 activation, T cell number is increase about 4-fold and 7-fold in the samples with (black bar) and without (white bar) IL-2 respectively, compare to the sample that without antibody activation. After treated with HpHsp60, T cell number decrease significantly to 1.9-fold and 3.7 fold of the NC group in samples with and without IL-2, respectively. Cell number decrease was also seen in the non- T cell population, but without significance. *, P < 0.05.
Figure 4 A. B. G2/M Phase 0 5 10 15 20 25 NC PC HpHsp60 Percentage (%)
Counts
DNA Content
G0/G1 Phase 0 20 40 60 80 100 120 NC PC HpHsp60 Percentage (%) S Phase 0 5 10 15 20 NC PC HpHsp60 Percentage (%) W/O IL-2_NC.001 0 200 400 600 800 1000 FL2-H W/O IL-2_PC.002 0 200 400 600 800 1000 FL2-H W/O IL-2_HSP.003 0 200 400 600 800 1000 FL2-HFigure4. HpHsp60 induces cell cycle arrest at G0/G1 phase. Cell cycle of PBMCs treated with HpHsp60 was assay by flowcytometry. (A) Plots show the cell cycles of PBMCs treated with or without HpHsp60. (NC: Cell only; PC: PBMCs activated by anti-CD3; HSP: PBMCs treated with anti-CD3 and HpHsp60). One representative of three independent experiments was shown here. (B) Percentages of cell cycle phases in three experiment groups. The mean values were indicated as follow: for G0/G1 phase, NC= 90%, PC= 64%, HpHsp60= 74%; for S phase, NC= 1%, PC= 15%, HpHsp60= 10%; for G2/M phase, NC= 6%, PC= 16%, HpHsp60= 11%.
Figure 5 A. B. With IL-2 0 10 20 30 40 50 60 NC PC HpHsp60 Mitomycin C Apoptosis (%) W/O IL-2 0 10 20 30 40 50 60 70 NC PC HpHsp60 Mitomycin C A p optosis (%)
AnnexinV-FITC
PI
W/O NC_1.011 100 101 102 103 104 FL1-H W/O PC_1.014 100 101 102 103 104 FL1-H W/O HSP_1.017 100 101 102 103 104 FL1-H W/O MTC_1.020 100 101 102 103 104 FL1-HFigure5. HpHsp60 dose not induce PBMC apoptosis. (A) Quadrant plots show the apoptosis status of HpHsp60-treated PBMCs. (W/O stands for “treat without IL-2”; NC: Cell only; PC: PBMCs activated with anti-CD3; HSP: PBMC treated with anti-CD3 and HpHsp60. MTC: mitomycin C (500µg/ml), as the positive control for the apoptosis.) The lower and upper right quarters are represent early and late phases of apoptosis respectively. (B) The percentages of apoptosis were calculated according to the flowcytomery analysis.
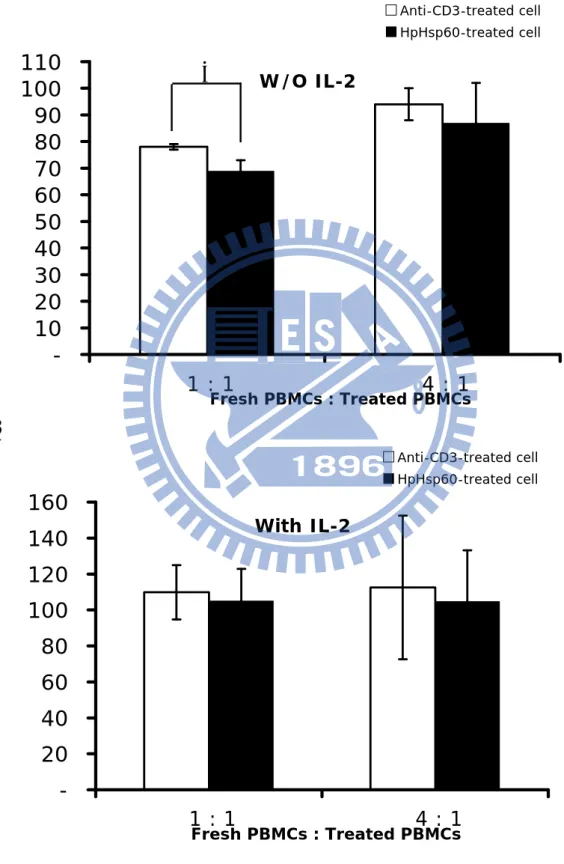
Figure 6 A. W/O IL-2 -10 20 30 40 50 60 70 80 90 100 110 1 : 1 4 : 1 Fresh PBMCs : Treated PBMCs Anti-CD3-treated cell HpHsp60-treated cell B. With IL-2 -20 40 60 80 100 120 140 160 1 : 1 4 : 1 Fresh PBMCs : Treated PBMCs Anti-CD3-treated cell HpHsp60-treated cell
*
Figure6. The inhibition is through a cell-dependent manner. PBMCs were seeded with or with IL2 and activated by OKT3 only or treated with HpHsp60 simultaneity. After four days, treated PBMCs were collected and co-culture with fresh PBMCs and OKT3 in different ratio for another four days incubation. Then MTT assay was taken to evaluate the proliferation. (A) Cells treated with HpHsp60 but without IL-2 (gray bar) significantly inhibited the fresh PBMCs proliferation compared to the cells treated with anti-CD3 only (white bar). * P< 0.05. (B) The inhibition was abolished when the treated cell were co-culture with IL-2 before mixed with allogenic fresh PBMCs.
Figure 7 A.
W/O IL-2
0 20 40 60 80 100 120 140 160 0 100 150 175 200 200 100 50 25 0Fresh RPMI (ul) Supernatant (ul) PC HpHsp60 B.
With IL-2
0 20 40 60 80 100 120 140 160 0 100 150 175 200 200 100 50 25 0Fresh RPMI (ul) Supernatant (ul)
PC HpHsp60
Figure7. The inhibition is not through a supernatant-dependent manner. PBMCs were seeded with or with IL-2 and activated by OKT3 only or treated with HpHsp60 (200ng) simultaneity. After four days, supernatants were collected and co-culture with fresh PBMC and OKT3 in different ratio for another four days incubation. Then MTT assay was taken to evaluate the proliferation. PC: supernatants were collected from anti-CD3 activated group. HpHsp60: supernatants were collected from HpHsp60-treated group. (A) Supernatants without IL-2. (B) Supernatants with IL-2.
Figure 8
Figure8. T cell percentage of HpHsp60-treated PBMCs. The treated PBMCs were verified their T cell population. The chart showed that almost 93% of HpHsp60-treated cell were T cell. The data shown here was one representative of three independent experiments.
Counts
CD3
+ W/O NC_CD3_3.016 100 101 102 103 104 FL1-H M1 W/O PC_CD3_4.023 100 101 102 103 104 FL1-H M1 W/O HSP_CD3_3.011 100 101 102 103 104 FL1-H M164% 83% 93%
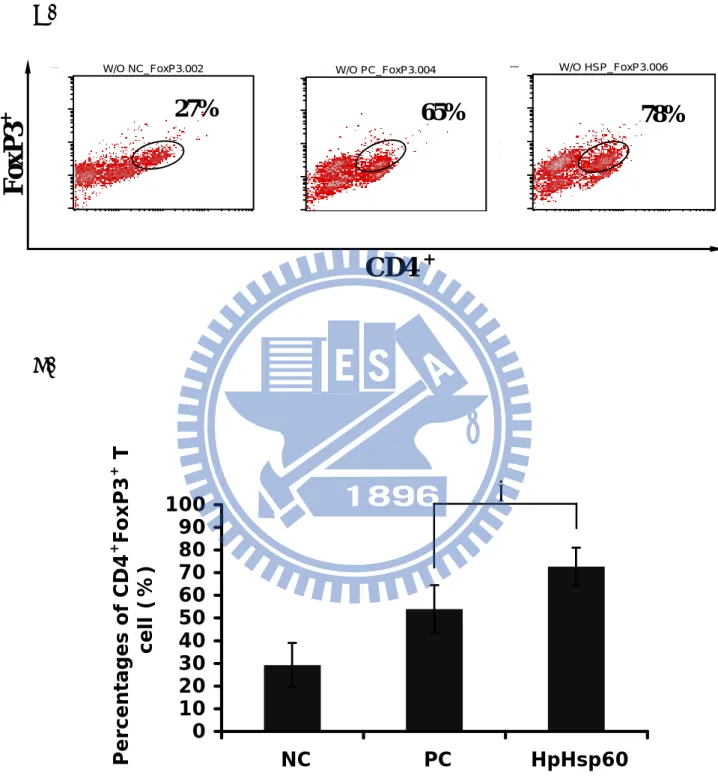
Figure 9 A. B. W/O HSP_FoxP3.006 W/O HSP_FoxP3.006 100 101 102 103 104 FL1-H 100 101 102 103 104 FL1-H W/O PC_FoxP3.004 W/O PC_FoxP3.004 100 101 102 103 104 FL1-H 100 101 102 103 104 FL1-H W/O NC_FoxP3.002 W/O NC_FoxP3.002 100 101 102 103 104 FL1-H 100 101 102 103 104 FL1-H
FoxP3
+CD4
+65%
27%
78%
0 10 20 30 40 50 60 70 80 90 100 NC PC HpHsp60 Percentages of CD4 + FoxP3 + T cell (%)*
C.
0
1
2
3
4
5
6
7
NC
PC
HpHsp60
FoxP3
mRNA
Relative Expression
Figure 9. Treatment with HpHsp60 increases the percentage of regulatory T cell. (A) Percentage of regulatory T cell in CD4+ cells were assay by the FoxP3 intracellular staining. One representative of three independent experiments was shown here. (B) The percentages of Treg cells of three independent experiments were calculated. Treatment with HpHsp60 significantly increased the CD4+FoxP3+ regulatory T cells about 16 % compared to the cells treated with OKT3 only. (From 56% for the PC group to 72% for the HpHsp60 group). * P < 0.05. (C) FoxP3 expression was verified at mRNA level by real-time PCR. Relative expression was normalized with ß-actin. FoxP3 mRNA expression was
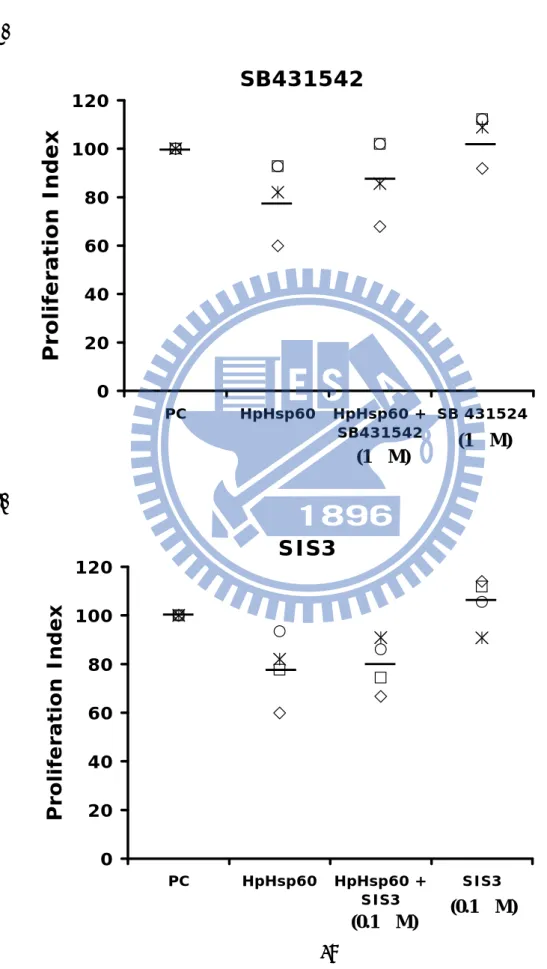
up-Figure 10 A. SB431542 0 20 40 60 80 100 120 PC HpHsp60 HpHsp60 + SB431542 (1然) SB 431524 (1然) Proliferation Index B. SIS3 0 20 40 60 80 100 120 PC HpHsp60 HpHsp60 + SIS3 (0.1然)SIS3 Proliferation Index (1μM) (1μM) (0.1μM)
Figure 10. TGF-ß signaling pathway may be involved in the proliferative inhibition. PBMCs were seeded in 96-well pre-coated anti-CD3 antibodies (2*105/well) and treated with HpHsp60 and with or without TGF-ß inhibitors. After four days incubation, MTT assay was used to detect the proliferation of PBMCs. The different symbols stand for different PMBCs samples obtained from different donors. A row line represented mean value of each condition. (N=4) (A) Mean value of proliferation index: PC=100%, HpHsp60=78%, HpHsp60+SB431542 (1µM)=86%, SB431542=100%. (B) Mean value of proliferation index: PC=100%, HpHsp60=78%, HpHsp60+SIS3 (0.1µM)=79%, SIS3 (0.1µM)=105%.
Figure 11 A. 0 5 10 15 20 25 30 35 40 45
0 Day 1 Day 2 Day
Percentage of CD4 + FoxP3 + cells (%) NC PC HpHsp60 B. 0 10 20 30 40 50 60 70 80 NC PC HpHsp60 HpHsp60 + SB431542 Percentage of CD4 + FoxP3 + cells (%)
Figure 11. TGF-ß signaling pathway is involved in the generation of HpHsp60-induced Treg cells. (A) Time course of Treg generation. Intracellular FoxP3 staining assay at different time points demonstrated percentages of CD4+ FoxP3+ Treg cells. (N=2) (B) Treatment with 1µM SB431542 significantly reduced the generation of Treg cells. (N=3) *, P < 0.05.
*
Figure 12 A. 0 20 40 60 80 100 120 PC HpHsp60 HpHsp60 + SB431542 SB431542
Proliferation Index
C. 0 20 40 60 80 100 120 PC HpHsp60 HpHsp60 + SIS3 SIS3Proliferation Index
*
Figure 12. TGF-ß signaling pathway may be involved in the proliferative inhibition caused by HpHsp60-induced Treg cells. PBMCs were seeded as the same condition with the proliferation assay. 2 days after treatment with HpHsp60, SB431542 (1µM) or SIS3 (0.1µM) were added. Proliferation was evaluated by the MTT assay on the forth day. (A) SB431542. Proliferation index of HpHsp60 = 78%. Proliferation index of HpHsp60 + SB431542 = 91%. (N=3) * P < 0.05. (B) SIS3. Proliferation index of HpHsp60 = 78%. Proliferation index of HpHsp60 + SIS3 = 76%. (N=3)
Reference
1. Warren, J. R. and Marshall, B. Unidentified curved bacilli on gastric epithelium in active chronic gastritis. (Letter). Lancet. 1983; 1:1273-5.
2. Pisani, P., Parkin, D. M., Munoz, N., et al. Cancer and infection: estimates of the attributable fraction in 1900. Cancer Epidemiology,Biomarkers and
Preventio. 1997;6:389–400.
3. Peek, Jr., Richard, M. and Martin J. B. Helicobacter pylori and gastrointestinal tract adenocarcinomas. Nat. Rev. Cancer. 2002; 2:28–37. 4. Peterson, W. L. Helicobacter pylori and peptic ulcer disease. N. Engl. J. Med.
1991; 324:1043–1048.
5. Uemura, N., S. Okamoto, S. Yamamoto, N. Matsumura, S. Yamaguchi, M. Yamakido, K. Taniyama, N. Sasaki, and R. J. Schlemper. Helicobacter
pylori infection and the development of gastric cancer. N. Engl. J. Med. 2001;
345:784–789.
6. Correa, P. Human gastric carcinogenesis: a multistep and multifactorial process. Cancer. Res. 1992; 52:6735–6740.
7. Dixon, M. F., et al. Classification and grading of gastritis. The updated Sydney system. Am. J. Surg. Pathol. 1996; 20:1161–1181.
8. Suzuki, T., et al. Localization of antigen- presenting cells in Helicobacter
9. Lundgren, A., et al. Helicobacter pylori-specific CD4+T cells home to and accumulate in the human Helicobacter pylori-infected gastric mucosa. Infect.
Immun. 2005; 73:5612–5619.
10. Quiding-Jarbrink, M., et al. CD4+and CD8+T cell responses in Helicobacter
pylori-infected individuals. Clin. Exp. Immunol. 2001; 123:81–87.
11. Bamford, K.B., et al. Lymphocytes in the human gastric mucosa during
Helicobacter pylori have a T helper cell 1 phenotype. Gastroenterology.
1998; 114:482-492.
12. Haeberle, H.A., et al. Differential stimulation of interleukin-12 (IL-12) and IL-10 by live and killed Helicobacter pylori in vitro and association of IL-12 production with gamma interferon-producing T cells in the human gastric mucosa. Infect. Immun. 1997; 65: 4229-4235.
13. Umehara, s., et al. Effects of Helicobacter pylori CagA protein on the growth and survival of B lymphocytes, the origin of MALT lymphama.
Oncogene. 2003; 22:8337-8342.
14. Beata Paziak-Doman´ ska., et al. Potential role of CagA in the inhibition of T cell reactivity in Helicobacter pylori. Infections Cellular Immunology. 2000; 202:136–139.
15. Orsini, B., et al. Helicobacter pylori cag pathogenicity island is associated expression of interleukin-4 (IL-4) mRNA and modulation of the IL-4delta2
6667.
16. Gebert, B., et al. Helicobacter pylori vacuolating cytotoxin toxin inhibits T cell lymphocyte activation. Science. 2003; 301:1099-1102.
17. Montecucco, C. and M. de Bernard. Immunosuppressive and proinflammatory activities of the VacA toxin of Helicobacter pylori. J. Exp.
Med. 2003; 198:1767-1771.
18. Gobert, A. P., et al. Helicobacter pylori arginase inhibits nitric oxide production by eukaryotic cells: a strategy for bacterial survival. Proc. Natl.
Acad. Sci. 2001; 98:13844-13849.
19. Gewirtz, A. T., et al. Helicobacter pylori flagellin evades toll-like receptor 5-mediated innate immunity. J. Infect. Dis. 2004; 189:1914-1920.
20. Backhed, F., et al. Gastric mucosal recognition of Helicobacter pylori is independent of Toll-like receptor 4. J. Infect. Dis. 2003; 187:829-836.
21. Covacci, A., et al. Molecular charaterization of the 128- kDa immunodominant antigen of Helicobacter pylori associated with cytotoxicity and duodenal ulcer. Proc. Natl. Acad. Sci. 1993; 90: 5791-5795.
22. Montecucco, C., et al. Helicobacter pylori vacuolating cytotoxin: cell intoxication and anion-specific channel activity. Curr.Top. Microbiol.
Immunol. 2001; 257:113-129.
24. Chen, W., et al. Inhibition of mitogen-induced murine lymphocyte proliferation by Helicobacter pylori cell-free extract. J. Gastroenterol.
Hepatol. 2000;15:1000-1006.
25. Arthur, L. H., et al. Two families of chaperonin: physiology and Mmchanism.
Annu. Rev. Cell Dev. Biol. 2007; 23:115-145.
26. Wieten, L., et al. Cell stress induced HSP are targets of regulatory T cells: a role for HSP inducing compounds as anti-inflammatory immuno-modulators?
FEBS Lett. 2007; 581:3716-3722.
27. A. Kinnunen., et al.Heat shock protein 60 specific T-Cell response in Chlamydial Infections. Scand. J. Immunol. 2001; 54:76-81.
28. Haque, M. A., et al. Suppression of adjuvant arthritis in rat by induction of oral tolerance to mycobacterial 65-kDa heat hock protein. Eur. I. Immunol. 1996; 26:2022-2032.
29. Phadnis, S. H., et al. Surface localization of Helicobacter pylori urease and a heat shock protein homolog requires bacterial autolysis. Infect. Immun. 1996; 64:905–912.
30. Zhao, Y., et al. Helicobacter pylori heat-shock protein 60 induces interleukin-8 via a Toll-like receptor (TLR) 2 and mitogen-activated protein (MAP) kinase pathway in human monocytes. J. Med. Microbiol. 2007; 56:154-164.
interleukin-6 production by macrophages via a Toll-like receptor (TLR)-2,TLR-4, and myeloid differentiation factor 88-independent mechanism. J. Biol. Chem. 2004; 279:245-250.
32. Lin, C. Y., et al. Characterizing the polymeric status of Helicobacter pylori heat shock protein 60. Biochem. Biophys. Res. Commun. 2009; 388:283-289. 33. Sakaguchi, S., et al. Immunologic self-tolerance maintained by activated T cells expressing IL-2 receptor alpha-chains (CD25). Breakdown of asingle mechanism of self-tolerance causes various autoimmunediseases. J. Immunol. 1995; 155:1151–1164.
34. Hori, S., et al. Control of regulatory T cell development by the transcription factor Foxp3. Science. 2003; 299:1057–1061.
35. Fontenot, J. D., et al. Foxp3 programs the development and function of CD4+CD25+ regulatory T cells. Nat. Immunol. 2003; 4:330–336.
36. Khattri, R., et al. An essential role for Scurfin in CD4+CD25+ T regulatory cells. Nat. Immunol. 2003; 4:337–342.
37. Rad, R., et al. CD25+/Foxp3+ T cells regulate gastric inflammation and
Helicobacter pylori colonization in vivo. Gastroenterology. 2006;
131:525-37.
38. Jang, T. J., et al. The number of Foxp3-positive regulatory T cells is increased in Helicobacter pylori gastritis and gastric cancer. Pathol. Res.
39. Anna, L., et al. Mucosal FoxP3-expressing CD4+CD25high regulatory T cells in Helicobacter pylori-infected patients. Infection and Immunity. 2005; 73:523–531.
40. Arne, K., et al. Naturally occurring regulatory T cells (CD4+, CD25high, FoxP3+) in the antrum and cardia are associated with higher H. pylori colonization and increased gene expression of TGF-β1. Helicobacter. 2008;
13: 295–303.
41. Peti, M. D., et al. Depressed responsiveness of peripheral blood mononuclear cells to heat-shock proteins in periodontitis patients. J. Dent. Res. 1999; 78:1393-1400.
42. Zanin-Zhorov A., et al. Heat shock protein 60 enhances CD4+ CD25+ regulatory T cell function via innate TLR2 signaling. J. Clin. Invest. 2006; 116:2022-32.
43. Chen, Z. M., et al. IL-10 and TGF-beta induce alloreactive CD4+ CD25-T cells to acquire regulatory cell function. Blood. 2003; 101:5076–5083.
44. N. J. Laping, et al. Inhibition of Transforming Growth Factor (TGF)-ß1-induced extracellular matrix with a novel inhibitor of the TGF-ßType I receptor kinase activity: SB-431542. Mol. Pharmacol. 2002; 62:58–64.
45. Gareth, J., et al. SB-431542 is a potent and specific inhibitor of transforming growth factor-ß superfamily type I activin receptor-like kinase (ALK)