Received October 26, 2004 Address for correspondence: DAR-ZEN CHEN
Department of Mechanical Engineering, National Taiwan University Taipei, Taiwan E-mail: [email protected]
Core technologies and key industries in Taiwan
from 1978 to 2002:
A perspective from patent analysis
DAR-ZEN CHEN,a HAN-WEN CHANG,b MU-HSUAN HUANG,b FENG-CHENG FUc a Department of Mechanical Engineering, National Taiwan University Taipei (Taiwan) b Department of Library and Information Science, National Taiwan University, Taipei (Taiwan)
c Department of International Business, Yu Da University, Miaoli (Taiwan)
This paper uses United States patent classification analysis to study the development of core technologies and key industries in Taiwan over the last 25 years, from 1978 to 2002. After counting the number of Taiwan-held United States granted utility patents, the authors divide the years into three phases: from 1978 to 1994, with less than 500 patents each year; from 1995 to 1999, with 500–2,500 patents each year; from 2000 to 2002, with annual patents greater than 2,500. The results show that for both Taiwan’s core technologies and key industries, there was a great diversity at the first phase, while a mainstream forms and matures at the second and the third phases. However, industrial development at the third phase was more concentrated and focused than previous ones. Overall, Taiwan has clearly moved from a manufacturing-based economy to an innovation-based one, with its focus on high-tech industries during the previous 25 years.
Introduction
With the development of technologies, global economy has transformed from traditional agriculture-based to a knowledge-based one. In this modern society, traditional resources such as raw material, products, and manpower are no longer the only decisive factors to influence a country’s competitiveness. Intellectual properties are increasingly vital, among which knowledge and information are the most prominent elements. Therefore, as we face the highly competitive economic environment in the 21st century, effective information and knowledge management to leverage the power of knowledge economy and create added values has become a very important task. Patent, which represents innovative capability of a nation, is also viewed as a factor in evaluating a country’s leading position. Many world-renown research institutes such as IMD (International Institute for Management Development)1 and WEF (World
Economic Forum)2 view patents as an important indicator in evaluating a country’s
attention to the innovation that patents come to mean and look at these research results as reference to technological policy directions. Karki for one actively promoted the use of patent analysis as a tool in the framing of policies.3 In Taiwan, the government
continues to offer numerous incentive programs to promote high-tech inventions and creations. Meanwhile, many research institutes are devoting efforts to analyzing and evaluating patents, hoping to utilize these innovations or to identify industrial trend for the future.4
Several researches have focused on technological transformation and projection of future trends of a country: Basberg,5 analyzing Norwegian technological changes
through patents; Grupp, Lacasa, and Schmoch,6 trying to understand Germany’s long term evolution in chemistry by patent statistics; Ganguli,7 studying the growth of
patents in India between 1979 and 2002 to evaluate the country’s patent policies; Kung and Lin,8 reviewing number of patents in Taiwan between 1998 and 2002 to study
Taiwan’s innovative potential and to project trends; Ramani and Looze,9 comparing France, Germany, and England in the arena of biotechnology from characteristics of patent application.
In order to analyze the technical development of one country, patent classification, which can aggregate the complex technical information into easy and understandable groups, is one of the most important evaluation sources. It is of particular importance when evaluating a country’s technological activities and identifying new trends, or comparing the development of major technology fields.10 Patents can give a quick
picture of a country’s focused technologies, and are also intertwined with the country’s economic development.11 Since the most important value of a patent lies in its
applicability, all invention patents must be useful, producible and suitable for the industry. As a result, patent classification analysis can not only provide a better understanding of the current situation of a country’s core technologies, but also help to evaluate the potential of a specific or rising industry.12
This research studies patent classification to explore Taiwan’s current patent technology and industrial development. To examine Taiwan’s patent technologies and key industries in a long-term perspective, this study retrieves and compiles Taiwan-held U.S. granted patents over the past 25 years to investigate the major technologies and industries. The study first reviews the history of patents granted in U.S., and groups the developments into several phases for in-depth research. Secondly, the study looks into the history of Taiwan’s core patent technologies and the development of key industries. Finally the study goes into the transformation in these different phases and discusses on the analysis of patent technologies and their applications. Overall, this paper will provide an objective statistic reference for future policy directions through the study of Taiwan’s patent technologies and industrial development.
Methodology – Research design
The data for this study is compiled Taiwan-held U.S. granted patents to further analyze the development of major industries in Taiwan. Apart from studying the numbers of patents and utility patents in different phases, the research also explores the overall development highlights of core patent technologies and key industries, as well as different characteristics and changes in each phase. The scope of data and tools used are explained as follows.
Scope of data
In order to understand Taiwan’s core patent technologies and key industries, our research first compiles Taiwan-held U.S. granted patents, and groups them by number of utility patents granted each year. This initial statistics serves as the basis for further analysis to determine core patent technologies and key industries at different phases. From various types of patents (e.g. utility patent, design patent, plant patent), utility patents can best be described as a country’s innovation and R&D capability.13
Therefore, this study only analyzes utility patents to determine core patent technologies and key industries.
Tools
As our study focuses on patent classification and analysis, the data is selected from the patent database provided by United States Patent and Trademark Office (USPTO) from 1978 to 2002, with Patent Pilot as the analytical software to analyze United States Patent Classification (USPC). Since patent’s class number is based on the application in industries and takes the use and manufacturing factors into consideration,14 it is well
suited for the purpose of this study. To precisely calculate the actual patents, the analysis is carried out using USPC main class, and each patent is categorized into only one specific technology to avoid overlapping. Then, the study uses Concordance between USPC and SIC, (2003.1.8 updated)15 to convert class numbers to applicable
industries, and reviews the development of Taiwan’s key industries. Since one patent technology may be used in more than one industry, overlapping may occur during this type of calculation. These two types of calculation have different implications. The former compiles the technology each patent represents (without overlapping), and ranks the class numbers in the order of the number of utility patents. The latter finds all applicable industries for each patent and thus allows for overlapping.
The following section will first explain Taiwan-held U.S. granted patents over the past 25 years, and examine the evolution in different phases as the basis for further analysis of Taiwan’s core technologies and key industries.
Taiwan-held U.S. granted patents
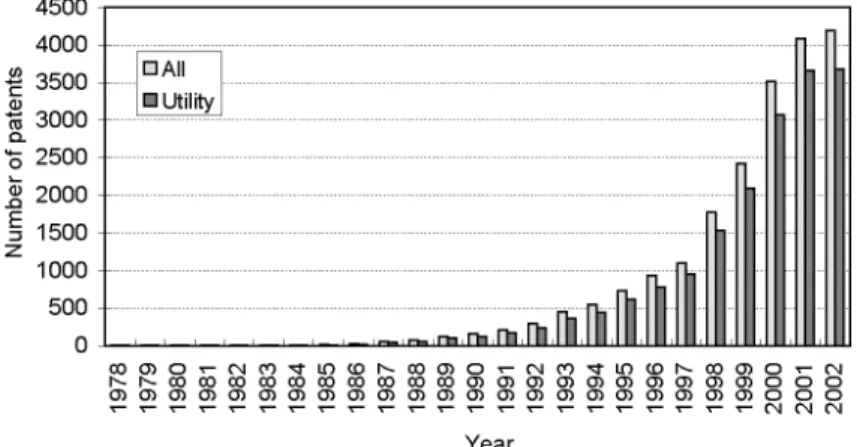
The first Taiwan-held U.S. granted patents was issued in 1978, with six more granted in the very same year. As Taiwan’s research and development capability had grown along the way, the number of U.S. patent increased to over 100 in 1989. The growth rate had increased steadily (From 1988 to 1989 the number increased by 53, showing a growth rate of 74.65%, while utility patent increased by 41 indicating a growth rate of 68.33%). Our statistics shows the total number of Taiwan-held U.S. granted patents during the years from1978 to 2002 is 20,789.
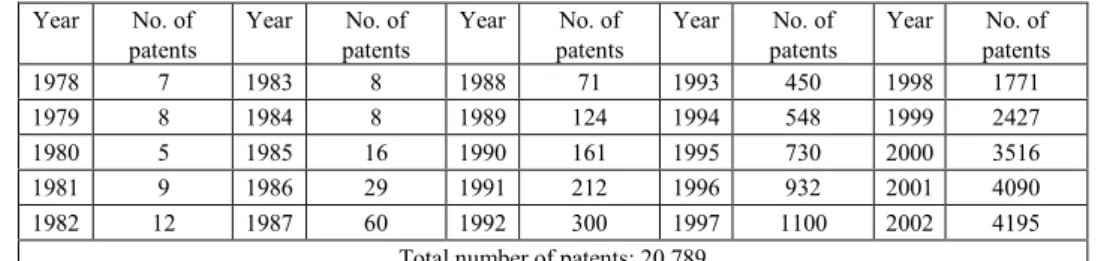
Table 1 shows the number of Taiwan-held U.S. granted patents from 1978 to 2002, which also indicates the continuous growth rate during the past 25 years. The growth is considerable from 1998 to 2002, where the number grew from 1,771 to 4,195, with a growth rate of 137%. This indicates an emphasis on the value of patents, and a desire to protect R&D properties to create more value for industries.
Table 2 shows the compilation of Taiwan-held U.S. granted patents from 1978 to 2002, this number reached 18,012. Except for 1978, over 60% of the patents are utility ones. And after 1993, the percentage is over 80%. This shows our focus is on utility patents, and companies are placing more and more emphasis on innovation and R&D capabilities these patents represent in Taiwan.
Tables 1 and 2 indicate that the Taiwan-held U.S. granted patents until 1980’s, with the focus on utility patents. Figure 1 illustrates the numbers graphically. Aside from a sudden growth from 1997 to 1998 and from 1999 to 2000, the curve continues to climb up during these years.
Table 1. Taiwan-held U.S. granted patents, 1978–2002 Year No. of patents Year No. of patents Year No. of patents Year No. of patents Year No. of patents 1978 7 1983 8 1988 71 1993 450 1998 1771 1979 8 1984 8 1989 124 1994 548 1999 2427 1980 5 1985 16 1990 161 1995 730 2000 3516 1981 9 1986 29 1991 212 1996 932 2001 4090 1982 12 1987 60 1992 300 1997 1100 2002 4195
Total number of patents: 20,789 Data compiled by authors for this study.
Table 2. Taiwan-held U.S. granted utility patents, 1978–2002 Year Patent ratio
(%)
Year Patent ratio (%)
Year Patent ratio (%)
Year Patent ratio (%)
Year Patent ratio (%) 1978 4 (57%) 1983 8 (100%) 1988 60 (85%) 1993 365 (81%) 1998 1534 (87%) 1979 8 (100%) 1984 7 (88%) 1989 101 (81%) 1994 437 (80%) 1999 2096 (86%) 1980 3 (60%) 1985 11 (69%) 1990 121 (75%) 1995 612 (84%) 2000 3074 (87%) 1981 8 (89%) 1986 20 (69%) 1991 168 (79%) 1996 780 (84%) 2001 3656 (89%) 1982 12 (100%) 1987 49 (82%) 1992 237 (79%) 1997 956 (87%) 2002 3685 (88%)
Total number of utility patents: 18,012 Data compiled by authors for this study.
Furthermore, the data show that although there had been U.S. patents granted to Taiwan starting 1978, it was until1995 that the number of utility patents exceeded 500. Since then, the number had grown rapidly. In 2000, over 3,000 patents were granted. In other words, it took seventeen years for the number of utility patents to exceed 500. After that, within five years, the number increased five times to over 2,500. For years after 2000, the number of utility patents has maintained a level of more than 3,000 each year.
With the aim to gain a comprehensive view of technological development path Taiwan’s, this study also divides the 25-year period into 3 phases based on the number of utility patents: phase 1, from 1978 to 1994, with less than 500 patents each year; phase 2, from1995 to 1999, with 500–2,500 patents each year; phase 3, from 2000 to 2002, with more than 2,500 patents each year. The following is an overview of Taiwan’s core patent technologies and key industries, as well as different stages of the development.
Overview of Taiwan’s core patent technologies and key industries
Since patent’s class number is the number assigned to a patent after examining the document, it not only objectively reflects the patent’s technical subjects, but also serves to group similar technologies together. Therefore, analysis of patent classification can
help mapping out important patent technologies over the past 25 years. This study also examines various industries applicable to these patents. This part of analysis is helpful in understanding Taiwan’s innovative strengths, and serves as the basis for framing major industrial and economic policies.
In this study, a core patent technology is defined as a technology with its patent ratio of more than 1%, and a key industry is defined as an industry with its patent ratio of more than 5% (an overlapping may occur among different industries). The following is the overview of Taiwan’s core patent technologies and key industries.
Overview of Taiwan’s core patent technologies
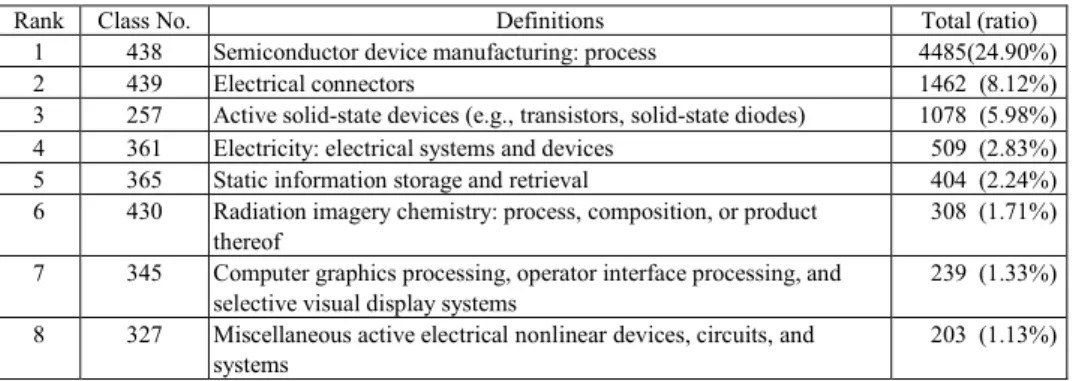
Based on our study, during the past 25 years from 1978 to 2002, the most important patent technologies in Taiwan, starting with the highest number of patents, are Semiconductor device manufacturing: process, Electrical connectors, Active solid-state devices, Electrical systems and devices, Static information storage and retrieval, Radiation imagery chemistry: process, composition, or product thereof, Computer graphics processing, operating interface processing, and selective visual display systems, and Miscellaneous active electrical nonlinear devices, circuits, and systems. These technologies belong to electronic and information industries. The focus in these areas is mostly attributed to government efforts to establish science parks in various parts of the island, and to promote the development of manpower in these areas. Our analysis confirms the success of the policies to create a technology island in Taiwan.
Table 3 summaries the key patent technologies between 1978 and 2002, categorized by patent class numbers. In these class numbers, Semiconductor device manufacturing: process is the major focus, which accounts for 24.9% of total utility patents, far exceeding the second highest group of Electrical connectors (8.12%).
Table 3. Core patent technologies in Taiwan from 1978 to 2002
Rank Class No. Definitions Total (ratio)
1 438 Semiconductor device manufacturing: process 4485(24.90%)
2 439 Electrical connectors 1462 (8.12%)
3 257 Active solid-state devices (e.g., transistors, solid-state diodes) 1078 (5.98%) 4 361 Electricity: electrical systems and devices 509 (2.83%) 5 365 Static information storage and retrieval 404 (2.24%) 6 430 Radiation imagery chemistry: process, composition, or product
thereof
308 (1.71%) 7 345 Computer graphics processing, operator interface processing, and
selective visual display systems
239 (1.33%) 8 327 Miscellaneous active electrical nonlinear devices, circuits, and
systems
203 (1.13%)
This reflects Taiwan’s high emphasis on semiconductors. The total number of utility patents in the eight core patent technologies mentioned previously comprises almost half of the total number of utility patents (48.24%), in which the top three technologies make up nearly 40% of the amount. This indicates that in addition to superior innovation in these areas, these patents also stimulate efforts of research and development in these areas.
Overview of development of Taiwan’s key industries
To analyze the development of Taiwan’s key industries, this study utilizes Concordance Between USPC and SIC by United States Patent and Trademark Office to convert United States Patent Classification to Standard Industrial Classification System, with the purpose to categorize U.S. patents into various classes of industries. With the exception of “All Other SIC’s” and “All Industries”, the concordance groups patent technologies into 12 major industries, where each has at most 4 levels of sub-classes, totaling 55 major and sub-industries. Each class number corresponds to one or more industry categories. Due to this reason, the total number of patents studied would exceed the actual number of utility patents of 18,012.
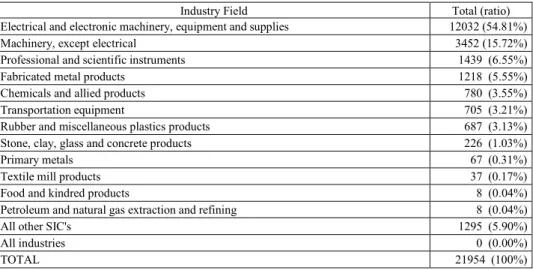
From the analysis, among the 12 major industry fields, most of Taiwan’s patents are focused on electric and electronic industry, except for those that can not be categorized by SIC industries. The ratio of this category is as high as 54.81%, as shown in Table 4.
Table 4. Key industries in Taiwan from 1978 to 2002
Industry Field Total (ratio)
Electrical and electronic machinery, equipment and supplies 12032 (54.81%)
Machinery, except electrical 3452 (15.72%)
Professional and scientific instruments 1439 (6.55%)
Fabricated metal products 1218 (5.55%)
Chemicals and allied products 780 (3.55%)
Transportation equipment 705 (3.21%)
Rubber and miscellaneous plastics products 687 (3.13%)
Stone, clay, glass and concrete products 226 (1.03%)
Primary metals 67 (0.31%)
Textile mill products 37 (0.17%)
Food and kindred products 8 (0.04%)
Petroleum and natural gas extraction and refining 8 (0.04%)
All other SIC's 1295 (5.90%)
All industries 0 (0.00%)
TOTAL 21954 (100%)
Machinery, except electrical, Professional and scientific instruments, and Fabricated metal products are all important industry sectors, but the number of utility patents in these categories is far behind that of Electrical and electronic machinery, equipment and supplies. The areas where the number of utility patents is particularly low include Primary metals, Textile mill products, Food and kindred products, and Petroleum and natural gas extraction and refining. Taiwan’s geographic limitation and the fact that Taiwan lacks natural raw materials bring about disadvantages for these industries.
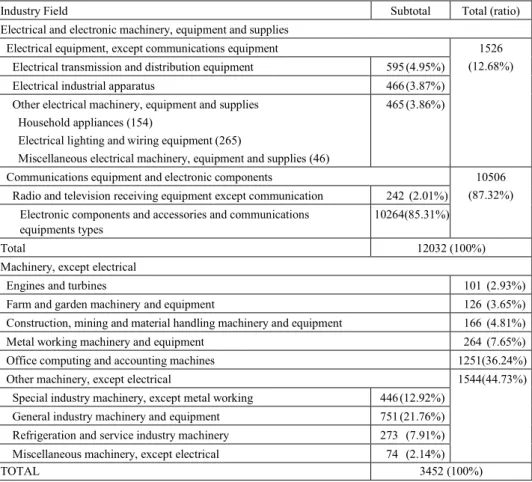
According to the Concordance between USPC and SIC, among the four key industries mentioned above, only industries of Electrical and electronic machinery, equipment and supplies and Machinery, except electrical can be further categorized into various sub-categories. As Table 5 shows, a closer look into these sub-categories reveals Communications equipment and electronic components to have the highest number of utility patents in the industry with a ratio of 87.32%. Under this sub-category, there are 10,264 patents under Electronic components and accessories and communications equipment types, which can then be regarded as the major component of Taiwan’s electrical and electronic industry. In the area of Machinery, except electrical, the highest number of patents is under the sub-category of Office computing and accounting machines, and the major item in other machinery is General industry machinery and equipment.
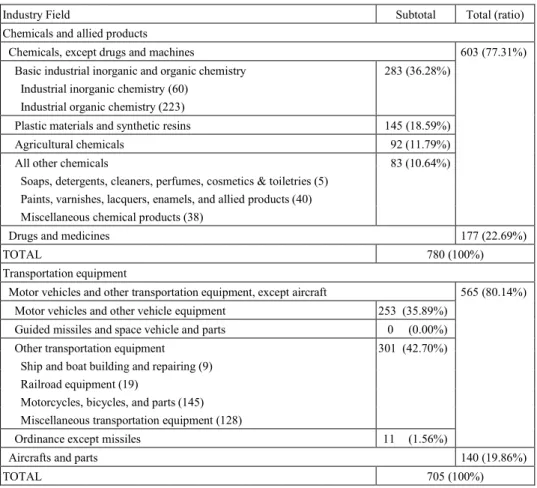
Apart from areas of Electrical and electronic machinery, equipment and supplies, Machinery, except electrical, Professional and scientific instruments, and Fabricated metal products that showed outstanding granted rates, certain other industries also had good performances with over 500 patents. These categories include Chemicals and allied products, Transportation equipment, and Rubber and miscellaneous plastics products, where Chemicals and allied products and Transportation equipment can be further categorized into different sub-categories. As Table 6 indicates, in the Chemical and allied product industry, Taiwan focuses more on basic industrial chemistry and less on consumer products (such as soaps, perfumes and cleaners, etc.). In Transportation equipment, Taiwan places considerable emphasis on land and shipping transportation equipment, and is incompetent in guided missiles and aerospace with 0 patent. Looking into Taiwan’s overall development, although Chemicals and allied products, Transportation equipment, and Rubber and miscellaneous plastics product industries are considered traditional industries with long history in industrial development, the statistics of utility patents between 1978 and 2002 shows these industries still play a key role for Taiwan’s future prosperity. With the government efforts to transform Taiwan into an IT island, the development of these traditional industries must not be overlooked. Identification of the potential of these industries and growing on current assets will help the country to develop and prosper on a more balanced economic foundation.
Table 5. Taiwan-held utility patents in Electrical and electronic machinery, equipment and supplies and Machinery, except electrical industries granted in the U.S., 1978–2002
Industry Field Subtotal Total (ratio)
Electrical and electronic machinery, equipment and supplies Electrical equipment, except communications equipment
Electrical transmission and distribution equipment 595 (4.95%)
Electrical industrial apparatus 466 (3.87%)
Other electrical machinery, equipment and supplies Household appliances (154)
Electrical lighting and wiring equipment (265)
Miscellaneous electrical machinery, equipment and supplies (46)
465 (3.86%)
1526 (12.68%)
Communications equipment and electronic components
Radio and television receiving equipment except communication 242 (2.01%) Electronic components and accessories and communications
equipments types
10264(85.31%)
10506 (87.32%)
Total 12032 (100%)
Machinery, except electrical
Engines and turbines 101 (2.93%)
Farm and garden machinery and equipment 126 (3.65%)
Construction, mining and material handling machinery and equipment 166 (4.81%)
Metal working machinery and equipment 264 (7.65%)
Office computing and accounting machines 1251(36.24%)
Other machinery, except electrical
Special industry machinery, except metal working 446 (12.92%) General industry machinery and equipment 751 (21.76%) Refrigeration and service industry machinery 273 (7.91%) Miscellaneous machinery, except electrical 74 (2.14%)
1544(44.73%)
TOTAL 3452 (100%)
Data compiled from Concordance Between USPC and SIC.
In this study, the author finds Electrical and electronic machinery, equipment and supplies with its technology focus on semiconductor device manufacturing to be the key industry over the last 25 years. Not only because its number of utility patents exceeds others, but becuase the ratio is over 50%. This reflects Taiwan’s industrial structure. To better understand the development of Taiwan’s industries, it is helpful to examine different development stages and important changes in the technological history.
Table 6. Taiwan-held utility patents in Chemicals and allied products and Transportation equipment granted in the U.S., 1978–2002
Industry Field Subtotal Total (ratio)
Chemicals and allied products Chemicals, except drugs and machines
Basic industrial inorganic and organic chemistry Industrial inorganic chemistry (60)
Industrial organic chemistry (223)
283 (36.28%)
Plastic materials and synthetic resins 145 (18.59%)
Agricultural chemicals 92 (11.79%)
All other chemicals
Soaps, detergents, cleaners, perfumes, cosmetics & toiletries (5) Paints, varnishes, lacquers, enamels, and allied products (40) Miscellaneous chemical products (38)
83 (10.64%)
603 (77.31%)
Drugs and medicines 177 (22.69%)
TOTAL 780 (100%)
Transportation equipment
Motor vehicles and other transportation equipment, except aircraft
Motor vehicles and other vehicle equipment 253 (35.89%) Guided missiles and space vehicle and parts 0 (0.00%) Other transportation equipment
Ship and boat building and repairing (9) Railroad equipment (19)
Motorcycles, bicycles, and parts (145) Miscellaneous transportation equipment (128)
301 (42.70%)
Ordinance except missiles 11 (1.56%)
565 (80.14%)
Aircrafts and parts 140 (19.86%)
TOTAL 705 (100%)
Data compiled from Concordance Between USPC and SIC.
Development history of core patent technologies and key industries in Taiwan In addition to compiling the core patent technologies and key industries from 1978 to 2002, this study also goes through different phases of these core patent technologies to gain a thorough understanding of Taiwan’s technological development history. Based on the previously mentioned analysis, the industrial development can be divided into three different phases. The first phase starts from 1978 and ends in 1994, during which the number of utility patents each year was below 500. The second phase begins in 1995 and ends in 1999 when the number of utility patents reached the level of 500 to 2,500 each year. In the third phase from 2000 to 2002, the number of utility patents each year exceeded 2,500. The characteristics of each phase are detailed as follows.
Phase 1: 1978–1994
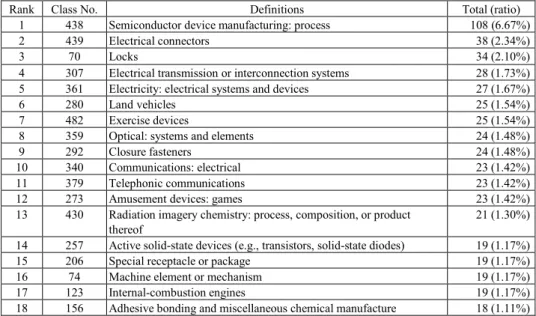
Table 7 compiles core patent technologies between 1978 and 1994 in Taiwan. Technologies during this phase were diverse, including amusement devices, locks, machine elements and mechanisms, internal-combustion engines, hardware materials, and other traditional industrial materials, as well as high tech patents such as electronic and communication devices, optical systems, semiconductors, etc. The percentage of the most concentrated patent class did not exceed 10%. Even the most popular 18 patent technologies adding together only comprised 32.95% of the total utility patents. All these demonstrated a dispersed nature of patents during this phase.
Table 7. Taiwan’s core patent technologies classified by class numbers, 1978–1994
Rank Class No. Definitions Total (ratio)
1 438 Semiconductor device manufacturing: process 108 (6.67%)
2 439 Electrical connectors 38 (2.34%)
3 70 Locks 34 (2.10%)
4 307 Electrical transmission or interconnection systems 28 (1.73%) 5 361 Electricity: electrical systems and devices 27 (1.67%)
6 280 Land vehicles 25 (1.54%)
7 482 Exercise devices 25 (1.54%)
8 359 Optical: systems and elements 24 (1.48%)
9 292 Closure fasteners 24 (1.48%)
10 340 Communications: electrical 23 (1.42%)
11 379 Telephonic communications 23 (1.42%)
12 273 Amusement devices: games 23 (1.42%)
13 430 Radiation imagery chemistry: process, composition, or product thereof
21 (1.30%) 14 257 Active solid-state devices (e.g., transistors, solid-state diodes) 19 (1.17%)
15 206 Special receptacle or package 19 (1.17%)
16 74 Machine element or mechanism 19 (1.17%)
17 123 Internal-combustion engines 19 (1.17%)
18 156 Adhesive bonding and miscellaneous chemical manufacture 18 (1.11%) Data compiled by authors for this study.
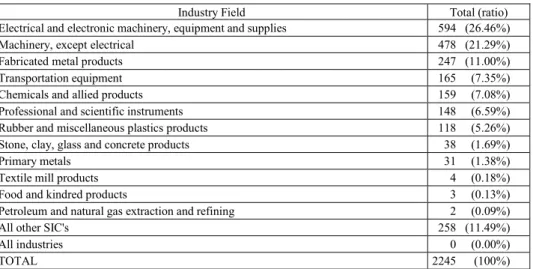
After converting the class numbers into relevant industries, our data shows that in this phase, key industries in Taiwan included Electrical and electronic machinery, equipment and supplies, Machinery, expect electric, Fabricated metal products, Transportation equipment, Chemicals and allied products, Professional and scientific instruments, and Rubber and miscellaneous plastics products. As shown in Table 8, Electrical and electronic machinery, equipment and supplies and Machinery are the top two industries in this period, with ratios of 26.46% and 21.29% respectively. The third ranking industry, Fabricated metal products, though falling quite behind, still passed 10%. Others such as Transportation equipment, Chemicals and allied products, Professional and scientific instruments, and Rubber and miscellaneous plastics products
ranged between 5% and 7%. These are mostly traditional or consumer industries, except for the area of Professional and scientific instruments. Therefore, between 1978 and 1994, Taiwan’s economy was very much diversified. Even though high tech industry had the highest number of utility patents, the traditional industries then were equally important.
Table 8. Patents from key industries in Taiwan from 1978 to 1994
Industry Field Total (ratio)
Electrical and electronic machinery, equipment and supplies 594 (26.46%)
Machinery, except electrical 478 (21.29%)
Fabricated metal products 247 (11.00%)
Transportation equipment 165 (7.35%)
Chemicals and allied products 159 (7.08%)
Professional and scientific instruments 148 (6.59%)
Rubber and miscellaneous plastics products 118 (5.26%)
Stone, clay, glass and concrete products 38 (1.69%)
Primary metals 31 (1.38%)
Textile mill products 4 (0.18%)
Food and kindred products 3 (0.13%)
Petroleum and natural gas extraction and refining 2 (0.09%)
All other SIC's 258 (11.49%)
All industries 0 (0.00%)
TOTAL 2245 (100%)
Data compiled from Concordance Between USPC and SIC.
Phase 2: 1995–1999
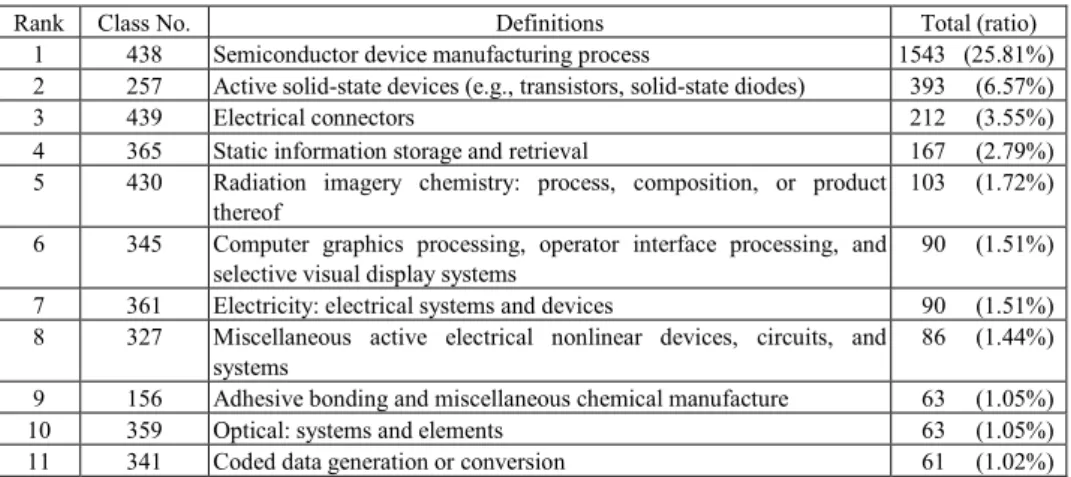
According to Table 9, Semiconductor device manufacturing: process still owns the highest number of patents, and its ratio increases drastically from 6.67% to 25.81%. Examining the definitions of these class numbers finds that most of these core patent technologies are closely related to electrical and electronic, machinery, and Information equipment and supplies. Among these technologies, Semiconductor device manufacturing: process, Active solid state devices, Electrical connectors, Radiation imagery chemistry, and Electrical systems and devices were still of importance during this phase, while certain traditional or consumer industries such as amusement devices, closure fasteners, special receptacle or package were no longer the focus at this time. This marked the beginning of a change in Taiwan’s patent technologies. These patents were becoming more focused, and the trend shifted toward high-tech innovations.
As Table 10 indicates, only four key industries were present during this phase: Electrical and electronic machinery, equipment and supplies, Machinery, except electrical, Professional and scientific instruments, and Fabricated metal products, which suggests major transformation experienced by Taiwan’s key industries.
Table 9. Taiwan’s core patent technologies classified by class numbers, 1995–1999
Rank Class No. Definitions Total (ratio)
1 438 Semiconductor device manufacturing process 1543 (25.81%) 2 257 Active solid-state devices (e.g., transistors, solid-state diodes) 393 (6.57%)
3 439 Electrical connectors 212 (3.55%)
4 365 Static information storage and retrieval 167 (2.79%) 5 430 Radiation imagery chemistry: process, composition, or product
thereof
103 (1.72%) 6 345 Computer graphics processing, operator interface processing, and
selective visual display systems
90 (1.51%) 7 361 Electricity: electrical systems and devices 90 (1.51%) 8 327 Miscellaneous active electrical nonlinear devices, circuits, and
systems
86 (1.44%) 9 156 Adhesive bonding and miscellaneous chemical manufacture 63 (1.05%)
10 359 Optical: systems and elements 63 (1.05%)
11 341 Coded data generation or conversion 61 (1.02%)
Data compiled by authors for this study.
Table 10. Patents from key industries in Taiwan from 1995 to 1999
Industry Field Total (ratio)
Electrical and electronic machinery, equipment and supplies 3866 (52.59%)
Machinery, except electrical 1188 (16.16%)
Professional and scientific instruments 516 (7.02%)
Fabricated metal products 386 (5.25%)
Chemicals and allied products 315 (4.29%)
Rubber and miscellaneous plastics products 255 (3.47%)
Transportation equipment 226 (3.07%)
Stone, clay, glass and concrete products 82 (1.12%)
Primary metals 23 (0.31%)
Textile mill products 15 (0.20%)
Food and kindred products 4 (0.05%)
Petroleum and natural gas extraction and refining 2 (0.03%)
All other SIC's 473 (6.43%)
All industries 0 (0.00%)
TOTAL 7351 (100%)
Data compiled from Concordance Between USPC and SIC.
Among these industries, Professional and scientific instruments showed a rapid growth and became the third ranking industry. The top three industries were all high-tech industries. Electrical and electronic machinery, equipment and supplies still took the lead, and the ratio grew from 26.46% to 52.59%, showing a two-fold growth rate. With the exception of Machinery, expect electric and Fabricated and allied metals, the changes in the rest of the industries were lower than 5%. It is clear that in this phase, Taiwan’s key industries had become more concentrated, and the development had been directing toward the high-tech industry.
Phase 3: 2000–2002
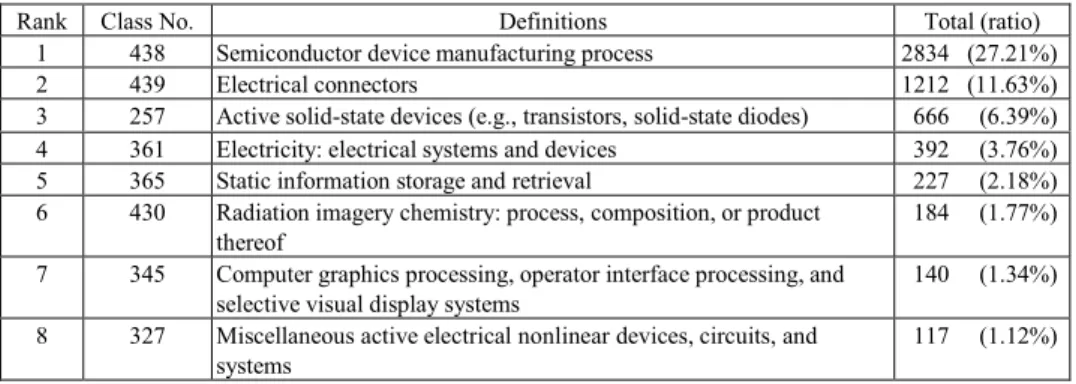
Our statistics shows between 2000 and 2002, the core patent technologies are concentrated on electrical and electronic, machinery, and information technologies. The core technologies have now been narrowed down to 8, with a ratio of 55.4%. In other words, among the Taiwan-held U.S. granted utility patents during this time, over half of them are among these 8 industries, including Semiconductor device manufacturing: process, Electrical connectors, Active solid-state devices, Electrical systems and devices, Static information storage and retrieval, Radiation imagery chemistry: process, composition, and product, Computer graphics processing, operator interface processing, and selective visual display systems, Optical: systems and elements, and Miscellaneous active electrical nonlinear devices, circuits, and systems, as given in Table 11. Actually, these 8 patent technologies are also the top 8 technologies between 1995 and 1999, and all had similar ranking, with the exception of Electrical connectors and Electrical systems and devices that showed growth. Therefore, the data show these patent technologies are consistently growing now. Semiconductor device manufacturing: process is still in the leading position. Overall, the industries were more focused on high-tech development, showing a more concentrated quality.
Table 11. Taiwan’s core patent technologies classified by class numbers, 2000–2002
Rank Class No. Definitions Total (ratio)
1 438 Semiconductor device manufacturing process 2834 (27.21%)
2 439 Electrical connectors 1212 (11.63%)
3 257 Active solid-state devices (e.g., transistors, solid-state diodes) 666 (6.39%) 4 361 Electricity: electrical systems and devices 392 (3.76%) 5 365 Static information storage and retrieval 227 (2.18%) 6 430 Radiation imagery chemistry: process, composition, or product
thereof
184 (1.77%) 7 345 Computer graphics processing, operator interface processing, and
selective visual display systems
140 (1.34%) 8 327 Miscellaneous active electrical nonlinear devices, circuits, and
systems
117 (1.12%)
Data compiled by authors for this study.
Examining the development of Taiwan’s patents in terms of industry categories, the concentration on high tech industries is becoming more and more evident. Taiwan’s key industries are now concentrated on Electrical and electronic machinery, Machinery, except electrical, and Professional and scientific instruments, as given in Table 12. Among these, Electrical and electronic machinery still has its highest rank at 61.27%, far surpassing all the other industries. Compared to the previous phase (1995–1999), only electrical and electronic machinery continues to grow, while all the others decline. It seems that electrical and electronic machinery industry serves as powerful magnet that attracts tremendous research and development endeavors to become a star industry.
As for the rest of the industries, the increased number of patents still does not drive up its ratio.
Table 12. Patents from key industries in Taiwan from 2000 to 2002
Industry Field Total (ratio)
Electrical and electronic machinery, equipment and supplies 7572 (61.27%)
Machinery, except electrical 1786 (14.45%)
Professional and scientific instruments 775 (6.27%)
Fabricated metal products 585 (4.73%)
Transportation equipment 314 (2.54%)
Rubber and miscellaneous plastics products 314 (2.54%)
Chemicals and allied products 306 (2.48%)
Stone, clay, glass and concrete products 106 (0.86%)
Textile mill products 18 (0.15%)
Primary metals 13 (0.11%)
Petroleum and natural gas extraction and refining 4 (0.03%)
Food and kindred products 1 (0.01%)
All other SIC's 564 (4.56%)
All industries 0 (0.00%)
TOTAL 12358 (100%)
Data compiled from Concordance Between USPC and SIC.
Analysis of patent classification for Taiwan-held U.S. granted utility patents between 1978 and 2002 shows that in these three different phases (1978–1994, 1995–1999, and 2000–2002), five core patent technologies had kept appearing in each phase. They were: Semiconductor device manufacturing: process, Electrical connectors, Active solid-state devices, Electrical systems and devices, and Radiation imagery chemistry: process, composition, or product thereof. This means the success of today has resulted from solid foundation built in the past and continuous efforts engaged along the way. Therefore, the government must first understand previous research and development efforts dedicated to the field when planning key industry-related policies in order to identify industries with highest potential and to continuously devote resources to them.
Taiwan’s core patent technologies and changes in industries
This study shows that Semiconductor device manufacturing: process has constantly held a leading position as the major patent technology, while other core patent technologies and key industries differed in each phase. A detailed comparison among these phases and that to the overall outlook for these 25 years will map out the important transformation in these phases.
Comparisons of core patent technologies and key industries over the past 25 years are shown in Table 13 and 14 respectively. Table 13 shows a gradual decline of items of core patent technologies, dropping from the initial number of 19 down to 11 and ended with 8 at the final phase. However, number of patents has grown continuously, from the initial percentage of 32.95% to 48.02% and ended with 55.4% at the final phase. These figures indicate a growing concentration of utility patents on fewer key technologies, with the tendency of moving toward the goal of specialization.
Table 13. Comparison of Core Patent Technologies in Taiwan in 4 phases from 1978 to 2002 1978–1994 Core Patent Technologies
(1) Semiconductor device manufacturing: process; (2) Electrical connectors;
(3) Locks;
(4) Electric transmission or interconnection systems; (5) Electricity: electrical systems and devices; (6) Land vehicles;
(7) Exercise devices;
(8) Optical: systems and elements; (9) Closure fasteners;
(10) Communications: electrical; (11) Telephonic communications; (12) Amusement devices: games;
(13) Radiation imagery chemistry: process, composition, or product thereof; (14) Active solid-state devices (e.g., transistors, solid-state diodes); (15) Special receptacle or package;
(16) Machine element or mechanism; (17) Internal combustion engines;
(18) Adhesive bonding and miscellaneous chemical manufacture; (19) Miscellaneous metal.
Ratio: 32.95%
1995–1999 Core Patent Technologies (1) Semiconductor device manufacturing: process;
(2) Active solid-state devices (e.g., transistors, solid-state diodes); (3) Electrical connectors;
(4) Static information storage and retrieval;
(5) Radiation imagery chemistry: process, composition, or product thereof;
(6) Computer graphics processing, operator interface processing, and selective visual display systems; (7) Electricity: electrical systems and devices;
(8) Miscellaneous active electrical nonlinear devices, circuits, and systems; (9) Adhesive bonding and miscellaneous chemical manufacture;
(10) Optical: systems and elements; (11) Coded data generation or conversion.
Table 13. (continued)
2000–2002 Core Patent Technologies (1) Semiconductor device manufacturing: process;
(2) Electrical connectors;
(3) Active solid-state devices (e.g., transistors, solid-state diodes); (4) Electricity: electrical systems and devices;
(5) Static information storage and retrieval;
(6) Computer graphics processing, operator interface processing, and selective visual display systems; (7) Radiation imagery chemistry: process, composition, or product thereof;
(8) Miscellaneous active electrical nonlinear devices, circuits, and systems. Ratio: 55.40%
1978–2002 Core Patent Technologies (1) Semiconductor device manufacturing: process;
(2) Electrical connectors;
(3) Active solid-state devices (e.g., transistors, solid-state diodes); (4) Electricity: electrical systems and devices;
(5) Static information storage and retrieval;
(6) Computer graphics processing, operator interface processing, and selective visual display systems; (7) Radiation imagery chemistry: process, composition, or product thereof;
(8) Miscellaneous active electrical nonlinear devices, circuits, and systems. Ratio: 48.24%
Note: The numbers in parenthesis are the ranking of each technology, and ratio is the percentage from total utility patents.
Data compiled by authors for this study.
The core patent technologies also map out the changes in the technological development in Taiwan. From 1978 to 1994, core patent technologies included not only high tech areas such as semiconductors, electrical and electronic machinery, and telecommunication, but also some very traditional industries such as locks, exercise and amusement devices, packaging materials, and miscellaneous hardware materials. The industrial sectors were highly diversified during this phase. From 1995 and 1999, technologies started to move toward high-tech sectors. Originally prominent traditional and consumer patent technologies gradually declined, while newly rising technologies such as Static information storage and retrieval, and Computer graphics processing, operator interface processing and selective visual display systems gained spotlights at this time, suggesting a phase of technological transformations. From 2000 to 2002, core patent technologies were similar to the previous phase, showing a stable and continuous growth in these technologies.
Table 14. Comparison of Key Industries in Taiwan in 4 phases, 1978–2002 1978–1994
Key Industries (1) Electrical and electronic machinery, equipment and supplies; (2) Machinery, except electrical;
(3) Fabricated metal products; (4) Transportation equipment; (5) Chemicals and allied products; (6) Professional and scientific instruments; (7) Rubber and miscellaneous plastic products.
Ratio: 85.03%
1995–1999 Key Industries (1) Electrical and electronic machinery, equipment and supplies; (2) Machinery, except electrical;
(3) Professional and scientific instruments; (4) Fabricated metal products.
Ratio: 81.02%
2000-2002 Key Industries (1) Electrical and electronic machinery, equipment and supplies; (2) Machinery, except electrical;
(3) Professional and scientific instruments.
Ratio: 81.99%
1978-2002 Key Industries (1) Electrical and electronic machinery, equipment and supplies; (2) Machinery, except electrical;
(3) Professional and scientific instruments; (4) Fabricated metal products.
Ratio: 82.63%
Note: Numbers in the parenthesis are the rankings of the patent technologies, and ratio is the percentage to total Taiwan-held U.S. granted utility patents during that period.
Data compiled by authors for this study.
From Table 14, it is clear that the key industries in Taiwan varied in different time period. From 1978 to 1994, Electrical and electronic machinery, equipment and supplies, Machinery, expect electrical, Fabricated metal products, Transportation equipment, Chemical and allied products, Professional and scientific instruments, Rubber and miscellaneous plastic products were the key industries, and patent technologies were diversified. From 1995 to 1999, Taiwan’s industries underwent a process of changes. Key industries began to narrow to high-tech ones, and traditional and consumer industries were not as important as they used to be (such as Transportation equipment, Chemicals and allied products, Rubber and miscellaneous
plastics products). From 2000 to 2002, Taiwan’s key industries were even more focused on Electrical and electronic machinery, equipment and supplies, Machinery, except electrical, and Professional and scientific instruments. The industries were moving toward a more specialized and precision-oriented dimension.
Comparing individual phase to the overall outlook, parallelism exists during the period between 1995 and 1999, which means the key industries of these two were the same. However, from the individual phase, items of the key industries have changed, which Fabricated metal products was once a key industry but its importance has been declining afterward. This circumstance could not be observed if one just calculates the number of patents overall. Therefore, for future study of patent technology development, one still needs to study both overall and different time periods simultaneously for a more comprehensive understanding.
A closer comparison of the key industries in different phases will find these industries have transformed indeed. As Figure 2 shows, among those listed as the top 7 key industries from 1978 to 2002, only Electrical and electronic machinery, equipment and supplies climb up steadily, while the rest fluctuate. In all phases, Electrical and electronic machinery, equipment and supplies has always been ranked number one with highest ratios. Still, with time, this industry had gradually become more focused. It had become the most important industry in Taiwan after the period of 1994–1999.
In short, Taiwan had shifted from diversification to specialization, and from a dispersed to a concentrated industry character. Each phase is characterized by respective nature of change.
Stage of diversification (1978–1994)
No matter it’s from the perspective of patent technologies or industries, the early development stage in Taiwan is the one with diversity. From the number of utility patents, there were already some focus areas, but the ratios for each category were still low at this stage. Technology types were also too diversified to draw similarities. Stage of formation of mainstream industries (1995–1999)
In patent technologies and industries, Taiwan faces important changes during this time. Standing at the crossroad, Taiwan decided to leave traditional industries and technologies behind, and chose electrical and electronic industries as frontiers. From the viewpoint of patent technologies, Taiwan shows a strong willpower in driving up the number of utility patents to obtain the in-depth knowledge required for leading the market. This transforming stage has had profound influence on later development of patent technology and industries.
Stage of stable growth (2000–2002)
As shown from earlier analysis, Taiwan from 2000 to 2002 concentrated on developing electrical and electronic industries. Earlier comparisons also show this period to be mature and steadily growing. This period is marked by continuously developing the key industries and core patent technologies.
Hence, Taiwan has moved from a diversified period of developing both traditional and high tech industries to the one of key industries formation, and subsequently the one of continuous growth for these key industries. This demonstrates Taiwan’s innovation and flexibility in facing different environments, and proves that Taiwan’s economic structure can respond to changes over time to achieve further success.
Conclusion
As an effective way to protect intellectual properties and symbol of technological innovation and competitiveness, patent data have become the focus of research recently. The uniqueness of the information in patent documents and its implication for industrial applications make patents an excellent tool to understand the development of a
country’s knowledge-based economy. After analysis of patent classification from the Taiwan-held U.S. granted utility patents between 1978 and 2002, with focus on the development of Taiwan’s technological industries, the study has reached the following conclusions:
1. The number of patents shows continued growth with an emphasis on utility patents.
According to this research, from the very first U.S. granted patent in 1978, the number of patents has grown each year. 1989 marked the first time the figure exceeds 100, and is the point when the patent growth rate drastically increased. From 1998 to 2002, number of patents increases from 1,771 to 4,195, with a growth rate of 137%. During these 25 years, with the exception of 1978, over 60% of these patents are utility patents, indicating Taiwan-held U.S. granted patents are mostly focused on inventions rather than industrial designs, and corporations in Taiwan are focusing more on the innovation and development capability these patents represent.
2. Taiwan’s core patent technologies are mainly focused on electrical, electronic, optical and information sectors.
Our analysis of patent classification indicates the major patent technologies in Taiwan are mostly related to electrical, electronic, optical and information technologies, including Semiconductor device manufacturing: process, Electrical connectors, Active solid-state devices, Electrical systems and devices, Static information storage and retrieval, Radiation imagery chemistry: process, composition, or product thereof, Computer graphics processing, operating interface processing, and selective visual display systems, and Miscellaneous active electrical nonlinear devices, circuits, and systems, etc., among which Semiconductor device manufacturing: process is the most important focus. Additionally, the high concentration of patents on these categories suggests high innovative energies.
3. Electrical and electronic, machinery, and professional and scientific instruments predominate Taiwan’s key industries.
The focused industries in Taiwan over the past 25 years include Electrical and electronic machinery, equipment and supplies, Machinery, except electrical, Professional and scientific instruments, and Fabricated metal products, among which Electrical and electronic machinery, equipment and supplies is the strongest one. Number of patents in this area has surpassed all other categories between 1995 and 1999. In Machinery, except electrical, Professional and scientific instruments, and Fabricated metal products, although the number of utility patents is substantial, these numbers are still declining gradually and fading into the background in comparison to electrical and electronic industry.
4. The study of key technologies and industries must include closer examination on different development stages, as well as the overall picture.
Our research points to different changes taking place in the development of patent technologies and key industries over the last 25 years. Initially, there is equal emphasis on traditional and high-tech industries. Later, the direction of the country’s R&D emphasis becomes more certain and focused, which led to the high concentration of definite industries with steady growth. Simple analysis of the number of utility patents would not provide detailed insight into these changes, and may lead to overlooking of some of the arenas that have been developed at an early stage. Through close observation of different phases, we can have a more accurate view of Taiwan’s technological development.
5. Analysis of patent classification gives comprehensive insight into the innovative industries in Taiwan.
Detailed comparison of core patent technologies and key industries to the overall development shows while the patent technologies in the last 3 years accurately reflect the industrial development over the past 25 years, key industry analysis has different conclusions. This discrepancy comes from the fact that analysis methods are different. For the former, the patent technologies are chosen according to the number of utility patents, while the boundaries between the patents are broken for the latter and each patent is listed in all industries it can be applied to. By looking at these technologies from applicable industries, one can clearly see the capacity for innovation, as well as the bigger picture of a country’s industrial development.
The analysis in this study reveals three important conclusions in terms of development, including:
1. Emphasis on high-tech industries: Industries with highest number of patents center on the high-tech area. Whether it’s from the perspective of patent classes or from that of industrial field, it shows that Taiwan has regarded high technology as its core for technology and industry development.
2. High concentration of technologies and industries on certain arenas: Among the core patent technologies over the past 25 years, the number of utility patents in semiconductor device is much higher than that of other categories form the perspective of technology, whereas that of Electrical and electronic machinery, equipment, and supplies is also higher from the perspective of industry. Clearly, Taiwan’s industrial development relies heavily on electrical and electronic industries, with an emphasis on semiconductor devices.
3. Replacing manufacturing with R&D: Taiwan has moved from traditional OEM formats to actively getting involved in research and development of important technologies. This transformation indicates the maturity of technologies and the success of Taiwan’s attempt to rebuild its industrial structure.
In conclusion, although Taiwan’s industrial structure possesses innovative capacity and high-tech competitiveness, the high concentration on certain areas may affect the development of other potentially successful industries. When government considers
major industrial policies, it is imperative not only to maintain current leading position in these already successful areas but also broaden the scope to diversify into other industries in order to build strong foundation for future prosperity.
*
The partial financial support from Chung Hua Institution for Economic Research for this work is gratefully appreciated.
References
1. INTERNATIONAL INSTITUTE FOR MANAGEMENT DEVELOPMENT. 2002. The world competitiveness yearbook – list of criteria. http://www01.imd.ch/wcy/criteria/
2. P.K.CORNELIUS. 2003. Executive summary.
http://www.weforum.org/pdf/gcr/GCR_2002_2003/GCR_Executive_Summary_2002_03.pdf
3. M. M. S.KARKI, Patent citation analysis: A policy analysis tool, World Patent Information, 19 (4) (1997) 269–272.
4. W. L. HSIA, The value of patent on industrials. Intellectual Property Management, 16 (1998) 20–21. (In Chinese).
5. B. L.BASBERG, Patent Statistics and the measurement of technological change: An assessment of the Norwegian patent data, 1840–1980. World Patent Information, 6 (4) (1984) 158–164.
6. H.GRUPP,I. D.LACASA,U.SCHMOCH, Tracing technological change over long periods in Germany in chemicals using patent statistics. Scientometrics, 57 (2) (2003) 175–195.
7. P. GANGULI, Patents and patent information in 1979 and 2004: A perspective from India. World Patent Information, 26 (2004) 61–62.
8. M. H. KUNG, H. Y. LIN, The dynamics of innovation in Taiwan: the patent analysis respective. In: PAUL S. C. HSU (Chair), International Conference on 2003 Industrial Science and Technology Innovation: Policy Issues and Challenges in a Critical Era, Taipei, Taiwan, 2003.
9. S. V.RAMANI, M. A. D. LOOZE, Country-specific characteristics of patent applications in France, Germany and the UK in the biotechnology sectors. Technology Analysis & Strategic Management, 14 (4) (2002) 457–480.
10. H. Y. LIN, H. W. LIN, From imitation to innovation: the study of patents from Taiwan. Taiwan Economic Research Monthly, 25 (5) (2002) 23–35. (In Chinese).
11. OECD. 2004. Patents and Innovation: Trends and Policy Challenges.
http://www.oecd.org/dataoecd/48/12/24508541.pdf
12. H. Y. LIN, The forecasting and evaluation of emerging industrial technology: the application of USPTO databank. Taiwan Economic Research Monthly, 26 (2) (2003) 69–81. (In Chinese).
13. D. Z. CHEN, M. H. HUANG, Patent Information and Retrieval, 2nd ed., Mandarin Library & Information Services Co, Taipei, 2003. (In Chinese).
14. L. FALASCO, Bases of the United States Patent Classification. World Patent Information, 24 (2002) 31–33.
15. UNITED STATES PATENT AND TRADEMARK OFFICE. 2003.1.8 updated. Concordance between USPC and SIC.