Role of Hypolipidemic Drug Clofibrate in Altering Iron Regulatory
Proteins IRP1 and IRP2 Activities and Hepatic Iron Metabolism
in Rats Fed a Low-Iron Diet
Hui-Ling Huang and Ning-Sing Shaw
Department of Agricultural Chemistry, National Taiwan University, Taipei, Taiwan
Received September 10, 2001; accepted January 23, 2002
Role of Hypolipidemic Drug Clofibrate in Altering Iron Regu-latory Proteins IRP1 and IRP2 Activities and Hepatic Iron Me-tabolism in Rats Fed a Low-Iron Diet. Huang, H.-L., and Shaw, N.-S. (2002). Toxicol. Appl. Pharmacol. 180, 118 –128.
In addition to reducing the expression of transferrin and ceru-loplasmin genes, hypolipidemic peroxisome proliferators may al-ter iron homeostasis in the liver. Therefore, this study investigates the effects of clofibrate on proteins related to liver iron metabolism in a rat model using a 2ⴛ 2 experimental design: two dose levels of clofibrate in diet (0 and 0.5%) and two dietary iron levels (35 ppm as normal level and 15 ppm as low-iron diet). Twenty-four Wistar rats were assigned to the four diets and fed for 6 weeks. Subsequent measurements of iron parameters in the blood and the liver indicated that, in addition to mild anemia and the reduction in serum iron and total iron-binding capacity, clofibrate treatment altered IRP1 and IRP2 activities differentially and increased mitochondrial aconitase both at activity and protein levels. At both normal and low-iron intakes, clofibrate caused a 50% reduc-tion in serum iron and TIBC with a corresponding reducreduc-tion in transferrin mRNA. The RNA-binding activities of IRP1 were selectively activated by clofibrate treatment even though liver iron concentration was not depleted. The RNA-binding activity of IRP2 was selectively activated by the low iron intake and corre-lated with an increase of transferrin receptor mRNA, while clofibrate treatment offset the effects of the low iron intake. © 2002 Elsevier Science (USA)
Key Words: clofibrate; iron regulatory proteins; mitochondrial
aconitase; transferrin receptor; rats.
Fibrates such as clofibrate, fenofibrate, and gemfibrozil are
an established class of drugs for treating hypertriglyceridemia
and combined hyperlipidemia. Fibrates are peroxisome
prolif-erators (PPs), which cause hepatomegaly, proliferation of
per-oxisomes, and induction of many enzymes involved in
-oxi-dation and
-oxidation of fatty acids in rodents (Schoonjans et
al., 1996). Although incapable of inducing peroxisome
prolif-eration in humans, fibrates alter the expression of enzymes
regulating serum cholesterol and lipid homeostasis (Auwerx,
1992; Schoonjans et al., 1996).
PPs also caused transcriptional repression in the liver. Genes
down-regulated by PPs include those related to lipid
metabo-lism, such as apoE, apoAI, apo AIV, and apo CIII (Schoonjans
et al., 1996), and those not obviously involved in lipid
ho-meostasis, such as transferrin (Tf) (Hertz et al., 1996),
cerulo-plasmin (Cp), and P-type ATPase 7B (ATP7B) (Eagon et al.,
1999). Transferrin is highly expressed in the adult mammalian
liver and is secreted by hepatocytes into the serum, where it
functions as an iron-transport protein (Crichton and
Charlo-teaux-Wauters, 1987). A lack of transferrin causes iron
accu-mulation in the liver (Hayashi et al., 1993). Meanwhile,
ceru-loplasmin is a copper-containing serum protein exhibiting
ferroxidase activity, which accelerates the incorporation of iron
into apotransferrin (Harris et al., 1999). Aceruloplasminemic
subjects (Harris, 1998) and Cp-null mice (Harris et al., 1999)
have marked iron accumulation in hepatocytes and
reticuloen-dothelial cells.
At the cellular level, iron storage and uptake are
coordi-nately regulated posttranscriptionally by interactions between
cytoplasmic factors, iron regulatory proteins 1 and 2 (IRP1 and
IRP2), and the cis-regulating iron-responsive element (IRE)
located in the 3
⬘-untranslated region (UTR) of transferrin
re-ceptor (TfR) mRNA as well as in the 5
⬘-UTRs of mRNAs for
ferritin, mitochondrial aconitase (m-ACO), and
erythroid-spe-cific 5-aminolevulinic acid synthase (Hentz and Ku¨hn, 1996).
When cellular iron becomes limiting, IRP1 is recruited into the
high-affinity binding state, and IRP2 is synthesized in active
form. The binding of IRPs to the IRE in the 5
⬘-UTR represses
the translation of ferritin and m-ACO, while an association of
IRPs with IREs in the 3
⬘-UTR stabilizes the TfR mRNA
transcript. On the other hand, the expansion of the labile iron
pool causes IRP1 inactivation and IRP2 degradation to result in
an efficient translation of ferritin and m-ACO mRNA and rapid
degradation of TfR mRNA.
Powanda et al. (1978) were probably the first to describe the
effects of clofibrate on iron and copper metabolism; serum Tf
concentration and Cp ferroxidase activity were both reduced
after 1 week of treatment, while the concentration of hepatic
iron increased, but no copper accumulation occurred.
Mean-while, Hertz et al. (1996) demonstrated that other fibrate
com-1180041-008X/02 $35.00 © 2002 Elsevier Science (USA) All rights reserved.
pounds caused a 50% reduction of serum iron and total
iron-binding capacity (TIBC), corresponding to a reduced Tf
mRNA level in rat as well as in a hepatoma cell line. PPs also
caused a reduction of liver Cp and ATP7B mRNA and serum
Cp activity (Anderson et al., 1999; Eagon et al., 1999). In
contrast to the outcome of 1 week of treatment (Powanda et al.,
1978), clofibrate caused a 3.3-fold increase of liver copper, but
did not affect liver iron after a 60-day exposure (Eagon et al.,
1999).
Adverse outcomes associated with fibrate treatment include
hepatotoxicity and anemia. Abnormal liver function tests
includ-ing elevation of serum glutamate oxaloacetate transaminase
(GOT) and glutamate pyruvate transaminase (GPT) have occurred
during fibrate administration (Sirtori et al., 1992). Increases to
more than three times the upper limit of normal values have been
recorded in controlled multiple-dose trials of fenofibrate
(Schre-fer, 2001). As for anemia, mild to moderate reduction of
hemo-globin and hematocrit has been documented. In The Coronary
Drug Project (The Coronary Drug Project Research Group, 1975),
the clofibrate treatment group recorded a significant lowering of
hematocrit (Hct) values (from 46 to 44.8%) compared to the
placebo group (from 46.2 to 45.9%) and an elevated prevalence of
anemia indicated by abnormal hematocrit values (Hct
⬍ 38%, 7.9
vs 4.1%; Hct
⬍ 36%, 3.4 vs 1.7%) after 5 years of follow-up.
Therefore, we hypothesized that the onset of PP-induced anemia
may depend on dietary iron level and that PP may alter hepatic
iron homeostasis. Consequently, we investigated the effect of
clofibrate on iron status, hepatic IRP activities, and the expression
of hepatic ferritin, TfR, and m-ACO in rats fed a semisynthetic
low-iron diet.
MATERIALS AND METHODS
Chemicals. The following chemicals were used: Clofibrate (ethyl 2-(4-chlorophenoxy)-2-methylpropionate) (Fluka Chemie, Germany), Serum iron/ UIBC kit and Serum Copper kit (RANDOX, Antrim, UK), horseradish per-oxidase-conjugated goat anti-rabbit IgG (Vectastain, Vector Laboratories), PVDF transfer membrane (PolyScreen, NEN Life Science, Boston, MA), ␣-[32
P]CTP (3000 Ci/mmol or 111 TBq/mmol, NEN–DuPont, Boston, MA), positively charged nylon membrane for hybridization, GeneScreen Plus (NEN Life Science), X-OMAT AR film and Bio-Max film (Kodak), reagents for in vitro transcription, DNA labeling kit, CTP4A Western blotting kit, ECL Western blotting detection system, and Micro Spin G-50 column (Amersham Pharmarcia Biotech Inc.). Other chemicals were obtained from Sigma Chem-ical Co. (St. Louis, MO) and Merck (Taiwan).
Animals and treatment. Twenty-four weanling, male Wistar rats (Labo-ratory Animal Center, College of Medicine, National Taiwan University), weighing 148⫾ 10 g, were housed individually in stainless-steel cages with wire-mesh floors in a temperature-, humidity-, and light-controlled room. Animal care and handling conformed to the NSC Guide for the Care and Use of Laboratory Animals (National Science Council, 1993). The basal diet was AIN-76 formula (AIN, 1977) modified to contain 15% soybean oil (Table 1). Rats (six each group) were assigned to the four diets with treatment of clofibrate (0 and 0.5%) and dietary iron levels (35 and 15 ppm) in 2⫻ 2 experimental design. The 35 ppm Fe is the normal dietary level for rats, while the 15 ppm Fe is a suboptimal level that will deplete liver Fe store and may cause mild anemia (Chen et al., 1997). Food and deionized water were freely available. After 42 days of dietary treatment, rats were killed by carbon dioxide
asphyxiation, and blood and liver were collected for analysis. Serum was separated by low-speed centrifugation and was frozen at⫺70°C until analyzed. Blood analyses. Hemoglobin concentration was determined by the cyan-methemoglobin method using Drabkin’s solution (Oser, 1965). Serum iron and TIBC were determined using the serum iron/UIBC kit. Serum copper was determined using the Serum Copper kit. Serum ceruloplasmin was assessed as ferroxidase activity by measuring the oxidation of o-diansidine dihydrochlo-ride, and one unit of activity was defined as oxidation of 1mol substrate per minute (Schosinsky et al., 1974).
Liver Fe and Cu. Fractions of liver were digested with nitric acid and hydrogen peroxide in a microwave digestion oven (Milestone, Microwave Laboratory System, Italy). Iron and copper were measured by atomic absorp-tion spectrometry (Hitachi 180-30). The steady concentraabsorp-tion of desferriox-amine (DFO)-chelatable iron was measured by electron paramagnetic reso-nance spectroscopy (EPR) as described by Cairo et al. (1995) and Yegorov et al. (1993). Briefly, 0.05 ml of 10 mM desferrioxamine mesylate was added to 0.5 ml of liver homogenate (50% w/v in 20 mM Tris–HCI and 135 mM KCl, pH 7.4), incubated at room temperature for 20 min, and then placed in a quartz tube, frozen in liquid nitrogen, and stored at ⫺70°C before analysis. EPR spectra were recorded on a Brucker 200 spectrometer (NTHU Instrument Center, National Tsing Hua University, Hsin-chu, Taiwan) at liquid nitrogen temperature under the following conditions: Klystron frequency, 9.12 GHz; power, 20 mW; modulation amplitude, 2.0 mT. The intensity of the EPR signal at g⫽ 4.3 was measured to estimate DFO-chelatable Fe concentration. A calibration plot was obtained by adding to a series of control homogenate incremental volumes of a freshly prepared FeSO4solution of predetermined concentration, and the homogenate was treated as described above.
Preparation of cellular fractions. Liver cytosol, mitochondria, and mi-crosome were obtained by differential centrifugation modified from Chen et al. (1997). Liver homogenate (25% w/v) was prepared by homogenizing a fraction of liver in ice-cold HDSC buffer (50 mM Hepes, pH 7.4, 1 mM dithiothreitol, 0.25 M sucrose, 2 mM trisodium citrate, 0.5 mg/L leupeptin and 0.2 mM
TABLE 1
Compositions of Semisynthetic Normal and Low-Iron Dietsa Containing Clofibrate Ingredients of diets Composition (%) No clofibrate 0.5% Clofibrate 35 ppm Fe 15 ppm Fe 35 ppm Fe 15 ppm Fe Casein 20 20 20 20 Corn starch 55 55 55 55 Soybean oil 15 15 15 15 Vitamin mixture AIN-76a 1 1 1 1 Mineral mixturea (iron omitted) 3.5 3.5 3.5 3.5 Cellulose 5 5 5 5 Choline 0.2 0.2 0.2 0.2 Methionine 0.3 0.3 0.3 0.3 Clofibrateb — — 0.5 0.5 Total amount 100 100 100 100 Iron contentc (ppm) 35 15 35 15 a
Based on AIN-76 formula (AIN, 1977), in which the 35 ppm Fe is normal dietary level for rats, while the 15 ppm Fe is a suboptimal level that will deplete liver Fe store and may cause mild anemia.
b
Ethyl 2-(4-chlorophenoxy)-2-methylpropionate (Fluka Chemie).
c
phenylmethylsulfonyl fluoride) using a Potter–Elvehiem homogenizer. The mitochondria pellet was obtained from the postnuclear supernatant by centrif-ugation at 15,000g for 30 min, washed three times to reduce cytosolic con-tamination, resuspended in HDSC, and stored at⫺70°C. The postmitochon-drial supernatant was further centrifuged at 105,000g for 1 h (Ultra-centrifuge, 50.4 Ti Rotor, Beckman). The supernatant was designated as the cytosol fraction and the pellet was designated as the microsomes. The microsome pellet was suspended in 0.05 M phosphate buffer containing 1 mM EDTA at pH 7.7, stored at⫺70°C, and used for CYP4A analysis.
Electrophoretic mobility shift assay of IRPs activity. IRPs–IRE binding activity was determined by gel retardation analysis using a32P-labeled IRE-containing RNA probe of the first 73 nucleotides from ratL-ferritin 5⬘-UTR in the absence or presence of 2-mercaptoethanol (2-ME) (Chen et al., 1997; Schalinske and Eisenstein, 1996). RatL-ferritin cDNA (kindly provided by Dr. R. S. Eisenstein, University of Wisconsin, Madison, WI) was linearized by SmaI digestion and used as template.32P-labeled IRE probe was produced by in vitro transcription using␣-[32P]CTP, Riboprobe Germini II Core System (Promega) and T7 RNA polymerase (Boeringer Mannheim, Germany) and then purified by a 10% acrylamide/8 M urea gel. The specific radioactivity of the probe was estimated to be about 4700 – 4900 cpm/fmol.
For the binding assay, 7.5g of cytosol protein (measured with the Lowry method; Lowry et al., 1951) was incubated with a saturating level of 32 P-labeled IRE probe (final concentration at 1 nmol/L) in the presence of reaction buffer (10 mM Hepes, pH 7.6, 3 mM MgCl2, 40 mM KCl, 1 mM DTT, and 5% glycerol) in a final volume of 20l for 10 min at room temperature and then 2l heparin (5 mg/mL) was added and incubated for another 5 min (Barton et al., 1990). When measuring total IRP1 in the cytosol, 1.5g of cytosol protein was used in the binding reaction and incubation was carried out in the presence of 2-ME.
The IRP-bound probe was separated from the free probe on a 4% nonde-naturing polyacrylamide gel (60:1 acrylamide/bisacrylamide) in 0.5⫻ Tris borate–EDTA buffer and electrophoresed (Hofer SE-600, with a cooling system) at 300 V for 1.5 h at 5°C. The gel was then dried on filter paper (Gel drier Model 283, Bio-Rad), and an autoradiogram on X-OMAT AR film was prepared. The bands corresponding to IRE-bound IRP1 and IRP2 were cut out and counted in a liquid scintillation counter (Beckman, LS 5000 CE).
Western blot analysis of cytochrome P450 4A, ferritin, and mitochondrial aconitase. For the analysis of CYP 4A, the microsomal fraction containing 5 g of protein was resolved on a 12% SDS–polyacrylamide gel, transferred to PVDF membranes, detected by a commercial CYP4A Western blotting kit, and visualized with an ECL Western blotting detection system. For the analysis of ferritin, liver cytosol was heated at 75°C for 10 min and then was centrifuged at 10,000g for 20 min, and protein in the supernatant was resolved on a 15% SDS–polyacrylamide gel, transferred to PVDF membranes, detected with rabbit anti-rat ferritin polyclonal antibodies (Shaw and Chen, 1993) and horseradish peroxidase-conjugated goat anti-rabbit IgG, and the immunoreac-tive, 19 –21-kDa protein was visualized with an enchanced chemiluminescence of ECL detection regents (Amersham Pharmarcia Biotech Inc.). For the anal-ysis of m-ACO, the mitochondrial fraction containing 10g of protein was
resolved on a 10% SDS–polyacrylamide gel, transferred to PVDF membranes, detected with rabbit anti-human m-ACO polyclonal antibody (kindly provided by Dr. H.-H. Zhuang, Memorial University of Chang Gung) and alkaline phosphatase-conjugated goat anti-rabbit IgG (Tropix), and visualized with an enhanced chemiluminescence substrate CDP-star (Tropix). The results of the Western blotting analyses were recorded on Bio-Max films and quantified by densitometry (Microcomputer image device-M4 V3.0).
RNA preparation and Northern blot analysis of transferrin and trans-ferrin receptor. Total RNA was extracted from liver using TRIZOL reagent (GIBCO-BRL, Grand Island, NY). All the cDNAs used as probes were obtained by cloning RT–PCR products of total RNA prepared from the liver of control rats, and their identities were confirmed by sequencing. The synthetic oligonucleotides used to amplify respective cDNA probe are listed in Table 2. The cDNA probes was prepared using a DNA labeling kit and purified by a Micro Spin G-50 column. Ten and 40g of total liver RNA was used for Tf and TfR analysis, respectively. RNA was separated on a formaldehyde– agarose gel (1%) and transferred to a nylon membrane. Following UV/cross-linking (Hoefer), membrane was hybridized to32P-labeled probes (⬎5 ⫻ 108 cpm/g DNA) using -actin as an internal standard. All the results were recorded on X-OMAT AR films and quantified by densitometry.
Aconitase enzyme assay. Activity of m-ACO was determined by the coupled reaction of aconitase (EC 4.2.1.3) and isocitrate dehydrogenase (EC 1.1.142) (Rose and O’Connell, 1967). One unit of enzyme activity was defined as the reduction of 1mol NADP⫹per minute.
Statistical analysis. The main effects of dietary iron level and clofibrate were evaluated by two-way ANOVA. The differences among the four groups were analyzed by Duncan’s Multiple Range test. The statistical significance level was set at p⬍ 0.05. All statistics were carried out on the SAS System (Version 6.12, SAS Institute, Cary, NC).
RESULTS
Growth Repression, Hepatomegaly, and Liver Enzymes
Clofibrate treatment reduced body weight and weight gain in
the normal iron group by 21 and 30%, respectively, and in the
low-iron group by 14 and 21%, respectively (Table 3). Growth
suppression by clofibrate treatment was greater at normal iron
intakes than at low iron intakes. Since food intakes were
reduced by less than 10%, the suppression occurred mainly due
to reduced feed efficiency, indicating inefficient energy
utili-zation.
Clofibrate-treated rats displayed marked hepatomegaly
(Ta-ble 4). Liver weights increased 10 and 30% and relative liver
weights increased 40 and 50% at normal and low iron intakes,
respectively. The hepatomegaly in terms of final liver weight
TABLE 2
Oligonucleotides for Reverse Transcriptase–PCR Cloning
Protein
Sequence of 5⬘ sense (1) and 5⬘ antisense (2) strands
Probe size
(bp) Sequence no.
GenBank
access no. Reference
Transferrin (1) 5⬘ TggCT CaggA ACACT TTggc 658 893–1550 D38380 Hoshino et al. (1996) (2) 5⬘ ggAgC ACAgC CTTgA CTgAA
Transferrin receptor (1) 5⬘ ggTAA ACTgg TCCAT gcTAA T 451 275–725 M58040 Roberts and Griswold (1990) (2) 5⬘ CATTG TTCAC AgTgA gcTTC
-Actin (1) 5⬘ gTggg CCgCT CTAgg CACCA 540 103–642 55574 Nudel et al. (1983)
was comparable between the two clofibrate-treated groups,
regardless of iron levels. While maintained within normal
ranges, serum GOT and GPT were significantly elevated by
clofibrate treatment, and this phenomenon was aggravated by
low iron intake. As expected, clofibrate treatment induced
significant expression of CYP 4A in microsomes (Fig. 1),
which was not compromised by the low iron intake.
Indices of Iron Status
Both clofibrate treatment and low iron intake caused
reduc-tion in hemoglobin concentrareduc-tion (significant main effects at
p
⬍ 0.05, Table 5). Low iron intake or clofibrate alone
reduced hemoglobin by 8%, while the decrease in hemoglobin
in the clofibrate groups was not significantly influenced by
dietary iron levels. In contrast, clofibrate, but not iron intake,
significantly affected serum iron and TIBC, both of which were
reduced by 50% regardless of dietary iron levels. Meanwhile,
transferrin saturation remained normal for all four groups and
was not influenced by clofibrate or iron intakes (Table 5).
Hepatic ferritin (Fig. 2) and iron (Table 6) levels changed with
dietary iron intakes and were significantly lower at low iron
intakes. Clofibrate treatment caused total liver iron to increase by
25 and 86% in the normal and low-iron groups, respectively
(Table 6). Meanwhile, clofibrate caused an 114 and 35% increase
of DFO-chelatable iron at normal and low iron intakes,
respec-tively; while low iron intake caused a 54 and 27% decrease with
and without clofibrate treatment, respectively. At normal iron
intake, the clofibrate-treated rats exhibited the highest
concentra-tion of DFO-chelatable iron, which was 2.2 times that of the
untreated counterpart. Furthermore, the clofibrate treatment
caused a twofold increase in m-ACO activity at both normal and
low iron intakes (Table 6). The expression of m-ACO protein
increased with clofibrate treatment and was significantly higher at
low iron intakes (Fig. 3).
Transferrin and Transferrin Receptor
Clofibrate treatment significantly reduced hepatic Tf mRNA
level by approximately 50% at both normal and low iron
TABLE 3
Growth and Feed Efficiency of Rats as Affected by Low Iron Intake and Clofibrate Treatment
Treatment and Fe groupa
No clofibrateb 0.5% Clofibrateb
p value of two-way ANOVA
35 ppm Fe 15 ppm Fe 35 ppm Fe 15 ppm Fe Fe Clofibrate
Final body weight (g/rat) 417⫾ 411 378⫾ 242 330⫾ 152 325⫾ 222 0.43 0.0001
Body weight gain (g/day/rat) 6.7⫾ 11 5.8⫾ 0.72 4.7⫾ 0.33 4.5⫾ 0.53 0.043 0.0001 Food intake (g/rat/day) 19.1⫾ 2.31 17.3⫾ 1.31,2 17.4⫾ 1.42 16.1⫾ 1.52 0.26 0.047 Feed efficiencyc,d 0.35⫾ 0.011 0.33⫾ 0.021 0.27⫾ 0.012 0.27⫾ 0.012 0.17 0.0001
aThe 35 ppm Fe is normal dietary level for rats, while the 15 ppm Fe is a suboptimal level that will deplete liver Fe store and may cause mild anemia. bEach value represents group mean⫾ SD of six rats. Different superscript numbers in each row indicate significant difference by Duncan’s Multiple Range
test at p⬍ 0.05.
cFeed efficiency⫽ body weight gain (g/day/rat) ⫼ feed intake (g/day/rat). dLog-transformed data were analyzed.
TABLE 4
Liver Weights and Liver Function Indicators in Rats as Affected by Low Iron Intake and Clofibrate Treatment
Treatment and Fe groupa No clofibrateb 0.5% Clofibrateb p value of two-way ANOVA 35 ppm Fe 15 ppm Fe 35 ppm Fe 15 ppm Fe Fe Clofibrate Liver weight (g)c 23.8⫾ 2.41 20.4⫾ 1.42 26.2⫾ 0.93 26.9⫾ 1.03 0.06 0.0001 Relative liver weight
(% body weight) 5.7⫾ 0.21 5.4⫾ 0.21 7.9⫾ 0.32 8.3⫾ 0.52 0.24 0.0001
GOTd(U/L) 58⫾ 81 64⫾ 51,2 61⫾ 61,2 73⫾ 62 0.04 0.0238
GPTd(U/L) 25⫾ 41 27⫾ 51 28⫾ 41 37⫾ 92 0.04 0.0065
aThe 35 ppm Fe is normal dietary level for rats, while the 15 ppm Fe is a suboptimal level that will deplete liver Fe store and may cause mild anemia. bEach value represents sample mean⫾ SD of six rats. Different superscript numbers in each row indicate significant difference by Duncan’s Multiple Range
test at p⬍ 0.05.
cIron and clofibrate interaction was statistically significant by two-way ANOVA at p⬍ 0.05. dLog-transformed data were analyzed.
intakes (Fig. 4A). Both dietary iron intake and clofibrate
sig-nificantly affected hepatic TfR mRNA level; which was
re-duced by clofibrate, while increased by low iron intake.
With-out clofibrate, low iron intake caused TfR mRNA to increase
by twofold, but this effect disappeared with clofibrate
treat-ment (Fig. 4B).
Hepatic IRP1 and IRP2 Activities
The main effects of iron intake or clofibrate treatment on
IRP1 activity were not significant (Fig. 5A). Nevertheless, the
clofibrate-treated group had significantly higher IRP1 activity
than the untreated counterpart at normal iron intake (Fig. 5B).
Without clofibrate treatment, IRP2 activity was significantly
enhanced by low iron intake, but clofibrate treatment offset this
effect (Fig. 5C).
Serum and Hepatic Copper
Clofibrate caused serum copper to decrease by 30 and 18%
at normal and low iron intakes, respectively. Serum
ceruloplas-min ferroxidase activity decreased with serum copper levels
(Table 7). In contrast, clofibrate caused hepatic copper to
increase by more than twofold (Table 7). The low iron intake
did not affect serum ceruloplasmin and copper levels, but it
increased hepatic copper accumulation by approximately 69%
with or without clofibrate treatment (Table 7).
DISCUSSION
Previous studies (Anderson et al., 1999; Eagon et al., 1999;
Hertz et al., 1996; Powanda et al., 1978) have demonstrated
FIG. 1. A representative gel electrophoresis and immunoblotting of mi-crosomal CYP4A in the rat liver as affected by a low-iron diet and clofibrate treatment. The 35 ppm Fe is normal dietary level for rats, while the 15 ppm Fe is a suboptimal level which will deplete liver Fe store and may cause mild anemia. CYP4A abundance was determined by Western blot analysis using 5 g microsomal protein. Each lane represents one rat and results of six rats were quantified by densitometry and statistically analyzed with two-way ANOVA (significant level set at p⬍ 0.05).
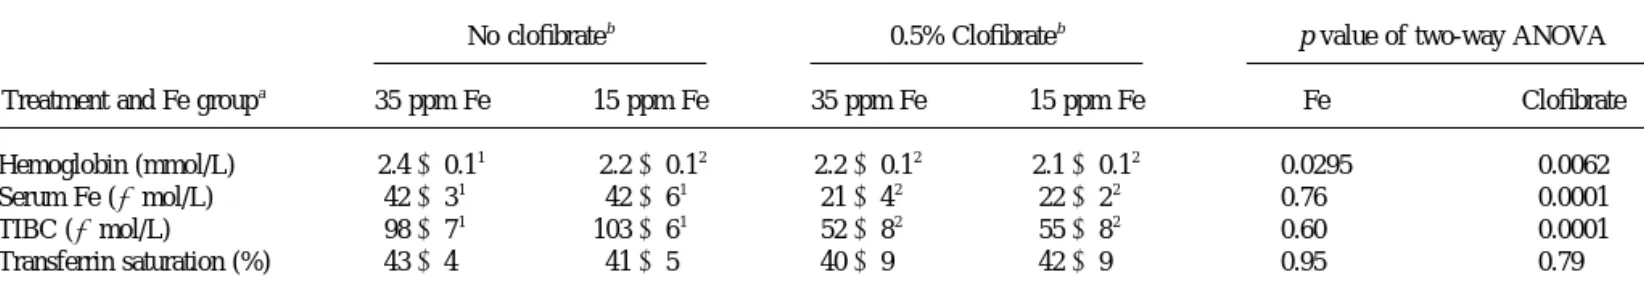
TABLE 5
Hematological Indices of Iron Status of Rats as Affected by Low Iron Intake and Clofibrate Treatment
Treatment and Fe groupa
No clofibrateb 0.5% Clofibrateb p value of two-way ANOVA
35 ppm Fe 15 ppm Fe 35 ppm Fe 15 ppm Fe Fe Clofibrate
Hemoglobin (mmol/L) 2.4⫾ 0.11 2.2⫾ 0.12 2.2⫾ 0.12 2.1⫾ 0.12 0.0295 0.0062
Serum Fe ( mol/L) 42⫾ 31 42⫾ 61 21⫾ 42 22⫾ 22 0.76 0.0001
TIBC ( mol/L) 98⫾ 71 103⫾ 61 52⫾ 82 55⫾ 82 0.60 0.0001
Transferrin saturation (%) 43⫾ 4 41⫾ 5 40⫾ 9 42⫾ 9 0.95 0.79
aThe 35 ppm Fe is normal dietary level for rats, while the 15 ppm Fe is a suboptimal level that will deplete liver Fe store and may cause mild anemia. bEach value is sample mean⫾ SD of six rats. Different superscript numbers in each row indicate significant difference by Duncan’s Multiple Range test at
p⬍ 0.05.
FIG. 2. Ferritin in the rat liver as affected by a low-iron diet and clofibrate treatment. The 35 ppm Fe is normal dietary level for rats, while the 15 ppm Fe is a suboptimal level which will deplete liver Fe store and may cause mild anemia. Ferritin was determined by Western blot analysis using 70 g cytosolic protein (A) and results were quantified by densitometry (B). In A, lane f represents rat ferritin purchased from Sigma Co. In B, the values are mean⫾ SD of six rats and bars not sharing the same superscript letters are significantly different from one another by Duncan’s Multiple Range test ( p⬍ 0.05).
that PPs suppress the expression of transferrin, ceruloplasmin,
and ATP7B and reduce the concentrations of serum iron and
copper. Complementing previous results, this study reveals that
clofibrate alters internal iron exchange and liver iron
homeosta-sis. The physiological implication of the adaptation can be
partially explained.
Clofibrate and Internal Iron Exchange
Since plasma Tf level is dominated by liver Tf expression,
the reduction in TIBC owing to clofibrate treatment can be
fully accounted for by the reduction in Tf mRNA. Recycling of
scavenged hemoglobin iron to erythropoietic marrow via
plasma transferrin represents the single largest iron flux in the
body (Fairbanks, 1994). Although liver iron was not depleted,
and the labile iron pool represented by DFO-chelatable Fe was
expanded, clofibrate treatment resulted in anemia herein,
indi-cating that the 50% reduction of serum Tf actually limits iron
efflux from the storage sites as well as the availability of iron
for erythropoiesis. The blood outcome observed in rats is
applicable to PP-treated patients, who frequently displayed a 2
to 4% reduction in hemoglobin concentrations (Schrefer,
2001). Ceruloplasmin is also essential for hepatic iron efflux
(Harris et al., 1999); however, Cp at 70% of the normal levels
was adequate for iron mobilization in the clofibrate-treated rats
(Cohen et al., 1983; Roeser et al., 1970). Therefore, the
reduc-tion in transferrin is fully responsible for the clofibrate-induced
anemia.
Two questions relevant to PP-induced anemia are raised:
whether this mild anemia worsens at suboptimal iron intake and
whether iron supplement alleviates it. Herein, the result of a
two-way ANOVA (p
⫽ 0.0295 for Fe) indicates a significant
main effect of iron intake on hemoglobin concentration (Table 5).
Nevertheless, the hemoglobin level of the clofibrate-treated
groups was not reduced by low iron intake, most likely due to
up-regulation of the number of transferrin receptors and increased
iron uptake hence in the iron-depleted erythroblasts, thus partially
compensating for the reduced iron supply from the liver.
How-ever, the fraction of the recycling hemoglobin iron is reduced with
decreased TIBC and will not match the rate of hemoglobin
deg-radation, thus providing an explanation for the elevated anemia
rate in the clinical follow-up (The Coronary Drug Project, 1975).
TABLE 6
Hepatic Iron Content and Mitochondrial Aconitase Activity of Rats as Affected by Low Iron Intake and Clofibrate Treatment
Treatment and Fe groupa
No clofibrateb 0.5% Clofibrateb p value of two-way ANOVA 35 ppm Fe 15 ppm Fe 35 ppm Fe 15 ppm Fe Fe Clofibrate Hepatic Fe (mol/g liver) 0.84⫾ 0.191 0.36⫾ 0.112 0.94⫾ 0.201 0.47⫾ 0.112 0.0001 0.068
(mol/ whole liver) 20⫾ 42 7⫾ 23 25⫾ 51 13⫾ 34 0.0001 0.0019
DFO-chelatable Fec(nmol/g liver) 11.3⫾ 3.82 8.3⫾ 2.12 24.2⫾ 8.51 11.2⫾ 2.72 0.0008 0.0008 Mitochondrial aconitase activityd
(mU/mg mitochondrial protein) 19.1⫾ 1.62 17.0⫾ 1.52 41.8⫾ 4.81 42.1⫾ 3.81 0.45 0.0001
aThe 35 ppm Fe is normal dietary level for rats, while the 15 ppm Fe is a suboptimal level that will deplete liver Fe store and may cause mild anemia. bEach value is sample mean⫾ SD of six rats. Different superscript numbers in each row indicate significant difference by Duncan’s Multiple Range test at
p⬍ 0.05.
cIron and clofibrate interaction was statistically significant by two-way ANOVA at p⬍ 0.05.
dOne enzyme unit⫽ 1mol NADP⫹consumed per min in a coupling reaction of aconitase and isocitrate dehydrogenase.
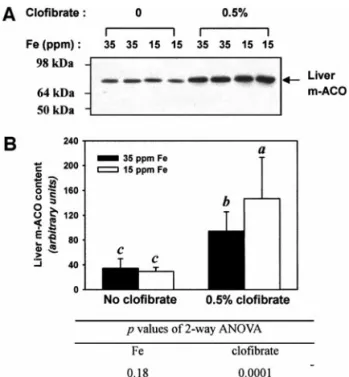
FIG. 3. Mitochondrial aconitase (m-ACO) protein level in the rat liver as affected by a low-iron diet and clofibrate treatment. The 35 ppm Fe is normal dietary level for rats, while the 15 ppm Fe is a suboptimal level which will deplete liver Fe store and may cause mild anemia. Abundance was determined by Western blot analysis using 10 g mitochondrial protein (A) and results were quantified by densitometry (B). In A, each lane represents one rat. In B, the values are mean⫾ SD of six rats and bars not sharing the same superscript letters are significantly different from one another by Duncan’s Multiple Range test ( p⬍ 0.05).
Iron supplement does not eliminate the limit of the reduced TIBC,
therefore, it does not correct PP-induced anemia.
Clofibrate and Liver Iron Accumulation
Previous studies are inconsistent regarding PP-induced iron
accumulation in the liver; short-term drug exposure increased
liver iron content (Powanda et al., 1978), while prolonged
exposure did not (Eagon et al., 1999). The 42-day exposure
herein actually caused iron loading, as indicated by the
per-centage increase in total iron (25– 86%) exceeding that of the
proportion of hepatomegaly (10 –30%). On the other hand,
tumors induced by chronic PP administration are strongly
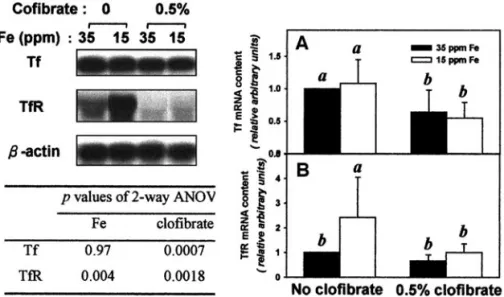
FIG. 4. Abundance of (A) transferrin, Tf, and (B) transferrin receptor, TfR mRNAs in the rat liver as affected by a low-iron diet and clofibrate treatment. The 35 ppm Fe is normal dietary level for rats, while the 15 ppm Fe is a suboptimal level which will deplete liver Fe store and may cause mild anemia. Abundance was determined by Northern blot analysis (total RNA 10 g for Tf and 40 g for TfR) and results were quantified by densitometry normalized to -actin mRNA. The values are mean⫾ SD of six rats and bars in each panel not sharing the same superscript letters are significantly different from one another by Duncan’s Multiple Range test ( p⬍ 0.05).
FIG. 5. Cytosolic IRP1 and IRP2 activities in the rat liver as affected by a low-iron diet and clofibrate treatment. IRPs activities were determined by EMSA and bound IRP1 and IRP2 as well as free probe are indicated (A). The 35 ppm Fe is normal dietary level for rats, while the 15 ppm Fe is a sub-optimal level which will deplete liver Fe store and may cause mild anemia. Activities were quantified by scintillation counting (B and C). The values are mean⫾ SD of six rats and bars not sharing the same superscript letters are significantly different from one another by Duncan’s Multiple Range test ( p⬍ 0.05).
resistant to iron accumulation even given very high levels of
dietary iron (Rao et al., 1986). Taking together, a
time-depen-dent effect of PP on hepatic iron homeostasis is indicated in
that liver iron increases transiently in the initial stage of
PP-induced liver hyperplasia preceding the development of
hepato-cellular carcinomas (HCC). The excess iron may work for
functional and synthetic purposes, because numerous
PP-in-duced enzymes (cytochrome P450s, peroxisomal oxidases, and
mitochondrial enzymes) are Fe-containing proteins. Clofibrate
treatment did not reduce liver ferritin levels, suggesting that
intracellular iron is conserved by the reduction of
transferrin-mediated iron efflux. Therefore, the altering of iron
homeosta-sis by PPs is a physiological adaptation to conserve iron in liver
cells for metabolic functions.
Differential Regulation of IRPs
As an essential nutrient, cellular iron is closely regulated
through the action of TfR and ferritin, the proteins for iron
uptake and storage, respectively. Ferritin and TfR are regulated
posttranscriptionally by the IRP/IRE system (Cairo and
Pi-etrangelo, 2000). It is well established that RNA binding
ac-tivities of both IRP1 and IRP2 in the liver are influenced by
dietary iron intakes (Chen et al., 1997, 1998) and generally
change with similar kinetics when activated by iron deficiency
or deactivated by iron excess (Guo et al., 1994; Henderson and
Ku¨hn, 1995). Herein, we demonstrated that IRP1 and IRP2
reacted differentially, with IRP2 activity increasing, while
IRP1 activity remained unchanged, in response to the low-iron
diet (15 ppm Fe), which provided 42% of the recommended
dietary iron level for rats and caused mild iron-deficiency
symptoms as indicated by an 8% reduction in hemoglobin
concentration and a 14% reduction in body weight gain. This
result supports the observation by Chen et al. (1997) that IRP2
is more sensitive than IRP1 to in vivo changes in iron level.
Additionally, we provide the first in vivo observation that the
change in TfR mRNA was connected with the change in IRP2
activity, both increasing at the low iron intake and being
simultaneously suppressed by clofibrate treatment. A similar
correlation has been documented in NO-treated RAW 264.7
cells previously (Kim and Ponka, 1999). Such a connection
does not exist between IRP1 activity and TfR mRNA, since
TfR mRNA did not change as IRP1 activity increased in the
clofibrate-treated, normal iron group herein. Thus,
corroborat-ing the previous findcorroborat-ings that IRP2 is more effective than IRP1
in modulating ferritin synthesis in vivo (Chen et al., 1997), the
present study proves a similar IRP2 effect on the stability of
TfR mRNA.
Herein, clofibrate treatment selectively activated IRP1
de-spite the expanded liver iron and DFO-chelatable Fe
concen-trations. This activation cannot be attributed to cellular iron
depletion and is best explained by some H
2O
2-triggered
path-ways. Recent investigations have proven that H
2O
2treatment
causes IRP1, but not IRP2, to bind IREs rapidly in cell models
(Pantopoulos and Hentz, 1995; Pantopoulos et al., 1996) and in
perfused liver (Mueller et al., 2001). Furthermore, liver IRP1 is
activated by H
2O
2leaking from the mitochondrial respiratory
chain (Pantopoulos et al., 1997). In PP-treated livers, H
2O
2increases because of elevated activity of peroxisomal fatty
acyl-CoA oxidase and microsomal cytochrome P450 enyzems,
while the activity of H
2O
2-degrading enzymes, peroxisomal
catalase and cytosolic glutathione peroxidase, is relatively
in-sufficient (Yeldandi et al., 2000). The leakage of H
2O
2from
peroxisomes and undegraded H
2O
2in cytosol may serve as a
signal to activate IRP1. Additionally, the H
2O
2activation of
IRP1 was followed by the suppression of ferritin synthesis and
an increase in TfR numbers (Pantopoulos and Hentze, 1995;
Caltagirone et al., 2001), implying an expansion of the
intra-cellular free-iron pool, which is now demonstrated in the
clofibrate-treated, normal iron group herein, indicating that
TABLE 7
Serum and Hepatic Copper Indices of Rats as Affected by Low Iron Intake and Clofibrate Treatment
Treatment and Fe groupa
No clofibrateb 0.5% Clofibrateb p value of two-way ANOVA 35 ppm Fe 15 ppm Fe 35 ppm Fe 15 ppm Fe Fe Clofibrate Serum Cu ( mol/L)c 17⫾ 11 15⫾ 12 12⫾ 13 12⫾ 13 0.11 0.0001 Ceruloplasmin (U/L)d 121⫾ 161 111⫾ 161 91⫾ 52 85⫾ 82 0.12 0.0001
Hepatic Cu (nmol/g liver)e 52⫾ 152 88⫾ 362 125⫾ 881,2 210⫾ 1391 0.0255 0.0039 Cu:Fe molar ratioe 0.06⫾ 0.022 0.27⫾ 0.151 0.12⫾ 0.082 0.51⫾ 0.411 0.0001 0.0489
aThe 35 ppm Fe is normal dietary level for rats, while the 15 ppm Fe is a suboptimal level that will deplete liver Fe store and may cause mild anemia. bEach value is sample mean⫾ SD of six rats. Different superscript numbers in each row indicate significant difference by Duncan’s Multiple Range test at
p⬍ 0.05.
cIron and clofibrate interaction was statistically significant by two-way ANOVA at p⬍ 0.05.
dOne unit⫽ 1mol o-diansidine dihydrochloride oxidized per minute by the ferroxidase reaction of ceruloplasmin. eData were log transformed for statistical analysis.
peroxisome-derived oxidative stress can activate IRP1 via
H
2O
2production and alter iron homeostasis.
Metabolic Adaptations of m-ACO
The mRNA of m-ACO, the TCA enzyme converting citrate
to isocitrate, contains an IRE in the 5
⬘-UTR and is subjected to
translational regulation by IRP/IRE binding (Schalinske et al.,
1998). Dietary iron deficiency reduces both the level and the
activity of m-ACO protein in rat liver in a time- and
dose-dependent manner (Chen et al., 1997, 1998). However, neither
the activity nor the protein level of m-ACO decreased when
IRP2 was activated by the low-iron diet herein, which is the
first in vivo demonstration of differential regulation between
m-ACO and TfR mRNA by IRP2, probably due to differing
affinities between IRP2 and IRE isoforms from different
mRNAs (Theil and Eisenstein, 2000). It is noted that the two
clofibrate-treated groups displayed similar m-ACO activities,
while differing in protein levels. An explanation for this
dis-crepancy is that the assembly of holo-m-ACO was limited at
low iron intake with an excess of nonfunctional apoprotein in
the cell.
Regardless of iron status, clofibrate treatment caused
m-ACO activity to increase by 133%, while clofibrate also
enhanced the activity of three rate-limiting enzymes in the
TCA cycle, citrate synthase, nicotinamilinked isocitrate
de-hydrogenase, and
␣-ketoglutarate dehydrogenase, by 24, 54,
and 153%, respectively (Prager et al., 1993; Schon et al.,
1994). In the clofibrate-treated liver, the production of
acetyl-CoA is elevated and leads to increased citrate formation via
citrate synthase (Ball et al., 1979). Accumulating citrate acts as
an allosteric activator of acetyl-CoA carboxylase and favors
fatty acid synthesis. The enhanced activities of m-ACO and
rate-limiting enzymes makes it possible to accommodate
higher acetyl-CoA influx and citrate flux, owing to PP-induced
-oxidation of fatty acids.
Clinical Implication of Liver Copper Accumulation
Clofibrate-induced copper accumulation in the liver was not
significant during a 5-day exposure to PP (Powanda et al.,
1978), while it increased markedly with prolonged exposure
(Eagon et al., 1999). The copper loading was specific as
verified by the twofold increase in Cu to Fe mole ratio of the
treated groups (Table 7). It is well established that excess
copper acts as a prooxidant to promote the formation of free
radicals and the harmful oxidation of lipids and proteins. In the
hereditary Wilson’s disease, excess copper causes
hepatocel-lular necrosis of the liver, as well as portal and periportal
inflammation, and ultimately fibrosis (Pfeil and Lynn, 1999).
Since elevated serum GOT and GPT have been observed
occasionally in patients taking PP drugs (Sirtori et al., 1992),
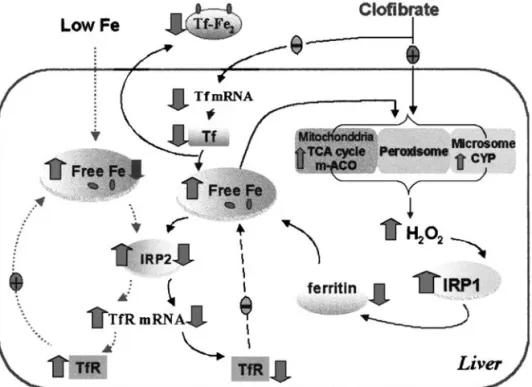
FIG. 6. Iron homeostasis in the liver affected by a low-iron diet and clofibrate treatment. When iron intake is low, IRP2 is activated by the depleted free-iron pool in the cell, which will increase the stability of transferrin receptor (TfR) mRNA and the number of transferrin receptors. When clofibrate is administered, iron efflux from the liver decreases due to suppressed expression of transferrin (Tf) gene and decreased iron transport in the serum. Clofibrate elevates peroxisomal oxidase, microsomal CYP and mitochondrial aconitase (m-ACO) activities, which may increase intracellular H2O2level. IRP1 activated by H2O2 suppresses ferritin synthesis, thus expanding the intracellular free iron pool, which allows more iron to be available for the biosynthesis of iron-containing enzymes in response to clofibrate treatment on the one hand, and inactivates IRP2 to reduce TfR mRNA and receptor numbers on the other hand. Thus, a new steady state of iron homeostasis will be established.
copper-induced oxidative stress may be a major contributor to
PP-induced liver toxicity. Few clinical trials have monitored
copper status, mainly because of a lack of feasible blood
markers. Since Cp and liver copper change inversely during PP
treatment, serum Cp may be used to check the risk of hepatic
copper loading.
In conclusion, the present study demonstrates that changes
in hepatic iron homeostasis by clofibrate involve a differential
regulation of IRP1 and IRP2 with changes in m-ACO both at
protein and enzyme activity levels, and a model is proposed to
depict these effects (Fig. 6). Clofibrate suppresses Tf
expres-sion and reduces hepatic iron efflux to maintain an expanded
free-iron pool in the liver cell via differential regulation of
IRP1 and IRP2 activities, in order to conserve iron for the
synthesis of a variety of Fe-containing enzymes, including
m-ACO, which are up-regulated by hypolipidemic
peroxiso-mal proliferators for metabolic functions. We also observe that
TIBC, Cp, and liver copper levels rapidly returned to normal
while clofibrate was discontinued (data not shown); periodic
discontinuation of fribrate drugs needs to be considered in
order to alleviate PP-induced anemia and liver copper toxicity.
ACKNOWLEDGMENTS
We are grateful to Dr. R. S. Eisenstein from the Department of Nutritional Sciences, University of Wisconsin, for the gift of ratL-ferritin cDNA, and to
Dr. H.-H. Zhuang from Memorial University of Chang Gung for the gift of rabbit anti-human mitochondrial aconitase antibody. This project is supported by Grant NSC89-2320-B002-165 from the National Science Council in Taiwan.
REFERENCES
American Institute of Nutrition (AIN) (1977). Report of American Institute of Nutrition Ad hoc committee on standards for nutritional studies. J. Nutr. 107, 1340 –1344.
Anderson, S. P., Cattley, R. C., and Corton, J. C. (1999). Hepatic expression of acute-phase protein genes during carcinogenesis induced by peroxisome proliferators. Mol. Carcinogen. 26, 226 –238.
Auwerx, J. (1992). Regulation of gene expression by fatty acids and fibric acid derivatives: An integrative role for PPARs. Horm. Res. 38, 269 –277. Ball, M. R., Gumaa, K. A., and MeLean, P. (1979). Effect of clofibrate on the
CoA thioester profile in rat liver. Biochem. Biophys. Res. Commun. 87, 489 – 496.
Barton, H. A, Eisenstein, R. S., Bomford, A. B., and Munro, H. N. (1990). Determinants of the interaction of the iron-responsive element-binding protein and its binding site in ratL-ferritin mRNA. J. Biol. Chem. 265, 7000 –7008.
Cairo, G., and Pietrangelo, A. (2000). Iron regulatory proteins in pathobiology. Biochem. J. 352, 241–250.
Cairo, G., Tacchini, L., Pogliaghi, G., Anzon, E., Tomasi, A., and Bernelli-Zazzera, A. (1995). Induction of ferritin synthesis by oxidation stress, transcriptional and post-transcriptional regulation by expension of the “free-iron pool.” J. Biol. Chem. 270, 700 –703.
Caltagirone, A., Weiss, G. and Pantopoulos K. (2001). Modulation of cellular iron metabolism by hydrogen peroxide. J. Biol. Chem. 276, 19738 –19745. Chen, O. S., Blemings, K. P., Schalinske, K. L., and Eisenstein, R. S. (1998). Dietary iron intake rapidly influences iron regulatory proteins, ferritin sub-units and mitochondrial aconitase in rat liver. J. Nutr. 128, 525–535.
Chen, O. S., Schalinske, K. L., and Eisenstein, R. S. (1997). Dietary iron intake modulates the activity of iron regulatory proteins and the abun-dance of ferritin and mitochondrial aconitase in rat liver. J. Nutr. 127, 238 –248.
Cohen, N. L., Keen, C. L., Lonnerdal, B., and Hurley, L. S. (1983). The effect of copper chelating drugs on liver iron mobilization in the adult rat. Bio-chem. Biophys. Res. Commun. 113, 127–134.
Crichton, R. R., and Charloteaux-Wauters, M. (1987). Iron transport and storage. Eur. J. Biochem. 164, 485–506.
Eagon, P. K., Teepe, A. G., Elm, M. S., Tadic, S. D., Epley, M. J., Beiler, B. E., Shinozuka, H., and Rao, K. N. (1999). Hepatic hyperplasia and cancer in rats: Alterations in copper metabolism. Carcinogenesis 20, 1091–1096 Fairbanks, V. F. (1994). Iron in medicine and nutrition. In Modern Nutrition in
Health and Disease, 8th ed. (M. E. Shils, J. A. Olson, and M. Shike, Eds.), pp. 185–213. Lea & Febiger, Malvern, PA.
Guo, B., Yu, Y., and Leibold, E. A. (1994). Iron regulates cytoplasmic levels of a noveliron-responsive element-binding protein without aconitase activ-ity. J. Biol. Chem. 269, 24252–24260.
Harris, Z. L., Durley, A. P., Man, K. T., and Gitlin, J. D. (1999). Targeted gene disruption reveals and essential role for ceruloplasmin in cellular iron efflux. Proc. Natl. Acad. Sci. USA 96, 10812–10817.
Harris, Z. L., Klomp, L. W. J., and Gitlin, J. D. (1998). Aceruloplasminemia: An inherited neurodegenerative disease with impairment of iron homeosta-sis. Am. J. Clin. Nutr. 67, (Suppl.), 972S–977S
Hayashi, A., Wada, Y., Suzuki, T., and Shimizu, A. (1993). Studies on familial hypotransferrinemia: Unique clinical course and molecular pathology. Am. J. Hum. Genet. 53, 201–213.
Henderson, B. R., and Ku¨hn, L. (1995). Differential modulation of the RNA-binding proteins IRP-1 and IRP-2 in response to iron. J. Biol. Chem. 270, 20509 –20515.
Hentz, M. W., and Ku¨hn, L. C. (1996). Molecular control of vertebrate iron metabolism: mRNA-based regulatory circuits operated by iron, nitric oxide, and oxidative stress. Proc. Natl. Acad. Sci. USA 93, 8175– 8182. Hertz, R., Seckbach, M., Zakin, M. M., and Bar-Tana, J. (1996).
Transcrip-tional suppression of the transferrin gene by hypolipidemic peroxisome proliferator. J. Biol. Chem. 271, 218 –224.
Hoshino, A., Hisayasu, S., and Shimada, T. (1996). Complete sequence anal-ysis of rat transferrin and expression of transferrin but not lactoferrin in the digestive glands. Comp. Biochem. Physiol. 113B, 491– 497.
Kim, S., and Ponka, P. (1999). Control of transferring receptor expression via nitric oxide-mediated modulation of iron-regulatory protein 2. J. Biol. Chem. 274, 33035–33042.
Lowry, O. H., Rosebrough, N. J., Farr, A. L., and Randall, R. T. (1951). Protein measurement with Folin phenol reagent. J. Biol. Chem. 193, 265– 275.
Mueller, S., Pantopoulos, K., Hubner C. A., Stremmel W., and Hentz, W. M. (2001). IRP1 activation by extracellular oxidative stress in the perfused rat liver. J. Biol. Chem. 276, 23192–23196.
National Science Council (1993). NSC Guide for the Care and Use of Labo-ratory Animals. National Science Council, Taipei, Taiwan.
Nudel, U., Zakut, R., Shani, M., Neuman, S., Levy, Z., and Yaffe, D. (1983). The nucleotide sequence of the rat cytoplasmic beta-actin gene. Nucleic Acids Res. 11, 1759 –1771.
Oser, B. L. (1965). Hawk’s Physiological Chemistry, 14th ed., McGraw–Hill, New York.
Pantopoulos, K., and Hentze, M. W. (1995). Rapid responses to oxidative stress mediated by iron regulatory protein. EMBO J. 14, 2917–2924. Pantopoulos, K., Mueller, S., Atzberger, A., Ansorge, W., Stremmel, W., and
protein-1 (IRP-1) by extra- and intracellular oxidative stress. J. Biol. Chem. 272, 9802–9808.
Pantopoulos, K., Weiss, G., and Hentze, M. W. (1996). Nitric oxide and oxidative stress (H2O2) control mammalian iron metabolism by different pathways. Mol. Cell. Biol. 16, 3781–3788.
Pfeil, S. A., and Lynn, D. J. (1999). Wilson’s disease, copper unfettered. J. Clin. Gastroenterol. 29, 22–31.
Powanda, M. C., Blackburn, B. S., Bostian, K. A., Fowler, J. P., Hauer E. C., and Pekarek, R. S. (1978). Clofibrate-induced alterations in zinc, iron and copper metabolism. Biochem. Pharmacol. 27, 125–127.
Prager, C., Schon, H. J., Nikfardjam, M., Schmid, D., Untersalmberger, M., Kremser, K., and Kramar, R. (1993). Clofibrate elevates enzyme activities of the tricarboxylic acid cycle in rat liver. J. Lipid Res. 34, 359 –364.
Rao, M. S., Subbarao, V., and Reddy, J. K. (1986). Increased resistance of peroxisome proliferator-induced hepatic lesions to iron overload in rats. Cancer Lett. 32, 33–39.
Roberts, K. P., and Griswold, M. D. (1990). Characterization of rat transferrin receptor cDNA: The regulation of transferrin receptor mRNA in testes and in Sertoli cells in culture. Mol. Endocrinol. 4, 531–542.
Roeser, H. P., Lee, G. R., Nacht, S., and Cartwright, G. E. (1970). The role of ceruloplasmin in iron metabolism. J. Clin. Invest. 49, 2408 –2417. Rose, I. A., and O’Connell, E. L. (1967). Mechanism of aconitase action. I.
The hydrogen transfer reaction. J. Biol. Chem. 242, 1870 –1879. Schalinske, K. L., Chen, O. S., and Eisenstein, R. S. (1998). Iron differentially
stimulates translation of mitochondrial aconitase and ferritin mRNAs in mammalian cells. J. Biol. Chem. 273, 3740 –3746.
Schalinske, K. L., and Eisenstein, R. S. (1996). Phosphorylation and activation
of both iron regulatory proteins 1 and 2 in HL-60 cells. J. Biol. Chem. 271, 7168 –7176.
Schon, H. J., Grgurin, M., Klune, G., Prager, C., Marz, R., Legenstein, E, Bock, P., and Kramar, R. (1994). Effects of hypolipidaemics cetaben and clofibrate on mitochondrial and peroxisomal enzymes of rat liver. J. Pharm. Pharmacol. 46, 144 –147.
Schoonjans, K., Stael, B., and Auwerx, J. (1996). Role of the peroxisome proliferator-activated receptor (PPAR) in mediating the effects of fibrates and fatty acids on gene expression. J. Lipid Res. 37, 907–925.
Schosinky, K. H., Lehmann, H. P., and Beeler, M. F. (1974). Measurement of ceruloplasmin from its oxidase activity in serum by use of o-dianisdine dihydrochloride. Clin. Chem. 20, 1556 –1563.
Schrefer, J. (2001). Mosby’s GenRx, 11th ed., Mosby, St. Louis.
Shaw, N. S., and Chen, S. H. (1993). Effect of zinc deficiency on hepatic iron and ferritin in rats. J. Chin. Agric. Chem. Soc. 31, 633– 641.
Sirtori, C. R., Calabresi, L., Werba, J. P., and Franceschini, G. (1992). Tolerability of fibric acids: Comparative data and biochemical bases. Phar-macol. Res. 26, 243–260.
The Coronary Drug Project Research Group (1975). Clofibrate and niacin in coronary heart disease. J. Am. Med. Assoc. 231, 360 –381.
Theil, E. C., and Eisenstein, R. S. (2000). Combinatorial mRNA regulation: Iron regulatory proteins and iso-iron-responsive elements (Iso-IREs). J. Biol. Chem. 275, 40659 – 40662.
Yegorov D. Y., Kozlov, A. V., Azizova, O. A., and Vladimirov, Y. A. (1993). Simultaneous determination of Fe(III) and Fe(II) in water solutions and tissue homogenates using desferal and 1,10-phenanthroline. Free Radical Biol. Med. 15, 565–574.
Yeldandi, A. V., Rao, M. S., and Reddy, J. K. (2000). Hydrogen peroxide generation in peroxisome proliferator-induced oncogenesis. Mutat. Res. 448, 159 –177.