1, 2
Assistant Professor 3
Associate Professor
The Eighteenth KKCNN Symposium on Civil Engineering-NTU29 December 19-21, 2005, Taiwan
Strain Distribution Analysis Using Digital-Image-Correlation Techniques
*Shih-Heng Tung
1, Jui-Chao Kuo
2, Ming-Hsiang Shih
3 1Department of Civil and Environment Engineering, National University of Kaohsiung, Kaohsiung 811, Taiwan
shtung@nuk.edu.tw
2
Department of Materials Science and Engineering, National Cheng-Kung University, Tainan 70101, Taiwan
jckuo@mail.ncku.edu.tw
3
Department of Construction Engineering, National Kaohsiung First University of Science and Technology, Kaohsiung 824, Taiwan
mhshih@ccms.nkfust.edu.tw
ABSTRACT
The analysis of strain distribution plays an important role in plasticity and stress concentration problem. The traditional measurement techniques are either not able to determine the strain field over a surface or too expensive to be widely used in all research and engineering. In contrast, digital optic measurement can provide a low-cost and precise method to measure strain distribution. In this study a novel image processing is demonstrated to determine plane strain fields on sample surfaces after plastic deformation. A numerical procedure for deformation analysis using digital-image-correlation (DIC) is applied to determine the correlation relation of each facet between in a “source” region as a reference image and in a displaced region as a “destination” image. The performance of this technique is investigated. The accuracy and precision of this method is experimentally investigated and compared with the theoretical values. In addition, an aluminum poly-crystal is compressed in a channel-die to demonstrate the strain mapping. During deformation process, pronounced strain heterogeneity is observed by strain field distributions. Those results indicate that our novel method can be successfully to visualize deformation histories during processing.
INTRODUCTION
The measurement and analysis of the strain distribution is very important in civil and mechanical engineering, especially in the stress concentration problem in plastic and fracture mechanics. The traditional strain measurement technique can be divided into two types. Type 1: The relative displacement of two points will be measured. Then we can calculate the average strain between these two points by means of this relative displacement. The disadvantage of this method is that the surface strain distribution can not be obtained. Type 2:
A grid will be established on a sample surface before the deformation. We can measure the displacements of the grid after the deformation and analyze the strain distribution. The disadvantage of this method lies in its time consuming at analyzing the data. There are also precise measurement instrument, e.g. Raman-Spectroscopy and electrical speckle pattern interferometer, which can be used to measure the surface strain filed without contact. But due to the expensive cost and the stability problem those methods can not be widely used in the scientific research and engineering. A precise measurement of the surface strain distribution can be achieved with the help of the low-cost digital
-i
mage-correlation technique. It is an efficient tool to verify the result of the numerical calculation.The fundamental theory of the digital-image-correlation technique is to compare the digital images before and after the deformation. Therefore, the “structural fleck” will be established on the sample surface before the deformation. The grayscale distribution offers an important character at recognizing the corresponding facets between before and after deformation. The relative position before and after the deformation can be obtained with the help of the grayscale distribution comparison. Then we can calculate the displacement vector and the strain in x- and y-direction, shear strain and von Mises strain.
FUNDAMENTAL THEORY
Digital-Image-Correlation Techniques
The digital-image-correlation technique is widely used in the region of image recognition technique. The local relationship of two images will be compared. It is a function of position. Figure 1 shows the center point before deformation is point P. The new position of point P is P* after the deformation. The relation between these two positions is:
* * ( , ) ( , ) x x u x y y y v x y = + = + (1)
Figure 1: The relative position of the subimages before and after deformation [Chu, et al 1985]
The image before deformation can be divided into discrete subimage (facets) using the concept of finite element method. (as shown in Figure 2) The grayscale summation of the associate subimages before and after the deformation is the same. Assume that the subimage before deformation is image A and the subimage after deformation is image B. An image correlation function can be used to determine the degree of similarity of these two images. The definition of image correlation function is: (Chu, el al 1985, Russell, et al 1989)
2 2 ij ij ij ij g g COF g g = ⋅
∑
∑ ∑
% % (2)where g and ij g~ are the grayscale of image A at coordinate ij ( ji, ) and image B at
coordinate (i, j) , respectively. The coordinate (i, j) is the corresponding coordinate )
,
( ji of image A in image B.
The image correlation function of every subimage will be optimized in order to find highest correlation value. Then the corresponding coordinate of the subimage after deformation can be found out. One can calculate the displacement of every node using the coordinates before and after deformation. Then the full displacement field can be established.
Figure 2: Discretization of the image Calculation of the Strain Field
The definition of Green-Lagrange’s tensor E is: 1
2
T
E= ⎡⎣F ⊗ −F I⎤⎦ (3)
where F is the tensor of displacement gradient, I is the unit matrix. The tensor E can also be displayed as function of displacement field in the following form:
(
, ,)
, ,1 1
2 2
ij i j j i k i k j
E = u +u + u u (4)
where )i,j,k∈(x,y and ui,j =δui/δj. Hence, the strain can be calculated using the
following equations. 2 2 1 2 y x x xx u u u x x x ε =∂ + ⎡⎢⎜⎛∂ ⎞⎟ +⎛⎜∂ ⎞⎟ ⎥⎤ ∂ ⎢⎣⎝ ∂ ⎠ ⎝ ∂ ⎠ ⎥⎦ (5) 2 2 1 2 y x y yy u u u y y y ε =∂ + ⎡⎢⎜⎛∂ ⎞⎟ +⎛⎜∂ ⎞⎟ ⎥⎤ ∂ ⎢⎣⎝ ∂ ⎠ ⎝ ∂ ⎠ ⎥⎦ (6) 1 1 2 2 y y y x x x xy u u u u u u y x x y x y ε = ⎜⎛∂ +∂ ⎞⎟+ ⎢⎡∂ ∂ +∂ ∂ ⎤⎥ ∂ ∂ ∂ ∂ ∂ ∂ ⎝ ⎠ ⎣ ⎦ (7)
PERFORMANCE AND APPLICATION
Our software, which can be used to analyze the strain, is developed according to the above theory. A rigid body motion is analyzed using this software in order to realize the theoretical accuracy and precision of this software. The theoretical strain is 0. The result of analysis will be compared with this theoretical value.
An application of this software to analyze a plane strain compression is also carried out. One can see the deformation.
Performance verification
A sample is fixed on a translating instrument. The translation of this instrument in x- and y-direction can be adjusted. A rigid body motion with a displacement of 0.02mm (ca. 0.4 pixels) in x-direction is investigated. The images before and after rigid body motion are shown in figure 3.
(a) (b) Figure 3: Images (a)before and (b)after rigid body motion
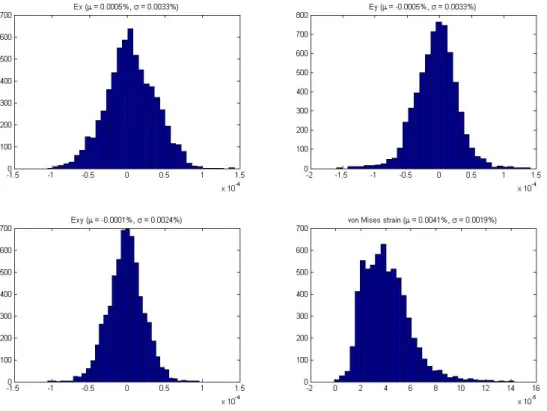
The results of analysis are shown in figure 4. The maximum strain in both x- and y-direction is about 1.5×10⁻⁴ and the maximum shear strain is about 1.2×10⁻⁴
. The distributions of these strains are shown as histograms in figure 5. The average strain values are εx = ×5 10−6 , εy = − ×5 10−6 and εxy = − ×1 10−6, whereas the standard deviations of these strains are σ ε
( )
x 3.3 10 5− = × , σ ε
( )
y 3.3 10 5 − = × and σ ε( )
xy 2.4 10 5 − = × . The size of the subimage is chosen as 128×128 pixels. Therefore, the maximum standard deviation of these strains corresponds to about 0.004 pixels.Figure 5: Distribution of measured strains of the rigid motion Example Application
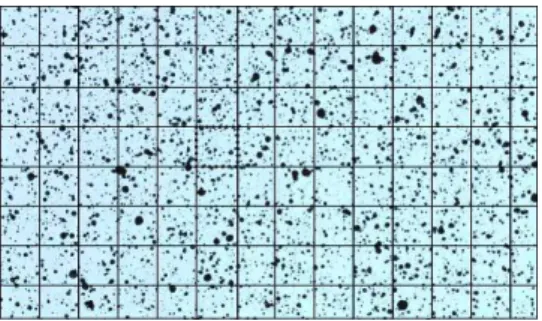
After verifying the performance of the software, the analysis of an aluminum poly-crystal compressed in a channel-die (Kuo, et al 2005) is carried out. The surface of the sample is marked with black and white paint (as shown in figure 6). The image before compression is registered by a digital camera. Then the sample is compressed to the strain of 5% and 10%. The images at 5% (figure 7) and 10% strain are also registered by the digital camera. Then the analysis of the strain with the help of developed software is carried out.
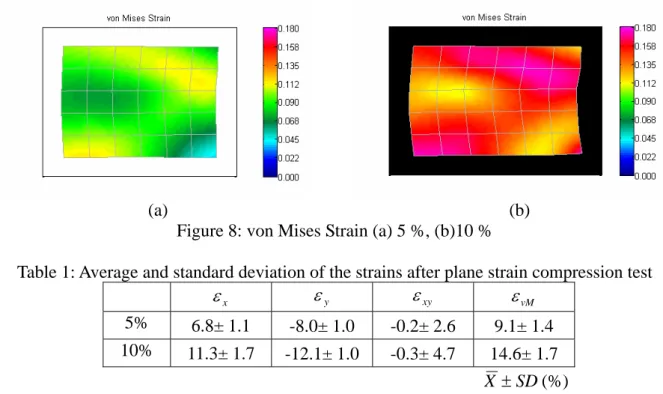
Figure 8 shows the strain distribution of the sample surface. We can observe that the strain distribution in the test is not homogeneous. The average strains are shown in Table 1. Figure 8 also shows that the von Mises Strains are not uniform in both 5% and 10% cases. Therefore, the heterogeneity in this plastic deformation is successfully visualized. (Kuo, et al 2003, Zaefferer, et al 2003)
(a) (b) Figure 8: von Mises Strain (a) 5 %, (b)10 %
Table 1: Average and standard deviation of the strains after plane strain compression test
x ε εy εxy εvM 5% 6.8± 1.1 -8.0± 1.0 -0.2± 2.6 9.1± 1.4 10% 11.3± 1.7 -12.1± 1.0 -0.3± 4.7 14.6± 1.7 SD X ± (%) CONCLUSION
The resolution and application of the digital-image-correlation techniques are demonstrated in this report. The results show that the maximum standard deviation of these strains corresponds to an error of displacement of about 0.004 pixels in x- and y-direction. Our selfdeveloped method is successfully applied to analyze the strain distribution on a compressed aluminum poly-crystal and the deformation evolutions can be visualized by means of the digital-image-correlation technique.
REFERENCE
Chu, T.C., Ranson, W.F., Sutton, M.A. and Peters, W.H. (1985), “Application of Digital-Image-Correlation Techniques to Experimental Mechanics”, Experimental
Mechanics, 25(3), p.232
Kuo, J.C., Tung, S.H., Shih, M.H. and Chen, D. (2005), “Application of Digital-Image-Correlation Techniques to crystal plasticity”, Proceedings of the
Conference on Computer Applications in Civil & Hydraulic Engineering, Tainan, Taiwan.
(in Chinese)
Kuo, J.C., Zaefferer, S., Zhao, Z., Winning, M. and Raabe, D. (2003), “Deformation Behavior of Aluminum Bicrystals”, Advanced Engineering Materials, 5 , p.563
Russell, S.S. and Sutton, M.A. (1989), “Strain field analysis aquired through correlation of x-ray radiography of a fiber reinforced composite laminate”, Experimental Mechanics, 29, p.237-240
Zaefferer, S., Kuo, J.C., Zhao, Z., Winning, M. and Raabe, D. (2003), “On the influence of the grain boundary misorientation on the plastic deformation of aluminum bicrystals”, Acta
![Figure 1: The relative position of the subimages before and after deformation [Chu, et al 1985]](https://thumb-ap.123doks.com/thumbv2/9libinfo/7418066.104907/2.892.326.565.645.986/figure-relative-position-subimages-deformation-chu-et-al.webp)