DATA ANALYSES WITH IEA’S TIMSS AND
PIRLS INTERNATIONAL DATABASES
Pierre Foy 1
Liqun Yin 2
ABSTRACT
Large-scale assessments in education, such as IEA’s TIMSS and PIRLS, rely on sophisticated assessment instruments, elaborate sample designs, and leading-edge item response theory to meet their analytical objectives. Both assessments provide a rich and complex database intended to support and promote secondary analyses. This paper describes the complex international database structures and the statistical methods and procedures for analyzing TIMSS and PIRLS data, with examples provided for illustration. Three essential elements must be considered by researchers in any statistical analysis based on data from the TIMSS and PIRLS international databases. The first is the use of sampling weights in order to produce accurate and reliable results. Second, both assessments apply the Jackknife Repeated Replication technique to derive proper estimates of sampling variance. Finally, with student achievement reported as sets of five plausible values, statistical analyses are performed five times, once for each plausible value, and the final results aggregated across the five plausible values. Researchers and users of the TIMSS and PIRLS international databases who conduct their analyses as described in this paper should feel confident in the results their analyses will yield.
Keywords: item response theory, jackknife repeated replication, matrix sampling, multi-stage cluster sampling, plausible values, PIRLS, TIMSS
Pierre Foy (corresponding author), Director of Psychometrics, Sampling and Data Analysis,
TIMSS and PIRLS International Study Center, Boston College. E-mail: [email protected]
Liqun Yin, Research Psychometrician, TIMSS and PIRLS International Study Center, Boston College.
E-mail: [email protected]
Introduction
Large-scale assessments in education have grown over the past few years and play a predominant role around the world in assessing the impact of education policy and practices on student attainment over time. They typically rely on sophisticated assessment instruments, elaborate sample designs, and leading-edge item response theory (IRT) to meet their analytical objectives. These design elements require special methods for developing the database, retrieving the necessary information, and applying the correct estimation computations to provide users with valid results.
TIMSS (Trends in International Mathematics and Science Study) and PIRLS (Progress in International Reading Literacy Study) are two notable international large-scale assessments that have been in place for some 25 years. TIMSS, which measures student achievement in mathematics and science at the fourth and eighth grades, was introduced in 1995 and has been administered at four-year intervals (Mullis & Martin, 2013). There have been six cycles of TIMSS, with the most recent 2015 assessment measuring 20 years of trends. PIRLS, which measures reading achievement at the fourth grade, was launched in 2001 and is administered every five years (Mullis & Martin, 2015). Including PIRLS 2016, there have been four cycles of PIRLS. Both assessments call on those special designs and methods to provide a rich and complex international database intended to support and promote secondary analyses.
TIMSS and PIRLS are projects of IEA, the International Association for the Evaluation of Educational Achievement. Headquartered in Amsterdam, IEA has been conducting international comparative studies of student educational achievement since 1959. It is an independent, international cooperative of national research institutions and governmental research agencies from almost 70 member countries. IEA studies focus on subjects of particular interest to IEA members. These include mathematics, science, reading, civic and citizenship education, computer and information literacy, and teacher education, among others.
This paper describes the methods TIMSS and PIRLS used to produce achievement results. After a general description of the TIMSS and PIRLS assessments, the paper describes the TIMSS and PIRLS sample design and the
methods used for calculating sampling weights and for estimating achievement with appropriate variance estimates. It then describes the TIMSS and PIRLS assessment designs with a brief explanation of item response theory and the plausible values needed to adequately measure student achievement. The paper also briefly describes the complex international database structures and the statistical methods and procedures for analyzing TIMSS and PIRLS data, with a few examples provided for illustration.
Overview of the TIMSS and PIRLS Assessments
As large-scale assessments, both TIMSS and PIRLS aim to describe student achievement at the population level. TIMSS measures trends in mathematics and science achievement at the fourth and eighth grades and offers participating countries the opportunity to compare the effectiveness of their mathematics and science education with that of other countries around the world. PIRLS provides internationally comparative trend data about how well children from different countries read after four years of primary schooling. In addition to high quality student achievement data in reading, mathematics, and science, both assessments provide participants with important background information related to the educational context—the curriculum, home supports for literacy and numeracy, school environments, and instructional practices. By relating cross-national achievement to the different methods for teaching and learning used across the globe, TIMSS and PIRLS enable countries to learn about effective educational approaches from each other.
To collect data efficiently and reliably, TIMSS and PIRLS utilize a series of complex procedures to draw student samples from the target population and to distribute achievement items to sampled students. Thus conceptually, sampling occurs at two levels: students and items and both levels of sampling need to be accounted for when deriving valid and reliable statistical results. A two-stage stratified cluster sample design is used in both assessments to draw student samples, with a sample of schools drawn with probabilities proportional to their size (PPS) and one or two intact classes of students selected from each sampled school (Joncas & Foy, 2012). The resulting clustered sample design is more complex than a simple random sample and less efficient in terms of required sample size, necessitating special methods to calculate sampling weights, unbiased statistical results, and appropriate estimates of sampling variance.
To keep the assessment burden on any single student to a minimum, TIMSS and PIRLS adopt a matrix-sampling test design to distribute the achievement items, with each student assigned only a fraction of the entire pool of assessment items (e.g., Mullis & Martin, 2013, 2015). Both assessments then rely on Item Response Theory and multiple imputation methodology to aggregate item responses across students and estimate achievement at the population level. The multiple imputation methodology produces a set of plausible values for each student which can be aggregated across students to get unbiased population estimates of achievement. The use of plausible values requires special methods for analyzing and reporting population achievement results.
To better understand the contextual factors that affect students’ learning processes and achievement results, TIMSS and PIRLS administer a set of context questionnaires to students, their parents, their teachers, and their school principals. These questionnaires collect a wide range of information about students’ home and school contexts intended to provide insight into effective teaching and learning strategies towards developing and improving educational systems. The student questionnaire provides data on basic student characteristics and their attitudes towards learning and the parent questionnaire provides information on the general home environment. The teacher questionnaire focuses on practices known to improve teaching and learning and the school questionnaire describes the school’s environment and organization.
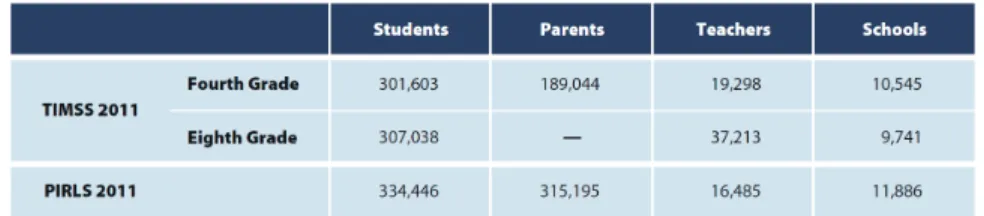
The TIMSS and PIRLS assessments produce large volumes of data collected from students, their parents, their teachers, and their school principals. These data are complex in nature and are provided as international databases, along with relevant documentation, after each assessment cycle. Figure 1 shows the numbers of records present in the TIMSS 2011 and PIRLS 2011 international databases. Almost one million students from around the world took part in both assessments in 2011.
Figure 1. Contents of the TIMSS 2011 and PIRLS 2011 International Databases
The TIMSS and PIRLS Sample Design
TIMSS and PIRLS are designed to provide valid and reliable measurement of student achievement, while minimizing the data collection burden on schools, teachers, and students. They both employ a two-stage stratified cluster sample design, where schools stratified into homogeneous groups are sampled in a first stage and one or more intact classes of students are selected in a second stage (Joncas & Foy, 2012). Based on the TIMSS and PIRLS standards of precision, national samples typically consist of 150 schools and 4,000 students.
Schools are sampled with probabilities proportional to their size, which means larger schools have higher selection probabilities than smaller schools. The stratification of schools and the use of PPS selection are intended to improve the efficiency of the sample design and ensure adequate representation of specific groups of schools and students in the national samples. A fixed number of classes—usually one or two—are selected with equal probabilities within sampled schools and all eligible students from the selected classes are included in the assessment. Combining the PPS selection of schools at the first stage and the sampling of a fixed number of classes per school at the second stage ensures that all sampled students carry roughly the same weight—a self-weighting design. In practice, however, disproportionate sampling across school strata and differential patterns of non-response among schools, classes, and students generally result in variations in the weight each sampled student ultimately carries. The sampling weights are used to account for these variations and thus they are essential for computing unbiased results.
Sampling Weights
The student sampling weights in TIMSS and PIRLS are a combination of the selection probabilities and non-response adjustments applied to the schools, the classes, and the students. Consequently, they account for any unequal selection probabilities and any differential non-response patterns that can arise through the sampling process and data collection. A student sampling weight is meant to describe the import of any given student’s contribution to the full national sample in terms of his or her final selection probability, corrected for any non-response arising from schools, classes, or students that did not take part in the assessment. Consequently, sampling weights must be used when computing any statistics derived from a sample in order to produce accurate and reliable results. The derivation of the final student sampling weights—labeled TOTWGT in the TIMSS and PIRLS international databases—is described in detail in the TIMSS and PIRLS Methods and Procedures documentation (Joncas & Foy, 2012).
Sampling Variance
TIMSS and PIRLS make extensive use of probability sampling to derive achievement results from national samples of students. Because many such samples are possible and only one sample is drawn, some uncertainty in the results obtained is to be expected. The uncertainty caused by sampling students from a target population, known as sampling variance, can be estimated from the data of the one sample drawn. Whereas estimating the sampling variance from simple random samples is a relatively easy task, estimating the sampling variance from the complex sample designs of TIMSS and PIRLS is a more challenging endeavor.
When, as in TIMSS and PIRLS, the complex sample design involves multistage cluster sampling, the sampling variance estimates are usually obtained by resampling schemes, such as the balanced repeated replication and Jackknife techniques (Johnson & Rust, 1992; Wolter, 1985). TIMSS and PIRLS use one variation of the Jackknife, the Jackknife Repeated Replication (JRR), to estimate sampling variances. The JRR technique is chosen because it is computationally straightforward and provides approximately unbiased estimates of the sampling variances and sampling errors of means, total, and percentages (Foy, 2012).
The basic principle underlying the JRR technique is the repeated drawing of subsamples from the full sample under the same sample design conditions, i.e., repeated replication. The stratification of schools and the clustering of students within schools are the two main features of the TIMSS and PIRLS sample design that the JRR strives to replicate in its repeated draws of subsamples. This is done by defining Jackknife sampling zones to replicate the strata and by pairing successive schools to model the clustering from each national sample (Foy, 2012). Since most national samples consist of 150 schools, a total of 75 zones are created. If more than 150 schools are selected, then the additional zones are collapsed into the first 75 zones. The subsampling required of the JRR is applied within each sampling zone.
The JRR procedure draws two subsamples from each sampling zone: a first one where the first school in the pair is included and the second school is removed, and a second subsample where the second school is included and the first school is removed.1 In both subsamples, all students in the other sampling zones are included. With this process applied in each of the 75 sampling zones, the JRR procedure yields a total of 150 replicate subsamples, each one with its own set of replicate sampling weights to account for the successive removal of each school from the pair of schools in any given sampling zone.
The process of creating replicate sampling weights for the replicate subsamples defines replicate factors khj as follows:
2 for students in school j of sampling zone h for students in the other school of sampling zone h
for students in any other sampling zone 0 1 hj k (1)
These replicate factors are used to compute the 150 sets of replicate sampling weights as follows:
0
hji hj i
W k W (2)
1 Prior to 2015, TIMSS and PIRLS used 75 subsamples and sets of replicate weights to calculate
the JRR sampling variances. To provide more accurate estimates, starting in 2015 TIMSS and PIRLS use 150 subsamples and sets of replicate weights to calculate the JRR sampling variances. Two subsamples are drawn from each sampling zone rather than one randomly selected subsample.
where W0i is the overall sampling weight of student i and Whji is the resulting
replicate sampling weight of student i when school j from sampling zone h is included and the other school in the pair is removed.
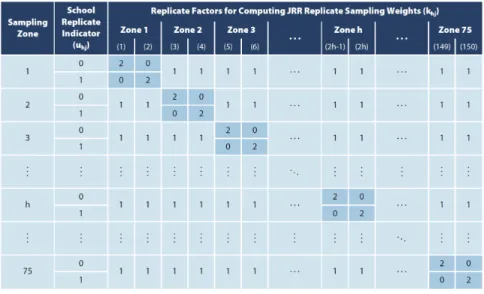
Figure 2 illustrates how the replicate factors, necessary to produce the replicate sampling weights, are derived. Within each sampling zone, each school is assigned randomly an indicator uhj, coded either 0 or 1, such that one school has a value of 0, the other a value of 1. This indicator serves to identify which school within each zone will be successively included or removed. When a school is removed from a zone, the replicate factor is set to zero and the sampling weights of all students in that school will be set to zero; when a school is included, the replicate factor is set to two and the sampling weights of all students in that school will be doubled. The sampling weights of students in all other sampling zones remain unchanged.
Figure 2. Construction of Replicate Factors across Sampling Zones
For example, sampling zone 1 yields two sets of replicate sampling weights. The first set has doubled sampling weights (khj 2) for the students in the first school (uhj 0) of zone 1, zeroed sampling weights (khj 0) for the students in the second school (uhj 1) of zone 1, and unchanged sampling weights (khj = 1) for all students in the other sampling zones. The second set of replicate sampling weights has zeroed sampling weights (khj 0) for the
students in the first school (uhj 0) of zone 1, doubled sampling weights (khj 2) for the students in the second school (uhj 1) of zone 1, and unchanged sampling weights (khj 1) for all students in the other sampling zones. The process is repeated across all 75 possible sampling zones, generating 150 sets of replicate sampling weights. The replicate sampling weights are then used to estimate a statistic of interest 150 times. The variation across these 150 jackknife estimates determines the sampling variance.
Given a statistic t to be computed from a national sample, the formula used to estimate the sampling variance of that statistic, based on the TIMSS and PIRLS JRR algorithm, is given by the following equation:
75 2 2 0 0 1 1 1 ( ) ( ) 2 jrr hj h j Var t t t
(3)where the term t0 denotes the statistic of interest estimated with the overall
student sampling weights W0i and the term thj denotes the same statistic
computed using the set of replicate sampling weights obtained from sampling zone h (h 1, , 75), where the jth school (1st or 2nd) in the zone is included
and the other removed.
The sampling variance estimated with the TIMSS and PIRLS JRR method measures properly the variation arising from having sampled students using the multi-stage stratified cluster sample design. Its square root is the standard error for any statistic derived from variables other than plausible values. Examples of such statistics are the mean age of students, the mean of the PIRLS Students Like Reading contextual scale, and the percentage of students with at least one parent with a university degree.
The TIMSS and PIRLS Assessment Design
Central to the TIMSS and PIRLS mission is to provide comprehensive and internationally comparable achievement data for each participating country that can be used to evaluate the success of educational systems. This requires an assessment with a pool of items that is wide ranging in its coverage of content and cognitive aspects in each subject. The number of items in the subject pool is usually much more than can be reasonably answered by any one student given the amount of testing time available. For example, the PIRLS 2011 assessment consisted of 10 reading passages and
135 questions, which would take a student more than six hours to respond. The TIMSS 2011 assessment consisted of 175 mathematics items and 172 science items at the fourth grade; 217 mathematics items and 217 science items at the eighth grade (Mullis, Drucker, Preuschoff, Arora, & Stanco, 2012). At each grade level, it would take more than 8 hours for a student to respond. To reliably and efficiently collect achievement data, both TIMSS and PIRLS adopt a matrix-sampling test design to keep the assessment burden to a minimum, each student being presented a subset of the assessment items according to a booklet assembly and rotated assignment procedure.
Matrix Sampling
The matrix-sampling test design is an efficient approach which solicits relatively few responses from each sampled student, while maintaining a wide range of content representation when responses are aggregated across students. But this comes at the cost of greater complexity in booklet assembly and data collection and also the inability to make precise statements about individual students’ achievement.
Within each subject domain—mathematics and science for TIMSS and reading for PIRLS, the large pool of items is divided into blocks, each with roughly an equivalent number of items and, as far as possible, comparable coverage of the content and cognitive domains. For example, the TIMSS 2015 assessment consists of 14 mathematics item blocks and 14 science item blocks at each grade level (Mullis & Martin, 2013); the PIRLS 2016 assessment consists of 12 blocks, each with a text passage and associated items (Mullis & Martin, 2015). These item blocks are then distributed across assessment booklets using a technique called balanced incomplete block (BIB) design. For example, the TIMSS 2015 assessment consists of 14 assessment booklets at each grade level, each booklet consisting of two mathematics item blocks and two science item blocks, and each item block appearing in two booklets. The PIRLS 2016 assessment consists of 16 booklets, each consisting of two blocks and each block appearing in three booklets. The TIMSS and PIRLS assessment booklets are rotated, one per student, across all sampled students. Item Response Theory
The TIMSS and PIRLS assessments rely on Item Response Theory (IRT) and latent proficiency estimation to obtain student proficiency scores. The IRT methodology uses “latent variable” models to describe the probability that a
student will respond correctly to an item depending on the student’s proficiency, which is an unobserved or latent trait, and characteristics or parameters of the item. A three-parameter model is used for multiple-choice items to determine an item’s difficulty, discrimination and lower asymptote (the probability of answering correctly for low-proficiency students). A two- parameter model (difficulty and discrimination) is used for one-point constructed-response items and a partial-credit model is used for multi-point constructed-response items to account for the increasing difficulty of getting higher credit on such an item (Foy, Brossman, & Galia, 2012).
Student proficiency scores are obtained by combining the students’ responses to the items they were administered, the item parameters estimated by the IRT latent variables models, and information about students’ backgrounds through a process called conditioning (Foy et al., 2012). Conditioning is used to enhance the reliability of the student scores to compensate for the limited number of items administered to any given student. However, the advantage of estimating population characteristics more efficiently with a matrix-sampling test design remains offset by the presence of some uncertainty in the individual student ability estimates that cannot be ignored. As a result, TIMSS and PIRLS follow the established multiple imputation procedure (Rubin, 1987) of generating five estimates—plausible values—for each student and using the variation among them as a measure of this uncertainty, or imputation variance.
The five plausible values are not point estimates of student proficiency in the traditional sense. Rather, they represent the range of abilities that a student might reasonably have (Wu, 2005) and thus are not appropriate for reporting as individual student scores (Mislevy, Beaton, Kaplan, & Sheehan, 1992; Mislevy, 1993). The plausible values, besides accounting for the uncertainty in the proficiency estimation procedure, also provide an accurate representation of the underlying relationships between the students’ background variables and their proficiency estimates through the conditioning process. Consequently, all five plausible values are needed when conducting analyses in order to account fully for these relationships and to estimate properly the added variance arising from the imputation process.
Imputation Variance
The general procedure for estimating the imputation variance when analyzing student achievement data follows the basic principle of performing
any statistical analysis five times—once for each set of plausible values—and aggregating the five sets of results (Mislevy et al., 1992). Thus for any given achievement-based statistic t, estimating that statistic from each plausible value yields five estimates tm, m 1,,5, all of them computed using the overall student sampling weights W0i. The final estimate of that statistic, t0, is
the average of these five estimates:
5 0 1 1 5m m t t
(4)The imputation variance of the statistic t0 is simply the variance of the
five results from the plausible values, computed as follows:
2 5 0 0 1 6 ( ) ( ) 5 4 m imp m t t Var t
(5)where the factor 6/5 is a correction factor required by the multiple imputation methodology. This imputation variance is then added to the sampling variance to produce the total variance estimate of the statistic t0, as follows:
0 0 0
( ) ( ) ( )
tot jrr imp
Var t Var t Var t (6)
The sampling variance in this context is the average of the sampling variances from the five plausible values, as follows:
5 0 1 1 ( ) ( ) 5 jrr jrr m m Var t Var t
(7) where 75 2 2 1 1 1 ( ) ( ) 2 jrr m mhj m h j Var t t t
(8)and tmhj is the appropriate JRR estimate based on plausible value m computed using the set of replicate sampling weights from sampling zone h where school j is included. The square root of the total variance is then the proper standard error for any statistic based on plausible values, such as the average PIRLS reading achievement for girls and the percentage of students who reach the PIRLS advanced international benchmark of reading achievement.
The TIMSS and PIRLS International Databases
All data collected and produced from successive cycles of the TIMSS and PIRLS assessments are provided in their respective international databases, publicly available from the TIMSS and PIRLS International Study Center’s website (TIMSSandPIRLS.bc.edu). The international databases contain all student achievement data, as well as all student, parent, teacher, school, and curriculum background data. They are a unique resource for policy makers, researchers, and educators. Each international database is accompanied with a user guide (e.g., Foy, Arora, & Stanco, 2013; Foy & Drucker, 2013) to help researchers better understand the complex data structure across the various files in the database, as well as instructions and guidance in carrying out proper analyses using the sampling weights, applying the JRR technique for estimating sampling variance, and dealing with plausible values.
TIMSS and PIRLS also provide software tools—the IEA International Database Analyzer (International Association for the Evaluation of Educational Achievement [IEA], 2013)—to perform proper analyses with these international databases. They can perform basic analyses of the TIMSS and PIRLS data such that users need not concern themselves with the methodological procedures described in this paper since they are all applied automatically. The software also recognizes the linkages among the various database files that contain the data and design variables at all levels needed to conduct statistical analyses seamlessly. For more complex analyses, users will have to rely on other software that incorporates these procedures, such as HLM and MPLUS. The alternative is to apply explicitly the methods described in this paper. To that end, we provide a few basic examples to illustrate the general application of these procedures to the TIMSS and PIRLS data.
Working With the TIMSS and PIRLS International
Databases
For analyzing TIMSS and PIRLS data, this paper has emphasized the need to consider three major design elements: use sampling weights, apply the Jackknife Repeated Replication technique for correctly estimating the sampling variance from the complex student sample designs, and use plausible values when analyzing achievement data to account for the imputation
variance that arises from the matrix-sampling test design. This section presents a few practical examples of analyses from the TIMSS and PIRLS assessments to illustrate the use of the JRR technique and the plausible values for the purpose of estimating accurately the sampling variance and the imputation variance.
The first example will show explicitly the application of the sampling weights and replicate weights derived by the JRR technique for estimating the mean score on the PIRLS Students Like Reading contextual scale and its sampling variance. A second example will illustrate the use of plausible values in estimating the mean PIRLS reading achievement, including the imputation variance. A third example will extend the second example to estimate reading achievement by gender.
Computing the Sampling Variance
A simple example from the PIRLS 2011 assessment should illustrate how the Jackknife Repeated Replication technique is used to compute the sampling variance, using one of the PIRLS 2011 contextual scales. TIMSS 2011 and PIRLS 2011 report contextual data using scales based on Rasch modeling (Martin, Mullis, Foy, & Arora, 2012). A number of contextual scales, including Students Like Reading, were reported in the PIRLS 2011 International Report and are available in the PIRLS 2011 International Database for analysis. Each contextual scale measures a single underlying latent construct by combining responses to a set of questions related to that construct. Each contextual scale is a Rasch scale with an international mean of 10 and an international standard deviation of 2.
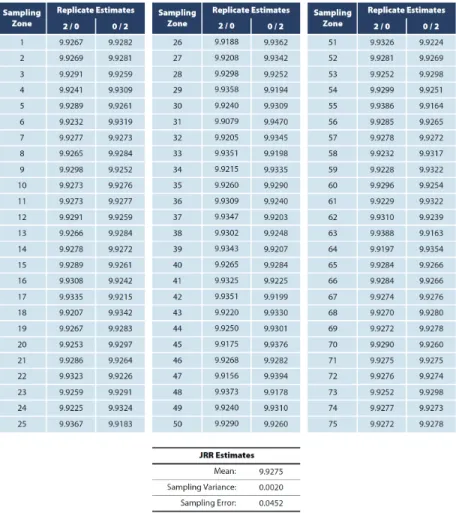
Figure 3 shows all of the replicate estimates of the mean PIRLS 2011 Students Like Reading scale score in Australia. Recall that each of the 150 sets of replicate weights is used to produce an estimate of a statistic of interest, in this instance the mean Students Like Reading scale score, based on the sampling zones and the successive inclusion and exclusion of each school within a zone.
The mean Students Like Reading scale score for Australia is computed using the overall student sampling weights and is estimated to be 9.9275, as shown at the bottom of Fig. 3. The variation among the 150 replicate estimates is used to estimate the sampling variance, using Eq. (3) shown earlier. The result is a sampling variance of 0.0020, with the sampling error of 0.0452 being the square root of the sampling variance.
Figure 3. Replicate estimates of the Mean Students Like Reading Scale from Australia’s
PIRLS 2011 Assessment Using Jackknife Repeated Replication
Computing the Imputation Variance
In the TIMSS and PIRLS databases, achievement results are always presented as sets of five plausible values. For example, the reading achievement of each student in a PIRLS international database is given by a set of five variables labeled ASRREA01 through ASRREA05 to represent the five plausible values. These plausible values serve not only to estimate population achievement, but also to estimate the imputation variance arising from the implementation of matrix-sampling test design and the subsequent application of IRT models.
A second analysis example demonstrates how the plausible values are used to analyze achievement data, and in particular to estimate the imputation variance. The basic principle is to compute the achievement-based statistics of interest five times, once for each plausible value, and aggregating the five sets of results. This example shows how to compute the overall mean reading achievement for Australia from the PIRLS 2011 database. As a consequence, the mean reading achievement is estimated for each plausible value, along with its sampling variance computed using the JRR technique described and illustrated earlier.
Figure 4 shows the results of the computed estimates of mean reading achievement and the sampling variances among the five plausible values. For example, plausible value 1 produces an estimate of mean reading achievement of 528.2922 with a JRR sampling variance of 4.4972. Underlying this JRR sampling variance estimate is a virtual table, like the one shown in Fig. 3, with the 150 replicate estimates derived from plausible value 1. The same is true of all plausible values; there are five virtual tables of 150 replicate estimates to generate the five JRR sampling variances of Fig. 4. All told, a total of 750 replicate estimates—150 for each of the five plausible values—are computed to produce these results.
The final estimates are obtained by aggregating the results across the five plausible values. Thus the overall mean achievement is estimated to be 527.3720, the average of the five mean estimates. Similarly, the sampling variance is estimated to be 5.0268, the average of the five JRR sampling variance estimates. The imputation variance is 0.3746, the variance of the five mean estimates adjusted by the factor 6/5. Finally, the standard error appropriate for the estimated overall mean achievement is 2.3241, the square root of the sum of the sampling variance and the imputation variance.
Figure 4. Estimates of Mean Reading Achievement from Australia’s PIRLS 2011
Assessment Using Plausible Values
Estimating Mean Achievement for Population Sub-Groups
A third example illustrates the calculation of achievement results for population sub-groups. In this example, which extends the analysis of the previous example, the statistics of interest are the mean achievement by gender and the difference in achievement between girls and boys. This example is of particular interest when investigating the presence of a gender difference and determining if it is statistically significant.
The results of this gender analysis are presented in Fig. 5. It shows the results for each of the five plausible values, as well as the final estimates obtained by aggregating the results across the five plausible values. Again, underlying the results for each plausible value is a virtual table with the results from the 150 replicate subsamples. This time, however, each replicate subsample yields three estimates: The mean achievement for girls, the mean achievement for boys, and the difference between the two mean achievements. Hence, we obtain three estimates with their JRR sampling variances for each plausible value. For example, plausible value 1 estimates the mean reading achievement for girls as 536.8675 with a sampling variance of 6.5530, the mean reading achievement for boys as 519.9655 with a sampling variance of 6.9550, and the gender difference as 16.9020, favoring the girls, with a sampling variance of 9.0829.
Figure 5. Estimates of Mean Reading Achievement by Gender from Australia’s PIRLS
2011 Assessment
The final estimates, obtained by aggregating the results across the five plausible values, produce a mean reading achievement of 535.7858 for the girls, 519.2019 for the boys, and a gender difference of 16.5839. Thus the girls outperform the boys by 16.6 points on the PIRLS reading achievement scale. The sampling variances, imputation variances, and resulting standard errors also are provided in Fig. 5. Of special interest is the standard error of the gender difference since it will determine whether the estimated gender difference of 16.6 points is statistically significant. With its standard error estimated at 3.1418, the observed gender difference is indeed statistically significant—the t-test statistic value being 5.2785.
It is important to emphasize the need to use the JRR technique to estimate the sampling and imputation variances of the gender difference, or of any difference between sub-groups. Although estimating the gender difference can be accomplished simply by subtracting the estimates of achievement for girls and boys, estimating the sampling variance and imputation variance of the gender difference cannot be done so simply. The reason for this is that reading achievement for girls and boys are correlated because of the clustered sample design. Girls and boys in any given school tend to perform at comparable levels, notwithstanding any gender difference, i.e., high-achieving girls and boys tend to come from the same schools. This correlation will be less in education systems with girls’ schools and boys’ schools. Thus it is always a good strategy to estimate differences between population sub-groups using the
JRR technique to properly account for any correlation that might be present in the sample. In this example, relying solely on the estimated standard errors of achievement for girls and boys to estimate the standard error of the gender difference will produce an estimate of 3.9633 (3.9633 2.852222.75182 ), a
result larger than the one obtained with the JRR technique. This simpler calculation yields a larger, and incorrect, result because it ignores the presence of a positive correlation in the sample between the reading achievement of girls and boys.
Conclusion
The TIMSS and PIRLS international databases are invaluable resources for investigating educational attainment and the context in which it takes place. They consist of a wealth of data on a multitude of contextual constructs and achievement data collected through elaborate assessment instruments and context questionnaires from students, their parents, teachers, and school principals. National samples of students are drawn from complex sample designs and sophisticated statistical models are applied to derive the achievement results. As a consequence of employing these elaborate designs and models, researchers and users of the international databases must rely on special techniques to perform proper statistical analyses.
This paper has described the special techniques used in the TIMSS and PIRLS assessments, explained how they should be used, and illustrated their use with a few basic examples. Three essential elements must be considered in any statistical analysis based on data from the TIMSS and PIRLS international databases. The first and perhaps most basic element is the use of sampling weights. Only with sampling weights can we be assured that analytical results have taken into account adequately any variations in selection probabilities at all sampling stages, including schools, classrooms, and students. Sampling weights also take into consideration any differential response rates across strata and within sampling units.
Second, because student samples are drawn using complex multi-stage cluster sample designs, the correct estimation of the sampling variance requires the use of special estimation methods. TIMSS and PIRLS employ the Jackknife Repeated Replication technique and it must be used in order to derive proper estimates of sampling variance. Finally, student achievement is
derived from sophisticated Item Response Theory models and conditioning to deal with the use of matrix sampling to reduce the assessment load on the sampled students. Consequently, student achievement is reported in the international databases as a set of five plausible values. Conducting analyses of achievement requires performing these analyses five times, once for each set of plausible values, and aggregating the results across the five plausible values.
Researchers and users of the TIMSS and PIRLS international databases who conduct their analyses as described in this paper—use the sampling weights, apply the JRR technique, and perform their analyses five times—should feel confident in the results their analyses will yield.
References
Foy, P. (2012). Estimating standard errors for the TIMSS and PIRLS 2011
achievement scales. Chestnut Hill, MA: TIMSS & PIRLS International Study
Center at Boston College. Retrieved from http://timss/methods/pdf/TP11_ Estimating_Achievement.pdf
Foy, P., Arora, A., & Stanco, G. M. (Eds.). (2013). TIMSS 2011 international database
and user guide. Chestnut Hill, MA: TIMSS & PIRLS International Study Center,
Boston College.
Foy, P., Brossman, B., & Galia, J. (2012). Scaling the TIMSS and PIRLS 2011
achievement data. Chestnut Hill, MA: TIMSS & PIRLS International Study
Center at Boston College. Retrieved from http://timssandpirls.bc.edu/methods/ pdf/TP11_Scaling_Achievement.pdf
Foy, P., & Drucker, K. T. (Eds.). (2013). PIRLS 2011 international database and user
guide. Chestnut Hill, MA: TIMSS & PIRLS International Study Center, Boston
College.
International Association for the Evaluation of Educational Achievement. (2013).
International database analyzer (version 3.1). Hamburg, Germany: IEA Data
Processing and Research Center.
Johnson, E. G., & Rust, K. F. (1992). Population inferences and variance estimation for NAEP data. Journal of Educational Statistics, 17(2), 175-190.
Joncas, M., & Foy, P. (2012). Sample design in TIMSS and PIRLS. Chestnut Hill, MA: TIMSS & PIRLS International Study Center at Boston College. Retrieved from http://timssandpirls.bc.edu/methods/pdf/TP_Sampling_Design.pdf
Martin, M. O., Mullis, I. V. S., Foy, P., & Arora, A. (2012). Creating and interpreting
the TIMSS and PIRLS 2011 context questionnaire scales. Chestnut Hill, MA:
TIMSS & PIRLS International Study Center at Boston College. Retrieved from http://timssandpirls.bc.edu/methods/pdf/TP11_Context_Q_Scales.pdf
Mislevy, R. J. (1993). Should “multiple imputations” be treated as “multiple indicators”? Psychometrika, 58(1), 79-85.
Mislevy, R. J., Beaton, A. E., Kaplan, B., & Sheehan, K. M. (1992). Estimating population characteristics from sparse matrix samples of item responses. Journal
of Educational Measurement, 29(2), 133-161.
Mullis, I. V. S., Drucker, K. T., Preuschoff, C., Arora, A., & Stanco, G. M. (2012).
Assessment framework and instrument development. Chestnut Hill, MA: TIMSS
& PIRLS International Study Center at Boston College. Retrieved from http://timssandpirls.bc.edu/methods/pdf/TP_Instrument_Devel.pdf
Mullis, I. V. S., & Martin, M. O. (Eds.). (2013). TIMSS 2015 assessment frameworks. Chestnut Hill, MA: TIMSS & PIRLS International Study Center, Boston College. Mullis, I. V. S., & Martin, M. O. (Eds.). (2015). PIRLS 2016 assessment framework
(2nd edition). Chestnut Hill, MA: TIMSS & PIRLS International Study Center,
Boston College.
Rubin, D. B. (1987). Multiple imputation for nonresponse in surveys. New York, NY: John Wiley & Sons.
Wolter, K. M. (1985). Introduction to variance estimation. New York, NY: Springer- Verlag.
Wu, M. (2005). The role of plausible values in large-scale surveys. Studies in