* Author for correspondence. Tel & Fax: 02-23771942; E-mail: [email protected]
High Performance Liquid Chromatography Analysis of
Tetrahydrozoline Hydrochloride in Ophthalmic Solution
by Silica Column Eluted with Aqueous Solvent Mixtures
MING-CHUAN HUANG1,2, HSIU-O HO1, KUO-CHING WEN2 AND MING-THAU SHEU1*
1.Graduate Institute of Pharmaceutical Sciences, Taipei Medical University, 250 Wu-Hsing Street, Taipei, 110, Taiwan, R.O.C. 2.National Laboratories of Foods and Drugs, Department of Health, Executive Yuan, 161-2, Kuen Yang St., Nankang, Taipei 115, Taiwan, R.O.C.
(Received: July 5, 2001; Accepted: February 5, 2002) ABSTRACT
A HPLC method using bared silica column eluted with aqueous solvent mobile phase was developed for determination of tetrahydro-zoline hydrochloride in ophthalmic preparations. A mixture of methanol and water (70:30, v/v) containing 0.03% triethylamine and 0.02% acetic acid was used as mobile phase, and chlorpheniramine maleate as an internal standard. The flow rate was 1 mL/min and the detection was at 254 nm. The quantitation limit was 1.0 µg/mL. Average recoveries range from 98.9 to 99.9%. The linearity of the calibration curve of tetrahydrozoline hydrochloride was well correlated (r2= 0.9996) within the range from 12.5 to 500 µg/mL as well as from 1.0 to 20 µg/mL (r2= 0.9997). This study further reports a simple and quick method for routine quantitative analysis of tetrahydrozoline
hydrochlo-ride in an ophthalmic solution that contains a relatively high concentration of sulfamethoxazole sodium and methyl paraben. Key words: tetrahydrozoline, ophthalmic solution, analysis, HPLC, silica column
INTRODUCTION
Tetrahydrozoline hydrochloride (TH) is an adrenergic agent (vasoconstrictors) and derived from imidazoline. This compound is closely related to naphazoline hydrochloride in its pharmacological action. When applied topically to the nasal mucosa, TH causes vasoconstriction that results in reduction of local swelling and congestion. It is also used in a 0.05% solution as an ocular decongestant. Applied as a 0.05 or 0.1% solution as nasal drops or 0.05% solution as eye drops, TH nasal solution and ophthalmic solution are admit-ted in USP XXIV.
A number of methodologies are available for analysis of TH in nasal solution or ophthalmic solution. They include colorimetric (USP XXIV)(1), HPLC methods with octade-cylsilyl silica (ODS) column(2-4) and ion-pairing tech-nique(5,6), ODS column with buffering mobile phase(7,8), and gas chromatography (GC)(9). The colormetric method is tedious and insensitive for regular use. Recently, reversed– phase HPLC (RP-HPLC) has gained great appreciation for analysis of pharmaceutical substances. A large number of drugs possess a basic character, which are conveniently ana-lyzed when running RP-HPLC on chemically bonded phases such as ODS. However, it has been shown that basic com-pounds with a nitrogenous moiety often exhibit an unsatis-factory degree of peak tailing on bonded-phase packing materials. Adding anti-tailing agents such as amine modifiers or ion-pair reagents may reduce the problem of tailing. Although it can improve the peak tailing, as more salts are
added to the mobile phase, injuries to the columns and instru-mental tubing can be expected. In addition, it takes more time to prepare the mobile phase and rinse the columns and tubing after the assay is finished. Furthermore, the concentration of active ingredients in pharmaceutical preparations differs in a wide range. It is difficult to simultaneously analyze the desired ingredients with a wider difference in concentration.
This study describes a simple, quick and novel applica-tion of bared silica column. It offers a powerful and versatile approach to analyze an ophthalmic solution that is formulat-ed with a low concentration of TH with the presence of a high concentration of sulfamethoxazole sodium (SM) and methyl-paraben (MP).
MATERIALS AND METHODS I. Materials and Reagents
Tetrahydrozoline hydrochloride ophthalmic solution (contains sulphamethoxazole sodium) was provided by Wu Fu Laboratories Co., Ltd (Taipei, Taiwan). LC grade methanol was obtained from LAB-SCAN (Dublin Ireland). Triethylamine and acetic acid were the products of Merck (Darmstadt Germany). TH and chlorpheniramine maleate (CM) (internal standard) were the working standard provided by National Laboratories of Foods and Drugs, Taiwan, R.O.C.
II. HPLC Apparatus and Conditions
HPLC analysis was conducted with a Waters model of 510 solvent delivery pump with UV-VIS detector and U6K
injector. A LiChroCART 250-4 HPLC-Cartridge (Merck, Darmstadt Germany) LiChrospher Si 60 (5 µ m) column (Merck, Darmstadt Germany) was applied. The silica gel col-umn was initially preserved in hexane. Before analysis, a ser-ial recondition was conducted by eluting with solvent of gradually increasing polarity from ethyl acetate, dichloromethane, acetonitrile, methanol, and then water in the final (the volume for each solvent is approximately equal to 100 mL). Thereafter, this silica gel column can be eluted with the use of reversed-phase eluents. The mobile phase is consisted of a mixture (methanol:water = 7:3, v/v) that con-tains 0.03% (v/v) of triethylamine and 0.02% (v/v) of acetic acid. The flow rate is 1.0 mL/min, injection volume is 20 µL and the detection is at 254 nm.
III. Preparation of Standard Solutions
To examine the linearity of the assay, the calibration curve for TH at concentrations ranged from 12.5 to 500 µg/mL or from 1.0 to 20 µg/mL in mobile phase was pre-pared. Standard solutions containing TH were added with 8 µg/mL of CM. The peak area ratio (PAR) of TH to CM was measured and the calibration curve was obtained from the least-squares linear regression of the PAR versus concentra-tions.
IV. Preparation of Sample Solutions
Six samples of commercial tetrahydrozoline hydrochlo-ride ophthalmic solutions containing SM were employed for quantitation. One of the samples was diluted with mobile phase to obtain 10 µg/mL of TH. The others were directly fil-tered through a 0.45 µm membrane before HPLC analysis. V. Recovery
The three concentration of TH, 20, 40, 50 µg/mL was spiked into three individual samples. The recovery of TH was determined by assaying samples with known concentrations of TH. Three replicates of HPLC analysis were examined for each sample, and the individual and the mean value were reported.
VI. Validation of Assay Method
Several blank samples containing excipients were tested for the absence of interfering compounds. The intra- and inter-assay coefficients of variation and standard deviations of mean were used to validate the precision and accuracy of the assay by determining standard samples of TH. For inter-day validation, six sets of control samples at six different concentrations (12.5-500 µ g/mL or 1.0-20 µ g/mL) were evaluated on six different days (six standard curves were con-structed). For intraday validation, six sets of controls at six different drug concentrations were assayed with one standard curve on the same run.
VII. Quantification and Calibration Curve Preparation The calibration curve was constructed for Quantitation. TH in various matrices were prepared. Standard samples con-taining TH were added with 8 µg/mL CM and analyzed as described above. The PAR of TH to CM was measured and the calibration curve was obtained from the least-squares lin-ear regression of the PAR versus spiked concentrations. The regression line was used to calculate the concentrations of TH in the unknown samples based on the PAR.
RESULTS
Table 1 illustrates the formulation of interested oph-thalmic solution. The concentration of SM, TH, and MP are 2% (w/v), 0.0025% (w/v) and 0.1% (w/v), respectively. The ultraviolet characters of those ingredients are shown in Table 2. (10)By estimating from the characteristics of UV absorp-tion and concentraabsorp-tion in the formulaabsorp-tion, the detectivity of SM was 5,600 times higher than that of TH when using ODS-HPLC method for assaying TH. This widely difference in concentration in pharmaceutical preparations could cause more difficulty in separating TH from SM by RP-HPLC methods. In practice, analysis by the way of Inertsil 10 ODS column (GL Sciences Inc., Tokyo Japan) with mobile phase of water:methanol:acetonitrile (=1:5:5)(2), the small peak of TH was covered by an over scale peak of SM (Figure 1). Regarding ion-pairing technique by using Inertsil 5 C8 col-umn (4.6 ×150 mm), the mobile phase containing 10% of 5 mM Sodium octane sulphonate - 5 mM Na2HPO4(pH 7) in acetonitrile-methanol (1:1,v/v)(6)was desirable in the analy-sis of TH in the same sample matrix. However, the small peak corresponding to TH can be well separated from the main peak by means of the ion-pairing technique at only appropriate pH value as shown in Figure 2.
The addition of triethylamne (TEA) or equivalents in the mobile phase plays as a masking agent for free silanol
Table 1. The formula of tetrahydrozoline HCl ophthalmic solution
Ingredients Concentration (mg/mL) Sulfamethoxazole Sodium 20.000 Tetrahydrozoline HCl 0.025 Methyl Paraben 1.000 Borax 1.910 Boric Acid 1.240 Sodium Thiosulfate 2.000 Borneol 5.000 L-Menthol 0.050
Table 2. The ultraviolet characteraof interested ingredients in
tetrahy-drozoline HCl ophthalmic solution
Ingredients Ultraviolet Character
Tetrahydrozoline 265 nm (A1 1= 21, in aqueous acid) 272 nm, no alkaline shift Sulfamethoxazole 265 nm (A1 1= 175, in aqueous acid) 256 nm (A11=673, in aqueous alkali) Methylparaben 257 nm (A11=1075, in ethanol)
group on silica gel to minimize the interaction between basic drugs and silica gel, which generally causes the tailing of peak and also results in a longer retention time. In this study, it was found that the addition of TEA at a level elucidated in
the Experimental Section was suitable enough to accomplish the purpose.
A HPLC method employing a silica column eluted with an aqueous solvent mixture was then applied for assaying TH Minutes 0 1 2 3 4 5 6 7 8 9 10 Minutes 0 1 2 3 4 5 6 7 8 9 10 Minutes 0 1 2 3 4 5 6 7 8 9 10 0 100 200 300 400 500 600 700 800 900 1000 (A) 0 100 200 300 400 500 600 700 800 900 1000 0 100 200 300 400 500 600 700 800 900 1000 (B) 0 100 200 300 400 500 600 700 800 900 1000 0 100 200 300 400 500 600 700 800 900 1000 (C) 0 100 200 300 400 500 600 700 800 900 1000 TH 2.207 MP 2.972 2.075 2.338
Figure 1. Chromatogram of tetrahydrozoline HCl ophthalmic solution analzyed by traditional ODS column method. A: sample solution; B:
tetrahy-drozoline HCl (1000 µg/mL); C: methylparaben (50 µg/mL). Minutes 0 1 2 3 4 5 6 7 8 9 10 02 0 4 0 02 0 4 0 TH 4.58
Figure 2. Chromatogram of tetrahydrozoline HCl ophthalmic solution
analyzed by ion-pairing method. (TH:25 µg/mL).
Minutes 0 1 2 3 4 5 6 7 8 9 10 11 12 02 0 3 0 10 40 02 0 3 0 10 40 TH CM 6.425 5.255 9.077 1.894
Figure 3. Chromatogram of tetrahydrozoline HCl ophthalmic solution
analyzed by silica column eluted with aqueous solvent mixture (TH:10
in ophthalmic solution. The HPLC running condition was described in above. Figure 3 shows a typical sample analysis of HPLC with internal standard. No interfering peaks were observed for several samples of different matrices. The reten-tion times of TH and CM were around 6.43 and 9.08 minutes, respectively. Good separation and baselines with low back-ground were observed. The peaks of interest were well resolved and there was no interference from excipients. Also, the symmetry of both peaks (TH and CM) was clearly indi-cated.
Using the peak height of TH at the same injected amount without extraction as 100%, it was found that the recovery of TH added to various matrices was almost quanti-tative (approaching 100%, Table 3). This indicates that the method is reproducible and suitable for the analysis of phar-maceutical samples.
The interday and intraday validations for assaying TH in pharmaceutical samples in two different concentration ranges are shown in Tables 4 and 5, respectively. The coefficients of variation (CV) of interday and intraday assays for concentra-tion range from 12.5 to 500 µg/mL were 1.31% to 2.70% and 1.30% to 2.55% respectively, whereas for concentration range of 1.0 to 20 µg/mL were 0.45% to 4.30% and 1.39% to 11.58%, respectively indicating that the analysis has good
precision. The relative error of mean (REM) of interday and intraday assays for concentration range from 12.5 to 500 µg/mL was -2.63% to 6.26% and -4.05% to 1.97%, respec-tively, whereas for concentration range of 1.0 to 20 µg/mL
Table 3. Recoveries of tetrahydrozoline HCl spiked into commercial ophthalmic solution
Spiked level (µg/mL) Recovery (%) Mean (%) ±S.D. C.V. (%) 99.4 20 98.3 98.9 ±0.55 0.56 98.9 100.6 40 99.6 99.7 ±0.85 0.86 98.9 100.3 50 99.2 99.9 ±0.66 0.67 100.4
Table 4. Precision and accuracy of intraday and interday validation for concentration range from 12.5 to 500 µg/mL
Concentration (µg/mL) Intraday Interday
Mean (SD) CV (%) Rel Err (%) Mean (SD) CV (%) Rel Err (%)
12.5 12.29(0.16) 1.30 -1.68 12.37(0.19) 1.54 -1.04 25.0 24.45(0.65) 2.55 1.80 25.57(0.43) 1.68 2.28 50.0 49.97(0.92) 1.84 -0.06 51.14(1.34) 2.62 2.28 100.0 101.97(2.09) 2.05 1.97 106.26(2.87) 2.70 6.26 250.0 244.88(4.84) 1.98 -2.05 245.92(3.21) 1.31 -1.63 500.0 479.76(10.9) 2.28 -4.05 486.86(8.16) 1.68 -2.63
SD: standard deviation; CV: coefficient of variation; Rel Err: relative error of the mean; (n=3).
Table 5. Precision and accuracy of intraday and interday validation for concentration range from 1.0 to 20 µg/mL
Concentration (µg/mL) Intraday Interday
Mean (SD) CV (%) Rel Err (%) Mean (SD) CV (%) Rel Err (%)
1.0 0.95(0.11) 11.58 -5.00 0.93(0.04) 4.30 -7.00 2.0 1.91(0.08) 4.19 -4.50 1.95(0.07) 3.59 -2.50 5.0 5.05(0.14) 2.78 1.00 5.06(0.09) 1.78 1.20 10.0 9.78(0.14) 1.43 -2.20 9.86(0.41) 4.15 -1.40 15.0 14.86(0.24) 1.62 -0.93 14.92(0.21) 1.41 -0.53 20.0 20.14(0.28) 1.39 0.70 20.15(0.09) 0.45 0.75
SD: standard deviation; CV: coefficient of variation; Rel Err: relative error of the mean; (n=3).
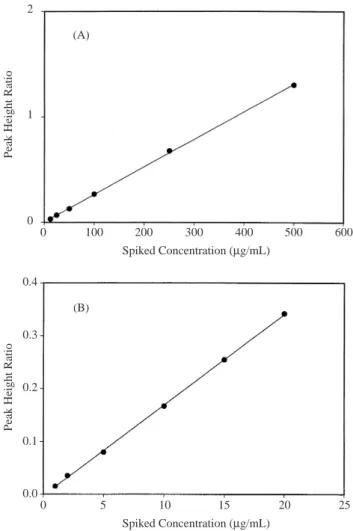
Spiked Concentration (µg/mL)
Peak Height Ratio
0 0.0 0.1 0.2 0.3 0.4 (B) 5 10 15 20 25 Spiked Concentration (µg/mL)
Peak Height Ratio
0 0 1 2 (A) 100 200 300 400 500 600
Figure 4. Calibration curve for tetrahydrozoline HCl in a concentration
correlated within a range from 12.5 to 500 µ g/mL (4A, y=0.0026*x+0.0033, r2=0.9996) and from 1.0 to 20 µg/mL (4B, y=0.0172*x-0.0026, r2=0.9997).
DISCUSSION
The retention behavior of using silica column eluted with aqueous solvent is based on the ion-exchange-like mechanism and is controlled predominantly by the pH value(11-13). The pH of mobile phase must be chosen in such a way that the solutes are protonated and the stationary phase, silica, possesses ion-exchange capacity. As a result, basic drugs, particularly quaternary amine compounds, will be retained the most in this system. SM is a sulfonamide, a weak acidic drug with a pKa value of 5.6, and will not be protonat-ed in this mobile phase. Therefore, a short retention time is expected. MP, an α-hydroxybenzoic acid derivative, will not interfere with assay because it can not be protonated either. TH, a tertiary amine of imidazoline derivative, can be proto-nated and separated from high concentrations of SM and MP due to longer retention time. Thus, the pH value is the most important parameter to control retention and separation effi-ciency. The increase of pH value in mobile phase increases the ion-exchanging capacity of the silica packing material. This results in the increase of capacity prolonging the reten-tion time of basic drugs.
A typical pH effect of sample matrix on silica-base col-umn is demonstrated on Figure 5. The pH value of an undi-luted sample solution was around 8.2, and the retention time of TH was 7.02 min (Figure 5A), about one minute longer compared to that of TH standard solution (Figure 5D) whose pH value was around 7.0. The pH difference was attributed to the mixing of mobile phase and sample solution during analysis. However, this influence was minimized with the initial dilution of sample solution with mobile phase as indi-cated by Figures 5B and 5C.
While the pH value plays an important role in both ion-exchanging-like and ion-paring mechanisms, how to main-tain an appropriate pH value to ensure higher accuracy of assay turns out to be very critical. Compared to the ion-par-ing mechanism, the ion-exchangion-par-ing-like method only needs to simply mix the right volume proportions to automatically accomplish an appropriate pH value for the mobile phase. It not only rerduces the complexity of procedures for mobile phase preparation but also the possibility of poor resolution.
Maintenance of equipment and column is another key factor to illustrate the superiority of the ion-exchanging-like method. Following the end of assay, the way of column cleansing impacts the maintenance of equipment. The more salts that remain in the column or tubing, the more likely damage to the instrument resulting from crystallization will occur. Mobile phase used in this HPLC method was not pre-pared with any salt-containing reagents, so it significantly reduces the phenomenon and possibility of crystallization. In addition, a longer life of the column and instrument is less costly, and fewer step in the procedure required for column cleansing can save time.
were -7.00% to 1.20% and -5.00% to 1.00%, respectively depicting the high accuracy of the analysis. The linearity of the calibration curve of TH as shown in Figure 4 was well
Minutes 0 1 2 3 4 5 6 7 8 9 10 11 12 02 0 3 0 10 02 0 3 0 10 TH CM (D) (C) 6.021 2.125 1.902 8.797 0 1 2 3 4 5 6 7 8 9 10 11 12 02 0 3 0 10 02 0 3 0 10 TH CM 6.087 8.731 (B) 0 1 2 3 4 5 6 7 8 9 10 11 12 02 0 3 0 10 02 0 3 0 10 TH CM 6.425 5.255 1.894 9.077 (A) 0 1 2 3 4 5 6 7 8 9 10 11 12 02 0 3 0 10 02 0 3 0 10 CM 1.845 7.018
Figure 5. The effect of matrix pH change on retention time: (A) sample
solution; (TH:25 µg/mL); (B) diluted sample solution (10 mL to 25 mL with mobile phase, TH:10 µ g/mL) with internal standard (CM:8
µ g/mL); (C) diluted sample solution (5 mL to 25 mL with mobile
phase, TH:5 µg/mL) with internal standard (CM:8 µg/mL; (D) standard solution (TH:50 µg/mL) with internal standard (CM:8 µg/mL).
1370.
5. Schutter, J. A., Van-den-Bossche, W. and De-Moerloose, P. 1987. Stability-indicating analysis of tetry-zoline [tetrahydrotetry-zoline] hydrochloride in pharmaceuti-cal formulations by reverse-phase ion-pair liquid chro-matography. J. Chromatogr. 391: 303-308.
6. Puglisi, G., Sciuto, S., Chillemi, R. and Mangiafico, S. 1986. Simultaneous high-performance liquid chromato-graphic determination of antazoline phosphate and tetrahydrozoline hydrochloride in ophthalmic solution. J. Chromatogr. 369: 165-170.
7. Andermann, G. and Richard, A. 1984. Stability-indicat-ing determination of tetrahydrozoline hydrochloride in ophthalmic solutions by high-performance liquid chro-matography. J. Chromatogr. 298: 189-192.
8. Bauer, J. and Krogh, S. 1983. High-performance liquid chromatographic stability-indicating assay for naphazo-line and tetrahydrozonaphazo-line in ophthalmic preparations. j. Pharm. Sci. 72: 1347-1349.
9. Massaccesi, M. 1987. Gas-chromatographic determina-tion of some imidazoline in pharmaceutical preparadetermina-tions by using FFAP as stationary phase. Pharm. Acta. Helv. 62: 302-305.
10. Clarke, E. G. C. 1986. Isolation and Identification of Drugs. 2nd ed. pp. 1006. The Pharmaceutical Society of Great Britain. London, UK.
11. Lingeman, H. and Underberg, W. J. M. 1988. Non-modi-fied stationary phase for the analysis of basic compounds. Trends anal. Chem. 7: 346-351.
12. Cox, G. B. and Stout, R. W. 1987. Study of the retention mechanisms for basic compounds on silica under “pseudo-reversed-phase conditions”. J. Chromatogr. 384: 315-336.
13. Lingeman, H., Van Munster, H. A., Beynen, J. H., Underberg, W. J. M. and Hulshoff, A. 1986. High-perfor-mance liquid chromatographic analysis of basic com-pounds on non-modified silica gel and aluminum oxide with aqueous solvent mixtures. J. Chromatogr. 352: 261-274.
CONCLUSION
Compared to other traditional methods, the HPLC method utilizing silica column eluted with aqueous mixture containing trace amount of triethylamine and acetic acid pro-vides a better alternative for the assay of Tetrahydrozoline HCl in ophthalmic solution that contains a comparatively high concentration of sulfamethoxazole sodium. Greater pre-cision, accuracy, and peak-symmetry can be achieved. The impact of pH variation on retention time can be minimized by initially diluting the sample solution with the mobile phase. Additionally, this improved method demonstrated the poten-tial to overcome the wide range of differences in the quantity of ingredients contained in pharmaceutical preparations by RP-HPLC assaying for TH. The key advantages of this method are reducing the for mobile phase preparation and cleaning column and instrument tubing, as well as improving of the ease of instrument maintenance. Normally, preparing the mobile phase, conducting the assay, and finishing the rinse of the column and instrument tubing are accomplished within 10 minutes.
REFERENCES
1. The United States Pharmacopeia XXIV. Untited States Pharmacopeial Convention, Inc. Rockville, Md. USA. 2. Altuntas, T. G., Korkamaz, F. and Nebioglu, D. 2000.
Determination of tetrahydrozoline hydrochloride and flu-orometholone in pharmaceutical formulations by high-performance liquid chromatography and derivative UV spectrophotometry. Pharmazie. 55: 49-52.
3. Bocie, R., Vallejos, C., Alvarez-Lueje, A. and Lopez, F. 1992. Liquid-chromatographic assay naphazoline and antazoline in ophthalmic preparation. J. AOAC. Int. 75: 902-904.
4. Kountourellis, J. E. and Raptouli, A. 1988. Simultaneous determination of 2-imidazoline and other pharmaceutical substances in commercial preparations by high-perfor-mance liquid chromatography. Anal. Lett. 21:
1361-1,2 2 1 2
*
July 5, 2001 February 5, 2002
Tetrahydrozoline Hydrochloride 7:3, v/v Triethylamine 0.03% (v/v) Acetic acid 0.02% (v/v) 254 nm 1 mL/min 98.9 to 99.9% 12.5 500 µg/mL r2= 0.9996
1.0 20 µg/mL r2= 0.9997 HPLC
Tailing