行政院國家科學委員會專題研究計畫 成果報告
銅-(錳、鎳)-鋁合金相變化(2/2)
計畫類別: 個別型計畫
計畫編號: NSC93-2216-E-009-016-
執行期間: 93 年 08 月 01 日至 94 年 07 月 31 日
執行單位: 國立交通大學材料科學與工程學系(所)
計畫主持人: 劉增豐
計畫參與人員: S. Y. Yang(楊勝裕)、J. S. Weng(翁瑞陞)、S. C. Jeng(鄭
祥誠)、P. T. Kuo(郭柏村)、T. F. Liu(劉增豐)
報告類型: 完整報告
處理方式: 本計畫可公開查詢
As-quenched Microstructures of Cu
3-xMn
xAl (x=0.1, 0.2, 0.3, 0.4) Alloys.
* S. Y. Yang(楊勝裕)、J. S. Weng(翁瑞陞)、S. C. Jeng(鄭祥誠)、P. T. Kuo(郭柏村)、
T. F. Liu(劉增豐)
Materials Science and Engineering Department National Chiao-Tung University
(交通大學材料科學與工程學系) (NSC93-2216-E-009-016)
The as-quenched microstructure of the alloy A (Cu2.9Mn0.1Al) was D03 phase containing plate-like γ1΄ martensite;
whereas the as-quenched microstructures of both the B (Cu2.8Mn0.2Al) and C (Cu2.7Mn0.3Al) alloys were a mixture of
(D03+L-J) phases. However, when the manganese content was added up to 9.73 at%, the as-quenched microstructure
of the alloy D (Cu2.6Mn0.4Al) was a mixture of (D03+L21+L-J) phases. The fine D03 phase existing in the as-quenched
alloy A, B and C were formed through the A2→B2→D03 continuous ordering transition during quenching. The A2→
B2 and B2→D03 transitions produced a/4<111> and a/2<100> APBs, respectively. It is noted that a/4<111> APBs have
never been found by other workers in the Cu-Mn-Al alloy system before. Similarly, no evidence of the a/4<111> APBs could be observed in the as-quenched alloy D. This shows that the energy of the a/4<111> APBs was increased with increasing the manganese content.
Key words: Cu-Mn-Al alloy、Anti-phase boundary、Phase transformation, Continuous ordering transition
Introduction
By using thermal analysis method, M. Bouchard and G. Thomas had established the Cu3-xMnxAl (0 ≦ X ≦ 1)
metastable phase diagram [1]. In this phase diagram, it is seen that when the Cu3-xMnxAl alloys with 0.2≦X≦0.8
were solution heat-treated in the single β phase (disordered body-centered cubic(bcc)) region and then quenched into iced brine rapidly, a β (A2) → B2 → D03+L21 phase transition would occur during quenching.
The crystal structure of the L21 (Cu2MnAl) phase is
similar to the D03 (Cu3Al) phase, and the only difference
between them is that manganese atom replaces the copper atom at a specific lattice sites with eight nearest copper atoms in the D03 structure [1]. When the
manganese content in the Cu3-xMnxAl alloy was
increased to 25 at. % (X=1), the as-quenched microstructure became a single L21 phase. In addition,
the as-quenched microstructures of the Cu3-xMnxAl (0.5
≦X ≦ 1.0) alloys were also examined by using transmission electron microscopy [2-5]. These investigations have confirmed the results proposed by M. Bouchard and G. Thomas.
Recently, we made transmission electron microscopy observations on the phase transformation of a Cu2.2Mn0.8Al alloy. [6] Consequently, our experimental
result indicated that the as-quenched microstructure of the Cu2.2Mn0.8Al alloy was a mixture of (D03+L21+L-J)
phases. It is worthwhile to note here that the L-J phase had never been found previously by other workers in the Cu-Al, Cu-Mn and Cu-Mn-Al alloy systems. However, to date, all of the transmission electron microscopy examinations were focused on the Cu3-xMnxAl alloys
with 0.5 ≦ X ≦ 1. Little information concerning the Cu3-xMnxAl alloys with lower manganese content has
been provided. Therefore, the purpose of the present study is to investigate the as-quenched microstructure of the Cu3-xMnxAl alloys with X<0.5.
Experimental Procedure
Four alloys, Cu2.9Mn0.1Al (alloy A), Cu2.8Mn0.2Al
(alloy B), Cu2.7Mn0.3Al (alloy C) and Cu2.6Mn0.4Al (alloy
D), were prepared in a vacuum induction furnace under a controlled protective argon atmosphere by using 99.99% copper, 99.9% manganese and 99.99% aluminum. The melts were chill cast into a 30x50x200-㎜-copper molds. After being homogenized at 900℃ for 72 hours, the ingots were sectioned into 2-㎜-thick slices. These slices were subsequently solution heat-treated at 900℃ for 1 hour (in the single β-phase state) and then quenched into iced brine rapidly.
Electron microscopy specimens were prepared by means of a double-jet electropolisher with an electrolyte of 70 % methanol and 30 % nitric acid. The polishing temperature was kept in the range from -30℃ to -15℃, and the current density was kept in the range from 3.0x10⁴ to 4.0x10⁴ A/m2. Electron microscopy was
performed on a JEOL JEM-2000FX scanning transmission electron microscope operating at 200 KV.
Results and Discussion
Figure 1(a) is a bright-field (BF) electron micrograph of the as-quenched alloy A, clearly exhibiting that a second phase with a plate-like morphology was formed within the matrix. Figures 1(b) and (c) show two selected-area diffraction patterns (SADPs) taken from a plate-like phase and its surrounding matrix. In these SADPs, it is seen that in addition to the reflection spots corresponding to the D03
phase [1,7], the diffraction patterns also consist of extra spots caused by the presence of the second phase. Compared with the previous studies in Cu-Al and Cu-Al-Ni alloys [7-10], it is clear that the positions and streak behaviors of the extra spots are the same as those of the γ1΄ (2H) martensite with internal twins [7, 9-10].
The γ1΄ martensite has an orthorhombic structure with
lattice parameters a=0.440 nm, b=0.534 nm and c=0.422 nm [9, 11]. Figure 1(c) is a (121 ) γ1΄ dark-field (DF)
electron micrograph, clearly revealing the presence of the plate-like γ1΄ martensite. Accordingly, it is concluded
that the as-quenched microstructure of the alloy A was D03 phase containing plate-like γ1΄ martensite.
Fig. 1 Electron micrographs of the as-quenched alloy A. (a) BF, (b) and (c) two SADPs. The zone axes of the D03 phase , γ1΄ martensite and internal twin are
(b) [001] [10 ] and [1 101] (c) [111], [210] and [210 ], respectively (hkl= D03 phase, hkl= γ1΄
martensite, hklT=internal twin), (d) (121 ) γ1΄
martensite DF.
When the manganese content was increased to X=0.2, no evidence of the γ1΄ martensite could be
detected and a high density of extremely fine precipitates with a mottled structure could be observed within the D03 matrix. A typical example is shown in Figure 2.
Figure 2(a) is a BF electron micrograph of the alloy B in the as-quenched condition. Figures 2(b) and (c) show SADPs of the as-quenched alloy B. When compared with our previous studies in the Cu2.2Mn0.8Al and Cu-14.6Al
-4.3Ni alloys [6,12], it is found in the SADPs that the extra spots with streaks showed derive from the L-J phase with two variants. Figure 2(d) is a (002) D03 DF
electron micrograph of the same area as Figure 2(a), revealing the presence of the small B2 domains with a/4<111> anti-phase boundaries (APBs). Figure 2(e), a (111) D03 DF electron micrograph, shows the presence
of the fine D03 domains with a/2<100> APBs. In Figures
2(d) and (e), it is seen that the sizes of both B2 and D03
domains are very small. Therefore, it is deduced that the D03 phase existing in the as-quenched alloy was formed
by an A2 → B2 → D03 continuous ordering transition
during quenching [13-16]. Figure 2(f) is a (020) L-J DF electron micrograph, exhibiting the presence of the extremely fine L-J precipitates. Based on the above observations, it is concluded that the as-quenched microstructure of the present alloy B was D03 phase
containing extremely fine L-J precipitates, where the D03
phase was formed by the A2→B2→D03 continuous
ordering transition during quenching.
Fig.2 Electron micrographs of the as-quenched alloy B. (a) BF, (b) and (c) two SADPs. The zone axes of the D03 phase are (b) [001] and (c) [110],
respectively (hkl= D03 phase, hkl= L-J phase,) (d)
and (e) (002) and (111) D03 DF, respectively, (f)
(020) L-J DF.
Transmission electron microscopy examinations of thin foils indicated that the as-quenched microstructure of the alloy C was also D03 phase containing extremely
fine L-J precipitates, which is similar to that observed in the alloy B. An example is shown in Figure 3. Figure 3(a) through (f) are BF, [001] as well as [110] DP, (002) as well as ( 111 ) D03 DF and (020 ) L-J DF electron
micrographs of the alloy C in the as-quenched condition, respectively. 200 nm 200 nm 200 nm 200 nm 200 nm 200 nm 200 nm 200 nm (a) (b) (c) (a) (b) (c) (d) (e) (a) (b) (d) (f) (c) (d)
Fig. 3 Electron micrographs of the as-quenched alloy C. (a) BF, (b) and (c) two SADPs. The zone axes of the D03 phase are (b) [001] and (c) [110],
respectively, (d) and (e) (002) and (111 ) D03 DF,
respectively, (f) (020) L-J DF.
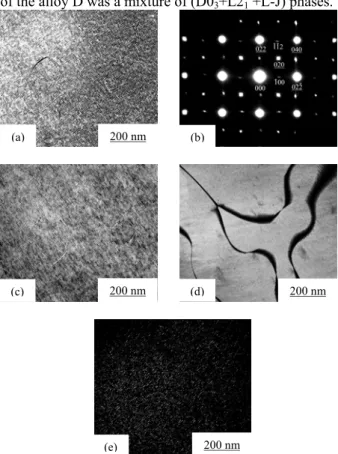
Figure 4(a) is a BF electron micrograph of the as-quenched alloy D, exhibiting a modulated structure. Shown in Figure 4(b) is an SADP of the as-quenched alloy. In this Figure, it is seen that in addition to the reflection spots with streaks of the L-J phase, the superlattice reflection spots with satellites lying along <001> reciprocal lattice directions could be clearly observed. In the previous studies [1,6], it is confirmed that these supperlattice reflection spots with satellites were attributed to the coexistence of the (D03+L21)
phases. Figure 4(c), a (002) D03 DF electron micrograph,
indicates that no evidence of the a/4 <111> APBs could be examined. Figures 4(d) and (e) are ( 111 ) D03 and
(020) L-J DF electron micrographs of the alloy D in the as-quenched condition, revealing the presence of the D03
domains with a/2 <100> APBs and L-J precipitates, respectively. As a result, the as-quenched microstructure of the alloy D was a mixture of (D03+L21 +L-J) phases.
Fig. 4 Electron micrographs of the as-quenched alloy D. (a) BF, (b) an SADP. The zone axis of the D03
phase is [001]. (hkl= D03 + L21phase, hkl= L-J
phase,). (c) and (d) (002) and ( 111 ) D03 DF,
respectively, (e) (020) L-J DF.
On the basis of the preceding results, some discussion is appropriate. In the Cu-Al, Cu-Al-Mn, Fe-Al and Fe-Al -Mn alloys[13-18], it is well-known that if the D03 phase
was formed by continuous ordering transition during quenching, it was always occurred through an A2 (disordered body-centered cubic)→B2→D03 transition.
The A2→B2 transition produced the a/4<111> APBs and the B2→D03 transition produced the a/2<100> APBs
[13-16]. However, to date, no a/4<111> APBs could be investigated by other workers in the Cu-Al-Mn alloys [1-7,17-18]. In the present study, it is indeed found that no evidence of the a/4<111> APBs could be observed in the alloy D, which the manganese content is X=0.4. However, when the manganese content was decreased to X=0.3 or below, the a/4<111> APBs could clearly be observed. This result seems to imply that in the Cu-Al-Mn alloys with higher manganese (e.g. X=0.4), the size of the B2 domains could be equivalent to whole grain size. However, the decrease of the manganese content could decrease the B2 domain size significantly. Therefore, the a/4<111> APBs became visible, as shown in Figures 2(d) and 3(d).
In the Cu3-xMnxAl metastable phase diagram
established by M. Bouchard and G. Thomas, it is seen that when the Cu3-xMnxAl alloys with 0.5≦X≦1 were
solution heat-treated in the β phase region and then quenched into iced-brine rapidly, a β→B2→D03+L21
phase transition would occur during quenching. By comparing Figures 2 and 3, two important experimental results are given below. ( Ⅰ ) The amount of the extremely fine L-J precipitates was increased with increasing the manganese content. Correspondingly, the intensity of the reflection spots and streaks of the L-J precipitates was also increased with increasing the manganese content. (Ⅱ) The sizes of both the B2 and D03 domains were increased with increasing the
manganese content
Conclusions
(1) In as-quenched condition, the microstructure of the alloy A was D03 phase containing plate-like γ1΄
martensite with internal twin.
(2) With increasing manganese content, the D03 matrix
would be changed to (D03+ L21 ) with a
modulation structure.
(3) The Ms temperature was decreased with increasing the manganese content. On the contrary, the amount of the L-J particles was increased with increasing the manganese content.
(4) No evidence of the a/4<111> APBs could be determined in the alloy D. However, the a/4<111> APBs were clearly observed in the both alloy B and alloy C. This result seems to suggest that the increase of the manganese content in the Cu-Mn-Al alloys could increase the B2 domain size.
200 nm 200 nm 200 nm 200 nm 200 nm 200 nm (e) (f) (a) (b) (c) (d) (e)
Acknowledgement
The authors are pleased to acknowledge the financial support of this research by the National Science Council, Republic of China under Grout NSC93-2216-E-009-016.
References
1. Bouchard M, Thomas G. Acta Mater 1975;23:1485. 2. Zalutskiy VP, Nesterenko YeG, Osipenko IA. Fiz
Metal Metalloved 1970;28:627-33.
3. Nesterenko YeG, Osipenko IA, Firstov S.A. Fiz Metal Metalloved 1973;36:702-10.
4. Kozubski R, Soltys J, Dutkiewicz J, Morgiel J. J Mater Sci 1987;22:3843.
5. Jeng SC, Liu T F. Metall Mater Trans A 1995 ;26A : 1353.
6. Kuwano N, Wayman CM. Metall Trans A 1984;15A:621.
7. Lovey FC, Tendeloo VG, Landuyt VJ, Amelinckx S. Scripta Metall. 1985;19:1223.
8. Hara T, Ohba T, Miyazaki S, Otsuka K. Mater Trans JIM 1992;33:1105.
9. Chen CH, Liu TF. Mater Chem Phys 2002;78:464. 10. Dvorack MA, Kuwano N, Polat S, Chen Haydn,
Wayman CM. Scripta Metall 1983;17:1333. 11. Tan J, Liu TF. Mater Chem Phys 2000;70:49. 12. Allen SM, Chan JW. Acta. Mater 1976;24:425. 13. Lee JW, Liu T F. Mater Chem Phy 2001;69:192. 14. Swann PR, Duff WR, Fisher RM. Metall Trans
1972;3:409.
15. Nesterenko YeG, Osipenko IA, Firstov SA. Fiz Metal Metalloved 1969;27:135.
16. Wu CC, Chou JS, Liu TF. Metall Trans A 1991;22A:2265.
17. Kainuma R, Satoh N, Liu XJ, Ohunuma I, Ishida K. J Alloys Comp 1998;266:191.
18. Liu XJ, Ohunuma I, Kainuma R, Ishida K. J Alloys Comp 1998;264:201.