Nordic Hydrology, 33 (4), 2002,275-290 No part may be reproduced by any process without complete reference
Fuzzy Clustering Neural Network as
Flood Forecasting Model
Fi-John Chang, Yen-Chang Chen and Jin-Ming Liang
National Taiwan University, Taipei, Taiwan, R.O.C.
Flood forecasting is always a challenge in Taiwan, which has a subtropical cli- mate and high mountains. This paper develops a fuzzy clustering neural network (FCNN), and implements this novel structure and reasoning process for flood forecasting. The FCNN has a hybrid learning scheme; the unsupervised learning scheme employs fuzzy min-max clustering to extract information from the input data. The supervised learning scheme uses linear regression to determine the weights of FCNN. The network, which learns from examples, is a hydrological processes theory-free estimator. Most of the parameters, weights of the network, are adjusted automatically during the network training. Only one parameter needs to be justified during constructing the flood forecasting models. The one- hour-ahead floods of the Lanyoung River during tropical storms are forecasted by the constructed models. Our results show that the simple but reliable model is capable of real time flood forecasting.
Introduction
Flash floods are among the most deadly and damaging of natural disasters. Reliable flood forecasting is one of the critical components for reducing risks for life and property. Thus, flood forecasting, which is always a benchmark problem for hydrol- ogists and water resources engineers, has received a prominent focus for many decades. To develop flood forecasting models associated with rainfall and runoff, one must know the behavior of hydrological systems. Many hydrological and phys-
iographic factors will affect hydrological processes; however, the characteristics of a hydrological system can be explored by building hydrological models. Two different approaches for the development of flood forecasting models are employed: one is based on hydrological theory, which is based on hydrological and geographical char- acteristics of hydrological system, and the other on statistical theory, which is based on randomness of natural processes. The dynamic wave models (Fread 1978; Mous- sa and Bocquillon 1988) based upon the Saint-Venant equations and instantaneous unit hydrograph (Gyasi-Agyei et al. 1996) are some of the most popular hydrologi- cal models. Unfortunately, many hydrological models in practice are still generally based on simplified methods and only accept by a tolerance for imprecision. Devel- opment of stochastic models, such as hydrological time series (Montanari et al. 2000) and linear systems theory (Wang and Chen 1996) has been rapid, particularly in the last few decades. However, hydrological systems are notoriously nonlinear. Many stochastic models have difficulties in treating the nonlinearity of rainfall- runoff mechanisms. Owing to the lack of practicality and difficulty in use, the mod- els such as conceptual instantaneous unit hydrographs (IUH) (Chang and Hwang 1999), autoregressive moving average with exogenous variable (ARMAX) model (Chang and Chen 2001) and deterministic catchment model (Kraijenhoff and Moll 1986) cannot well represent the complicated hydrological systems in Taiwan whose watershed characteristics include heavy rainfall, erodible soils, steep slopes, and high mountains and do not produce satisfactory results.
This paper is concerned with the application of artificial neural networks (ANNs) and fuzzy arithmetic to flood forecasting. The notion of fuzzy sets was first intro- duced by Zadeh (1965). Recently, fuzzy arithmetic has become an important tool for dealing with uncertainty and is widely used in many scientific applications and en- gineering systems. After the first ANN was proposed by McCulloch and Pitts (1943), the development of ANN was fast, particularly in the last decade. An ANN is a massively parallel distributed processor inspired by modeling of mind and brain activity. The benefit of ANNs is their computing power that can offer the properties and capabilities of nonlinearity, input-output mapping, and adaptivity to solve com- plex problems. Thus, ANNs can be viewed as nonlinear self-organizing models that learn from historical data. Many ANNs (Rumelhart et al. 1986; Hecht-Nielsen 1987; Moody and Darken 1989; Jang 1992) have been developed for dealing with different problems such as pattern recognition, control, speech recognition, and business. ANNs have also been applied in hydrology, including rainfall-runoff modeling (Hsu
et al. 1995; Minns and Hall 1996; Chang et al. 2001), drainage and irrigation mod- eling (Yang et al. 2000), rainfall forecasting (Kuligowski and Barros 1998), and groundwater modeling (Yang et al. 1997). In this study an FCNN, which is com- posed of ANN and a fuzzy system, is developed to build a rainfall-runoff model for flood forecasting. Furthermore, the proposed FCNN is compared with the conceptu- al IUH by using the tropical storm rainfall and runoff data of the Lanyoung River for evaluating its performance and showing the advantage of FCNN.
Fuuy Clustering Neural Network as Flood Forecasting Model
Layer l Layer 2 Layer 3 Layer 4
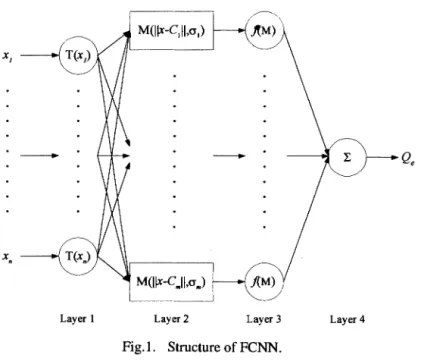
Fig. 1. Structure of FCNN. Network Structure
Neural network (NN) has at least two layers, the input and output layers. In order to deal with different complex nonlinear problems, different kind of neural networks have different layers. Thus each of these approaches has its own advantages. For ex- ample, the backpropagation NN has multiple (three or more) layers and the radial basis function NN has only three layers. In this study, a four-layer neural network is developed to represent the complex rainfall-runoff relationships. An FCNN is a mul- tilayer feedforward neural network and each layer has it activation functions, as shown in Fig. 1. The first layer, input layer, which is the layer contacting the outside environment, is composed of n input nodes. The input data will be transformed or normalized, if necessary, at layer one. The second layer is composed of m nonlinear nodes that are fully connected to the first layer. The characteristics of the nonlinear nodes are determined through the training data. Fuzzy min-max clustering (Simpson 1993) is employed herein for determining the center (or mean), the width (or vari- ance), and the number of the nonlinear units. The output of each nonlinear unit of layer two is determined by a Gaussian function, as shown by
where Mi is the degree of membership; Xis the input data with n dimensions; Cj and crj are the center and width of the jth nonlinear unit;
11
X-
C,11
measures the distance between input data and the nonlinear unit j. The action of each node of layer three,which is composed of m nodes, is to give an output value as a function of the output of layer two. The function used in this study is defined as follows
where
9
is the weight to be determined. The fourth layer, output of network, being fully connected to layer 3 only consists of a single linear unit. The output of the net- work that responds to a given input is the sum of the outputs of layer 3.Learning in FCNN
The learning scheme of the FCNN consists of a two-phase hybrid learning algo- rithm, unsupervised learning and supervised learning. In the supervised learning scheme, learning is accomplished by presenting a sequence of input data associated with the specific desired target data to adjust the weights or parameters of a network. On the other hand, the unsupervised learning scheme, which involves no critic to oversee the learning process, optimizes some performance functions to cluster simi- lar input data together without any feedback information. Fig. 2 illustrates the learn- ing scheme of FCNN. Fuzzy min-max clustering is employed in the unsupervised learning scheme for determining the characteristics of nonlinear units in layer two. The method of least squares is used to determine the weights of layer three. An ex- planation of both learning phases follows below.
Unsupervised Learning Phase
-
Fuzzy Min-Max ClusteringFuzzy min-max clustering adopting a simple fuzzy membership function was pro- posed by Simpson (1992). By using fuzzy min-max clustering, many hyperboxes (or nonlinear units) defined by two extreme points (max and min points), will be creat- ed automatically by learning through the training data. The advantages of applying a fuzzy min-max cluster are low computational cost, and the possibility to dynamical- ly determine the number, center, and width of nonlinear units. During network train- ing, the hyperboxes with n dimension, which can be viewed as hidden nodes of lay- er two, will be generated automatically. The degree of membership, which measures the degree of the input falling within the hyperbox, will be calculated when an input is present. The membership function is defined by
Fuzzy Clustering Neural Network as Flood Forecasting Model
1
Parameter inputted1
Data iriputted1
.L Data transformed Determination of the charaoteristics of hyperboxes(Fuzzy min-max clustering)
Overlap test of hyperbox
G
ll
Unsupervised training
Fig.2. Learning scheme of FCNN.
---" ----.--- -,", Output of layer 2
M!x)
4
Determination of weightsMethod of least squares Supervised training 1 Output of layer 3 t !
AM)
IOutput of the network
C
where Hj is the degree of membership setting to (0,l); xi is the ith dimension of in- put x with n dimension; uji and vji are the ith dimension of maximum and minimum points of the jth hyperbox, respectively;
5
is either xi-uji or vji-xi. The fuzzy min-max clustering learning algorithm is characterized by the following three-step process. 1. Expansion: During expansion of the hyperbox, the constructed hyperbox with thehighest degree of membership will be tested for hyperbox expansion. The user- defined value 8 set to 0 I 8 I 1 decides the expansion of hyperboxes. During ex- pansion of the hyperbox, the hyperbox with the highest degree of membership will be tested for hyperbox expansion according to
A small 8 means more hyperboxes will be created. If the hyperbox can be ex- panded, the old minimum and maximum points of the hyperbox will be replaced with the new minimum and maximum values. If no hyperbox can be expanded, a new hyperbox will be generated.
2. Overlap test: After the hyperbox is expanded, overlap between hyperboxes has to be determined. If overlapping is found, the maximum and/or minimum points of each dimension of the hyperbox could be contained within another hyperbox. 3. Contraction: If overlapping between hyperboxes is identified, the hyperboxes
will be contracted with the minimal disturbance principle. Only one dimension that has the minimum overlap is adjusted.
The entire training data will be presented for clustering iteratively until no hyperbox needs to be adjusted. Then the width of a nonlinear unit is set to be half the distance between the maximum and minimum points of a hyperbox.
Supervised Learning Phase
-
Method of Least SquaresAfter the number, centers, and widths of nonlinear units have been determined, the weights of layer three are adjusted by supervised learning. The weights are deter- mined to let the output of network Q, approximate the target Q,. The supervised learning algorithm aims to minimize the following sum of squares error,
Fuzzy Clustering Neural Network a s Flood Forecasting Model
Since the outputs of the network are linear combinations of the outputs of the hidden layer, the linear regression model, given as
can be used to determine the weights. The Q, is an N x l matrix; z is the output of hidden layer that is an Nx(m+l) matrix; w is the weight layer three that is a (m+l)x 1 matrix; and E is independent noise with zero mean. The method of least squares se- lecting weight matrix w* to minimize SSE is given by
*
T - 1 Tw
=
( Z Z ) z Qo (9)By using the linear regression method to minimize SSE, FCNN will have the best approximation property. In addition, the linear regression method consumes less time for model training when compared with those of other three-layer neural net- works.
In this model, there is only one parameter (8 ) that has to be determined. The se- lection of 8 will be executed after the training of network, which includes both un- supervised and supervised trainings, is done. The criterion used herein to determine 8 is the minimum root-mean-square-error (RMSE), given by
RMSE =
/-
N
where N is the number of data points, and Q, and Q, are observed and estimated streamflows, respectively.
Network Modeling
Study Watershed and Data
To illustrate the application of FCNN, rainfall-runoff data of the Lanyoung River during tropical storms are used to evaluate the performance of FCNN. Fig. 3 shows the location of study watershed its river system. In Taiwan, tropical storms accom- panied by torrential rainfall that usually occur in the summer are principally respon- sible for floods. The Lanyoung River, the most important river in northeastern Tai- wan, is a mountainous river with a steep slope. Most of the catchment is covered by mature forests and the average temperature is 22 Celsius. The geological condition of the downstream area is alluvium. In contrast, the upstream region contains a com- plex suite of rocks that includes granite, gneiss, schist, sandstone, conglomerate, and marl. The catchment area, which extends from mountains (elevation 3536 m) to sea level, drains an area of 978 km2 to the Pacific Ocean. Within the catchment area the river is 73 km long, and the average slope is 1121. The slope of the upstream is be- tween 1110 and 11100, and downstream between 11100 and 11300. Due to its sub-
0 20 KMS
Chingshui River
Streantlow gaging station
Rain gage station
Fig.3. Location of study area.
Table 1
-
Summary description of rain gage stations in case study.Nanshan Liumaoan Tuchang Fanfan Latitude 24'26' 19" 24O32.02" 24'34'27" 24'36'54"
Longitude 121022'17'' 121026'36'' 121029'20" 121031'04''
Elevation (m) 1050 585 400 300
Mean annual rainfall (mm) 2221 2550 2680 3103
Maximum annual rainfall (mm) 3313 3797 4395 4740
Minimum annual rainfall (mm) 1378 1501 773 1478
Fuuy Clustering Neural Network as Flood Forecasting Model
Table 2
-
Summary description of hydro system data.-- --
Number of Number of Mean Std. dev. Skewness Maximum event data set
Rainfall (mm) 11 378 10.1 10.4 1.96 80 Training Runoff (m3ls) 11 378 727 821 1.39 3640 Rainfall (mm) 3 101 10.9 10.9 1.91 68 Validation Runoff (m31s) 3 101 822 729 1.48 3350 Rainfall (mm) 3 103 9.8 8.5 1.38 50 Testing Runoff (m3ls) 3 103 793 659 1.43 3020
tropical location, the catchment receives an average of 3,173 mm of rainfall each year; however, the rainfall is unevenly distributed in time and space. The historical maximum and mean annual discharges are 4,580 and 65.8 m3/s, respectively. Four rain gage stations are located in the study watershed, which is equipped with one streamflow recorder. Table 1 shows the general information of rain gage stations. Seventeen sets of rainfall and runoff data of the Lanyoung River during tropical storms were measured from 1980 to 1997. The available data collected by Taiwan Water Conservancy Agency for the study watershed are hourly data measured at the rain and streamflow gauging stations. Thus the hourly time step data is used to pro- vide information for the flood forecasting model.
The available data is split into a training subset, a validation subset, and a testing subset (Stone 1974). The training subset, the first eleven tropical storm events with 378 set data (1980-1990), is devoted to adjusting the parameters and weights of the network. The validation set, the data of Typhoons Tim, Doug, and Yanni with 101 set data (1990-1994), is used to choose the best model for the various candidate ones. The testing subset (1994-1996), the latest three typhoon events with 103 set data, is applied to show the performance of the selected model. Thus the testing sub- set data is not used to derive and determine the parameters of the model. Each data set for training consists of 16 data. The descriptive statistics of chosen events are briefly provided in Table 2.
Performance Evaluation
For the purpose of comparison, the conceptual IUH is used to simulate the runoff during tropical storms. IUH, which is an impulse response function, is a hydrograph with unit amount of excess rainfall and infinitesimally small duration. The IUH can be determined by mathematical methods, for example, Fourier Series (O'Donnell 1960) and conceptual methods such as linear reservoirs in series. The simplest con- ceptual IUH is the linear reservoir model. The assumption of the conceptual model
is that a watershed may behave like a series of linear reservoirs. In general, for the conceptual IUH (Chow et al. 1988)
where k is time constant of the added linear reservoirs;
r(o)
is the gamma function; n is number of linear reservoirs. Therefore, the direct runoff at time t becomesin which I(z) is the excess rainfall at time
z.
Let Q, and Q, denote the observed and forecasted streamflows and
Po,
iZ,,
denote the mean of observed and forecasted streamflows, respectively. Also let Qp, denote the peak of observed strearnflow and Qpe the predicted streamflow when Qp, oc- curs. The performance of FCNN and IUH is evaluated on RMSE (Eq. (lo)), which measures the closeness of the forecasted and observed floods, and the following in- dices.The correlation coefficient, given by
indicates the strength of association of forecasted and observed floods. It implies perfect matching when CC is unity.
The coefficient of efficiency, given by
measures how good the performance of the model is. A CE of 1 means that the per- formance of the model is perfect.
Error rate of peak flow, given by
measures the accuracy of predicated peak flow. The smaller EQp is, the better per- formance of the model is.
Estimation of the Parameters and Weights of FCNN
For forecasting flood lead times of up to one hour, the rainfall and discharge within three hours are used as input to the models, and the output of the models is the next
Fuuy Clustering Neural Network as Flood Forecasting Model
Fig.4. Effect of 8 on RMSE.
240
one hour's forecasted flood. Thus the input data to the FCNN consist of the 15 de- pendent variables and the network output is represented by a single variable. The training of an FCNN by using training subset data is initialized by 8 = 0.05. Addi- tional candidate models will be created with adding 0.025 to 8 until 8
=
1 .O. Thus it will be 39 candidate rainfall-runoff built. When training is complete, the parameters and weights of every constructed model will be fixed for the specific FCNN. The model is selected with the minimum RMSE by using the validation subset data. Fig. 4 shows the relation of 8 and RMSE. The RMSE does not change when 8>0.55, be- cause there is only one hyperbox created for this model. It appears when 8=
0.2 the model has minimum RMSE. Therefore the FCNN with 8=
0.2 will be used to fore- cast the one-hour ahead flood of the Lanyoung River at the Lanyoung Bridge by us- ing testing subset data.220 -
Simulation Results
For the built FCNN with 8=0.2, the number of nodes of hidden nodes in layers 2 and
3 are both 145. It means that the rainfall-runoff data of the Lanyoung River can be clustered into 145 patterns. Thus the rainfall-runoff model of the Lanyoung River can be built through the combination of the 145 patterns. Fig. 5 presents the training of FCNN with 8=0.2 for the Lanyoung River at the Lanyoung Bridge. The hydro- graphs of observed and forecasted streamflows are quite satisfactory. Even the event has two peak flows, the runoff can also be accurately forecasted by the rainfall. The figure of residual indicates that the runoff measured is correctly forecasted by the FCNN. Fig. 6 shows the performance of validation subset data by the FCNN with 8=0.2 and IUH. Fig. 7 illustrates the hyetographs of each rain gage station and the observed and forecasted hydrographs by FCNN with 8=0.2. The peaks are captured by the FCNN and the forecasting lines fairly fall on the observed flood data. It also
o Observed flood flow
Predicted flood flow
0 1000
Taiwan Water Converancy Agency Data, 711994-811994 0 Observed flood flow
-
FCNN%
-
w 1 0z
0 20 40 60 80 100 120 Sequence (hr)-
-
-
A
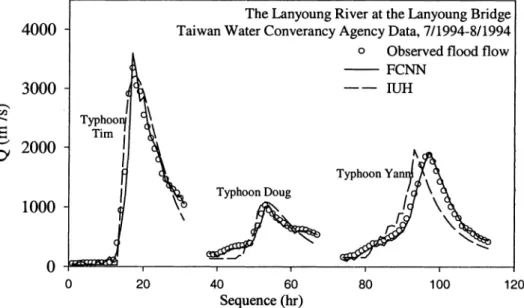
Fig. 6 . Performance of one-hour-ahead flood forecasting by the FCNN with 8=0.2 and simu- lation results by IUH in validation subset data.
I
-10000 50 100 150 200 250 300 350 400
Sequence (hr)
Fuzzy Clustering Neural Network as Flood Forecasting Model
0 Observed
-
FCNNSequence (hr)
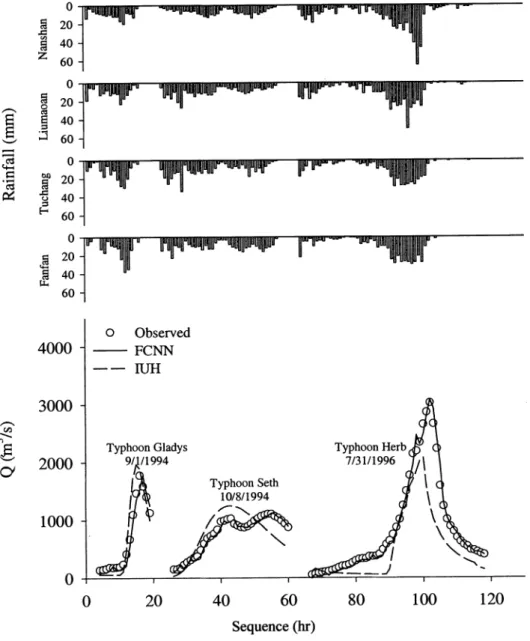
Fig. 7. Accuracy of floods forecasted by FCNN and simulated by IUH for the Lanyoung River at the Lanyoung Bridge.
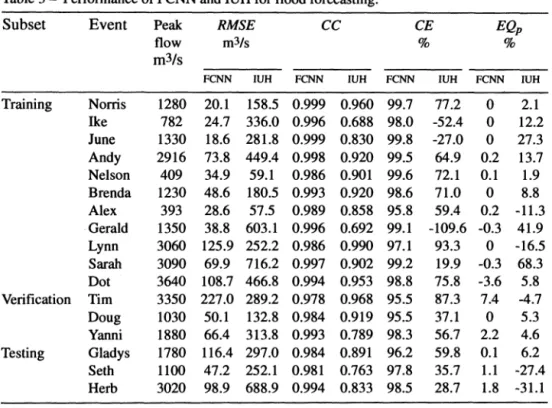
shqws the comparison of the IUH and the FCNN. The ability of IUH to forecast the flood with 2 peaks is weak. In addition, IHU severely underestimates the peak of the event of Typhoon Herb. The FCNN can provide one-hour-ahead flood forecasts quite well and has better performance than the IUH. The overall performance of the FCNN and IUH for flood forecasting is summarized in Table 3. Apparently, the
Table 3
-
Performance of FCNN and IUH for flood forecasting.Subset Event Peak RMSE C C C E
flow m3Is % EQP %
m31s
FCNN IUH FCNN IUH FCNN IUH FCNN IUH
Training Noms 1280 20.1 158.5 0.999 0.960 99.7 77.2 0 2.1 Ike 782 24.7 336.0 0.996 0.688 98.0 -52.4 0 12.2 June 1330 18.6 281.8 0.999 0.830 99.8 -27.0 0 27.3 Andy 2916 73.8 449.4 0.998 0.920 99.5 64.9 0.2 13.7 Nelson 409 34.9 59.1 0.986 0.901 99.6 72.1 0.1 1.9 Brenda 1230 48.6 180.5 0.993 0.920 98.6 71.0 0 8.8 Alex 393 28.6 57.5 0.989 0.858 95.8 59.4 0.2 -11.3 Gerald 1350 38.8 603.1 0.996 0.692 99.1 -109.6 -0.3 41.9 Lynn 3060 125.9 252.2 0.986 0.990 97.1 93.3 0 -16.5 Sarah 3090 69.9 716.2 0.997 0.902 99.2 19.9 -0.3 68.3 Dot 3640 108.7 466.8 0.994 0.953 98.8 75.8 -3.6 5.8 Verification Tim 3350 227.0 289.2 0.978 0.968 95.5 87.3 7.4 -4.7 Doug 1030 50.1 132.8 0.984 0.919 95.5 37.1 0 5.3 Yanni 1880 66.4 313.8 0.993 0.789 98.3 56.7 2.2 4.6 Testing Gladys 1780 116.4 297.0 0.984 0.891 96.2 59.8 0.1 6.2 Seth 1100 47.2 252.1 0.981 0.763 97.8 35.7 1.1 -27.4 Herb 3020 98.9 688.9 0.994 0.833 98.5 28.7 1.8 -31.1
FCNN has better performance in training, verification, and testing, than the IUH in terms of RMSE, CC, CE, and EQp'. All CCs and CEs of FCNN are very close to 1. Compared with IUH, the RMSEs and EQp of FCNN are much smaller. This shows that the forecasting ability of the FCNN is better than the simulated performances of the IUH. These results indicate the accuracy and reliability of the FCNN.
Conclusions
The structure, training and application of the FCNN for flood forecasting are pre- sented herein. In essence, the FCNN shows good capability for flood forecasting. By adopting a hybrid learning scheme, the model can be split into two phases, unsuper- vised and supervised learning. During the unsupervised learning, the fuzzy min-max clustering is employed to measure the similarity of the input data for classifying. During the supervised learning, the method of least squares is used to determine the weights between the hidden and output layers. A model-free estimator is one of the most notable advantages of the FCNN and the ability to learn is another. The struc- ture and weights of the model are adjusted automatically and dynamically by learn- ing the historical data. Only one user-defined parameter, 0, is needed to construct the
Fuuy Clustering Neural Network as Flood Forecasting Model
flood-forecasting model. This enables the users to easily apply the FCNN. T h e rain- fall and floods of the Lanyoung River are used to verify the FCNN for flood fore- casting. T h e FCNN can provide better predictive capability than the simulation of the IUH. T h e results also indicate that the FCNN is a practical tool offering reliable and accurate flood forecasting.
Acknowledgement
This paper is based on work supported by National Science Council, R.O.C. (Grant no. NSC 89-2313-13-002-041). In addition, the authors are indebted to the review- ers for their comments.
References
Chang, F.-J;, and Chen, Y.-C. (2001) A counterpropagation fuzzy-neural network modeling approach to real time streamflow prediction, J. Hydrol., Vol. 245(1-4), pp. 153-164. Chang, F.-J., Hu, H.-F., and Chen, Y.-C. (2001) Counterpropagation fuzzy-neural network for
streamflow reconstruction, Hydrol. Process.,Vol.l5, pp.219-232.
Chang, F.-J., and Hwang, Y.-Y. (1999) A self-organization algorithm for real-time flood fore- casting, Hydrol. Process., Vol. 13, pp 123-138.
Chow, V. T., Maidment, D. R., and Mays, L. W. (1988) Applied Hydrology, McGraw-Hill, New York, pp. 261-264.
Fread, D. L. (1978) NWS operational dynamic wave model, Proceedings, 25th Annual Hy- draulics Division Specialty Conference, ASCE, pp. 455-464.
Gyasi-Agyei, Y., de Troch, F. P., and Troch, P. A. (1996) A dynamic hillslope response model in a geomorphology based rain-runoff model, J. Hydrol., Vol. 178(1-4), pp. 1-18.
Hecht-Nielsen, R. (1987) Counterpropagation network, Applied Optics, Vol. 26(3), pp. 4979-
4984.
Hsu, K.-L. Gupta, H. V., and, Sorooshian, S. (1995) Artificial neural network modeling of the rainfall-runoff process, Water Resou,: Res., Vol. 31(10), pp. 2517-2530.
Jang, J. S. R. (1992) Self-learning fuzzy controllers based on temporal back propagation, IEEE Trans. Neural Networks, Vol. 3(5), pp. 714-723.
Kraijenhoff, D. A., and Moll, J. R. (1986) River Flow Modelling and Forecasting, Dordrecht, Netherlands, pp. 11-37.
Kuligowski, R. J., and Barros, A. P. (1998) Using artificial neural networks to estimate miss- ing rainfall data, Journal of the Am.. Water Resou,: Assoc., Vol. 34(6), pp. 1437-1447. McCulloch, W. S., and Pitts, W. (1943) A logical calculus of the ideas immanent in nervous
activity, Bulletin of Mathematical Biophysics, Vol. 5, pp. 115-133.
Minns, A. W., and Hall, M. J. (1996) Artificial neural networks as rainfall-runoff models, Hy- drol. Sci. J., Vol. 41(3), pp. 399-417.
Montanari, A,, Rosso, R., and Taqqu, M. S. (2000) A seasonal fractional ARIMA model ap- plied to the Nile River monthly flows at Aswan, Water Resoul: Res., Vol, 36(5), pp. 1249-
Moody, J., and Darken, C. (1989) Fast learning in networks of locally-tuned processing units,
Neural Comput., Vol. I , pp. 281-294.
O'Donnell, T. (1960) Instantaneous unit hydrograph derivation by harmonic analysis, Int. As-
SOC. Sci. Hydrol., Vol. 51, pp. 546-557.
Moussa, R., and Bocquillon, C. (1996) Criteria for the choice of flood-routing methods in nat- ural channels, J. Hydrol., Vol. 186(1-4), pp. 1-30.
Rumelhart, D. E., Hilton, G. E., and Willianms, R. S. (1986) Learning internal representation by error propagation, Parallel Dist. Process, Vol. I , pp. 318-362.
Simpson, P. K. (1993) Fuzzy min-max neural networks. Part 2: Clustering, IEEE Trans. Fuuy
Systems, Vol. 1, pp. 32-45.
Stone, M. (1974) Cross-validatory choice and assessment of statistical predictions, Journal of
the Royal Statistical Society, Vol. B36, pp. 1 1 1-133.
Wang, G.-T., and Chen S. (1996) A linear spatially distributed model for a surface rainfall- runoff system, J. Hydrol., Vol. 185(1-4), pp. 183-198.
Yang, C. C., Prasher, S. O., Lacroix, R., Sreekanth, S., Patni, N. K., and Masse, L. (1997) Ar- tificial neural network model for subsurface-drained farmland, J. of Irr: and Drain. Engrg..
ASCE, Vol. 123(4), pp. 285-292.
Yang, C. C., Tan, C. S., and Prasher, S. 0. (2000) Artificial neural networks for subsurface drainage and subirrigation systems in Ontario, Canada, J. Am. Water Resour: Assoc., Vol.
36(3), pp. 609-618.
Zadeh, L. A. (1965) Fuzzy Sets, In$ Cont. Vol. 8 , pp. 338-353. Received: 22 May, 2001
Revised: 17 August, 2001 Accepted: 13 December, 2001
Address: Fi-John Chang,
Dept. of Bioenvironmental Systems Eng. and Hydrotech Research Institute, National Taiwan University, Taipei,
Taiwan, R.O.C.
Yen-Chang Chen and Jing-Ming Liang, Same address.