國
立
交
通
大
學
網路工程研究所
碩
士
論
文
手持裝置中圖形化介面之順暢度評比
Benchmarking Handheld GUI:
Smoothness QoE
研 究 生:温倩苓
指導教授:林盈達 教授
手持裝置中圖形化介面之順暢度評比
Benchmarking Handheld GUI:
Smoothness QoE
研 究 生:温倩苓 Student: Chien-Ling Wen
指導教授:林盈達 Advisor: Dr. Ying-Dar Lin
國立交通大學
網路工程研究所
碩士論文
A Thesis
Submitted to Institute of Network Engineering College of Computer Science
National Chiao Tung University in partial Fulfillment of the Requirements
for the Degree of Master in Computer Science June 2013 Hsinchu, Taiwan
中華民國 102 年 6 月
I
手持裝置中圖形化介面之順暢度評比
學生:温倩苓
指導教授: 林盈達
國立交通大學網路工程研究所
摘要
隨著智慧型手持裝置的市占率增加,手持裝置的順暢度也逐漸成為使用者選 購手機的因素之一。目前尚無一套標準的評比方法來評測智慧型手持裝置的圖形 化介面之順暢度,一般常用來評估順暢度的指標為畫面更新率與反應時間,但單 憑此兩個指標不足以代表使用者互動的順暢度。因此,我們分析使用者在智慧型 手持裝置之使用行為的服務品質與經驗品質之關係來建立智慧型手持裝置之順 暢度經驗品質模型。我們觀察的服務品質包含畫面改變的時間間隔之變異性、時 間間隔之平均值、最大時間間隔、無反應次數、超過最大時間的次數、畫面改變 量。經實驗證明各指標在對數關係時,除了最大時間間隔與畫面改變量,其他的 指標的相關性高達 71.5%以上,易造成共線性的問題並增加模型的誤差。由此實 驗結果,我們推論最長的等待時間與畫面的不連續為造成不順暢感官的原因,分 別可由最大時間間隔與畫面改變量兩指標來代表。因此,最大時間間隔與畫面改 變量較適合為我們服務品質的指標。另一方面,我們設計一個是非題的問卷客觀 地評估經驗品質,根據問卷結果,我們可以發現使用者對於不同的使用者行為有 不同程度的順暢度感官。相較於三隻手機(HTC hero、Huawei U8860 和 Nexus S) 的問卷結果,我們模型的錯誤率皆低於 9%。II
Benchmarking Handheld GUI:
Smoothness QoE
Student: Chien-Ling Wen
Advisor: Dr. Ying-Dar Lin
Department of Computer Science
National Chiao Tung University
Abstract
With the rapid growth of smartphones in market, the smoothness of smartphones
becomes a crucial factor considered by consumers in making their buying decisions.
However, there is no standard benchmark for comparison. In addition, the commonly
used smoothness indexes, such as the frame rates and response time, cannot cover all
aspects of smoothness of smartphones. In order to fairly evaluate the smoothness of
smartphone, we developed a handheld smoothness evaluation over regression (HSER)
model to benchmark the smoothness of smartphones. We first recorded a video and
extracted several key indexes to represent behavior-based smoothness quality of
services (BQoS), including the mean of frame intervals (MFI), variance of frame
intervals (VFI), maximal frame interval (MaxFI), frame no response (FNR) and times
of maximal frame interval (TMaxFI) and number of frame intervals (NFI). The
correlation of MFI, VFI, FNR and TMaxFI is higher than 71.5% in logarithmic
relationship. To avoid the collinearity problem which may lead to extra error, MaxFI
and NFI are used to be the indexes for our HSER model. We next built up a
relationship between BQoS and behavior-based smoothness quality of experience
(BQoE). Finally, we converted BQoE to handheld smoothness quality of experience
(HQoE). In our experiment, MaxFI and NFI are also good indexes for the
“non-smooth” situations which have the long waiting time and the fragmentary frames. In addition, we tested three different smartphones, HTC hero, Huawei U8860
III
and Nexus S, to evaluate the applicability of HSER. Our results show that the proposed HSER model is able to fairly evaluate the smoothness of smartphones
because the error rate of the HSER model is lower than 9%.
IV
致謝
非常感謝諸位師長、同學、朋友與家人在碩士論文研究生涯中不斷地給予協 助與鼓勵。在這段求學的過程中,首先感謝林盈達教授、賴源正教授和朱宗賢教 授的費心指導。從題目的形成至論文的產生,期間總是耐心地引導我做研究的嚴 謹態度與論文寫作的技巧與知識。 其中,在做人處事方面,特別感謝林老師的教導,從進入實驗室開始,不斷 訓練我們做人處事的態度以及面對問題的邏輯性思考。老師總是以身作法,包含 對自己未來的規劃、時間管理的重要性等等,從老師身上學到很多對自己負責應 有的態度。論文研究方面,感謝林老師與賴老師的指導,時常面臨不知道該如何 做下去的窘境與看待問題的角度也不夠細膩,但每次的討論,老師們總能適時的 給予方向與協助,不時也會反向鼓勵。從討論中,學習到老師們剖析問題的角度 與清楚的邏輯關係,使自己剖析問題時更能全面思考。 萬分感謝朱宗賢教授不辭辛勞地為我修訂論文與撰寫方向,時常無法掌握整 篇的重點、英文能力也不佳,透過老師的批改,更能體會論文精簡與論述的重要 性。另外,極度感謝洪慧念教授在我的論文研究末期,耐心地指導我有關統計方 面的知識,統計知識的不足是整篇論文最煎熬的一部分,很感謝老師清楚地講解 與分析,獲益良多。在此非常感謝老師們的指導與教誨。 感謝交大嵌入式測試中心的甘東杰經理在期間給予我許多嵌入式系統的知 識、測試項設計的精神與手持裝置設備的提供。感謝高速網路實驗室的同學、學 長們,總是在我無助時伸出援手、互相討論、分享心情,很開心一起和樂的度過 這兩年碩士生涯。感謝我的媽媽、弟弟、男友與大學的姊妹們,在我遭遇到挫折 與苦難時,給予適當的支持和鼓勵,謝謝媽媽無條件的付出讓我能專心一致的完 成學業。最後,感謝所有在問卷方面給予協助的朋友們,因為有你們,我才能順 利地產生此篇論文。非常感謝大家的幫忙。 温倩苓 謹誌於 102.06.05V
Contents
LIST OF FIGURES ... VI
LIST OF TABLES ... VII
CHAPTER 1 INTRODUCTION ... 1
CHAPTER 2 BACKGROUND ... 4
2.1CHALLENGES OF BENCHMARKING SMOOTHNESS ... 4
2.2METHODS OF EXTRACTING THE CHANGING FRAMES... 4
2.3RELATED WORK ... 5
CHAPTER 3 PROBLEM STATEMENTS ... 10
3.1TERMINOLOGY ... 10
3.2PROBLEM DESCRIPTION ... 11
CHAPTER 4 HANDHELD SMOOTHNESS EVALUATION OVER REGRESSION ... 13
4.1OVERVIEW OF APPROACH ... 13
4.2THE ACQUISITION OF BQOS ... 14
4.3THE QUESTIONNAIRE OF BQOE ... 18
4.4THE IMPLEMENTATION OF THE EX-DOS TOOL ... 19
CHAPTER 5 EVALUATION... 23
5.1TESTBED ... 23
5.2RELATIONSHIP BETWEEN HOS AND DOS ... 25
5.3CORRELATION BETWEEN BQOSS AND BQOE ... 26
5.4ANALYSIS OF THE HSER MODEL ... 29
5.5EVALUATION OF HSER MODEL ... 31
CHAPTER 6 CONCLUSIONS AND FUTURE WORK ... 33
VI
List of Figures
FIG.1FLOWCHART OF HSER ... 13
FIG.2THE ALGORITHM OF COMPUTING FRAME INTERVALS... 15
FIG.3AN EXAMPLE OF DERIVING FI ... 16
FIG.4THE FACTOR OF NFI ... 17
FIG.5IDEA OF QUESTIONNAIRE ... 18
FIG.6THE FLOW FOR ACQUISITION OF BQOS AND THE EX-DOS TOOL ... 19
FIG.7THE FLOW OF EX-DOS TOOL ... 21
FIG.8THE ACQUISITION OF HOTS... 22
FIG.9THE SYNCHRONIZATION OF TIME ... 22
FIG.10THE EXPERIMENT ENVIRONMENT. ... 25
FIG.11THE VALUE OF Α IN DIFFERENT BEHAVIORS. ... 26
FIG.12THE RELATIONSHIP BETWEEN THE VFI AND BQOE. ... 30
FIG.13THE SATISFACTION AND CONFIDENCE INTERVAL OF SMARTPHONES. ... 32
VII
List of Tables
TABLE 1THE COMPARISON OF RELATED WORK ON INDEXES OF SMOOTHNESS ... 8
TABLE 2THE COMPARISON OF RELATED WORK ON QOE MODELS ... 9
TABLE 3DEFINITION OF NOTATIONS. ... 12
TABLE 4THE GENERAL OPERATIONS FOR EACH BEHAVIOR. ... 25
TABLE 5THE CORRELATION OF CORRELATION R BETWEEN BQOSSAND BQOE ... 28
TABLE 6THE CORRELATION OF CORRELATION R BETWEEN BQOSS ... 28
1
Chapter 1 Introduction
Nowadays, the number of smartphones in use is accelerating. Among its variety
of applications, the most essential ones include web browser, e-mail, multimedia
entertainment, and mobile games. Interacting with these mobile applications differs
from interacting with traditional desktop applications. All these mobile applications
are triggered by multi-touch gestures, such as tap, double tap, and scroll, rather than
keyboard or mouse. The smoothness of touch screen response now is one of the
crucial factors considered by consumers in making their buying dec
isions. Therefore, it becomes important for both consumers and manufactures to
fairly evaluate the smoothness of smartphones.
Indexes of Smoothness
Frame rate is the most commonly used index to measure the smoothness of a
video. The higher the frame rate gets, the better the quality of played back video
becomes. However, Tian et al. [1, 2] found that two videos with the same average
frame rate can provide very different user experiences, because one may abruptly
drop a large number of frames while another may maintain an uniform frame rate.
Some researchers adopted packet loss rate and network delay to evaluate the
smoothness of an online game or network streaming [3, 4, 5, 6]. Although these
indexes can reflect user experience of human-interactive applications, they are not
able to cover all aspects of smoothness of smartphones, especially when the
smartphones under test are executed in the same network environment. Hyeon-Ju et al.
[7] also found that the off-the-shelf hardware benchmark applications, such as
AnTuTu-Benchmark [8] and SmartBench [9], are not able to evaluate the interaction
2
software can affect system performance. Traditionally hardware performance metrics
cannot fully evaluate the smoothness of smartphones. As a result, it is required to
develop a new method to measure the smoothness of smartphones.
Handheld Smoothness Evaluation over Regression
In this work, we adopted behavior-based smoothness quality of experience
(BQoE) to quantify the smoothness of a smartphone. A behavior is defined as a
sequence of operations for an application. For example, making a phone call is a
behavior, which includes a sequence of operations, such as browsing the list of
contacts and tapping phone numbers. In order to measure BQoE, we first measured
behavior-based smoothness quality of service (BQoS), which is service performance
used to determine user satisfaction. In order to represent BQoS, we recorded a video
and then extracted several key indexes. These key indexes included the mean of frame
intervals (MFI), variance of frame intervals (VFI), maximal frame interval (MaxFI),
frame no response (FNR) and times of maximal frame interval (TMaxFI). Since the
indexes may not always be measurable, especially when the changes between frames
are fast, we further developed a tool, named Ex-DOS (extraction of device operation
sequence), to obtain necessary information. We repeated the previous data extraction
process to obtain the same indexes from different videos that represented different
user scenarios, such as calling a contact, downloading a web page or an application.
Based on obtained BQoS, we then designed a questionnaire to determine the
relationship between BQoS and BQoE. Finally, we converted the BQoE to handheld
smoothness QoE (HQoE) by considering how frequently each behavior is performed
in daily life.
In order to evaluate the effectiveness of the proposed method, we conducted
3
Nexus S. We investigated the applicability of our handheld smoothness evaluation
over regression (HSER) model in different user scenarios. Some user scenarios are
time-critical, such as making a phone call, while others are not, such as browsing a
web page. We validated the correctness of the HSER model by comparing it to our
questionnaire results.
The rest of this work is organized as follows. Chapter 2 briefs the motivation and
reviews related work to justify our problems. Chapter 3 gives the definition of
variables we used in this work and describes our problem statement. Chapter 4 derives
the mapping form BQoS to BQoE and illustrates our implementation. Chapter 5
4
Chapter 2 Background
The chapter first describes the challenges of benchmarking smoothness, and then
describes the methods used to extract the changing frames. Finally, existing works
related to smoothness indexing and QoE modules are given.
2.1 Challenges of benchmarking smoothness
As far as we know, there is no standard way to benchmark the user experience of
smartphone’s smoothness. Response time and frame rate per second (FPS) are two commonly used indexes to evaluate the interaction of human with smartphones.
According to Jakob Nielsen’s et al. [11] and Miller’s et al. [12] investigation, 0.1 second is the minimum delay that human can feel. When the delay increases to 1
second, it makes the application feel sluggish. Further, if the delay is longer than 10
seconds, users will switch to other tasks. Similar results can be found in [13], in which
0.2 second is the minimum threshold for human to perceive a delay of an application.
For playing a video, a minimum of 20 FPS is recommended. Any FPS bellows 20 will
induce a noticeable delay and the user will see choppiness and discrete images.
However, these indexes can only reflect the smoothness of one action; they are not
able to evaluate the smoothness of the whole system. Furthermore, same operations
with the same response time may lead to different user experience because the
changing frames displayed on a smartphone may be different. Dividing the changing
frames into early stage and late stage. One may perform smoothly in the early stage
while another may perform smoothly in the late stage.
2.2
Methods of extracting the changing frames
In order to automatically analyze the smoothness of a smartphone, it is necessary
to record the interaction between human and a smartphone. This interaction can be
5
software agent, such as Screencast Video Recorder [14], that runs on the smartphone
and captures frames from the video buffer of the smartphone. Although internal
recorders are easy to install and setup, they may lack the scalability for every
smartphone and induce extra overhead for the system. For example, the Screencast is
not suitable for the smartphones with Nvidia’s processor and requires many memory copies [15] to capture frames from the video buffer of the smartphone. In addition, the
FPS of the smartphones with 4.0 and 4.1 Android platform, which is the most version
on the smartphones with Android platform, can be larger than 60. However, the
number of frames per second an internal recorder can capture is usually lower than 60.
As a result, some frames will not be record and the captured video may not fully
represent the original behavior of a smartphone. On the contrary, the FPS of a video
captured by an external camera can be larger than 60, depending on the specification
of camera. However, the quality of the captured video is sensitive to the environment
such as light intensity. More image preprocessing is also required before the captured
video can be used to analyze the smoothness of a smartphone. In this work, we
adopted an external recorder in order to achieve the scalability for all smartphones
and accurately extract the changing frames for avoiding losing any frames.
2.3 Related Work
Indexes of smoothness
Several indexes have been proposed to evaluate the performance of a network.
For network quality, Rohani Bakar et al. [3] adopted jitter and latency to evaluate the
QoS. Their experiment results were validated by comparing them with the standard
quality management scale defined by ITU-T P.862. Chang et al. [4] quantified the
requirement of network quality, such as network delay, packet loss rate and delay
6
loss rate, and server packet loss rate, Chen et al. [5] developed a model to predict
when players will leave a game. Chen et al. [6] also established the relationship
between call duration and network quality, such as network delay, packet loss rate and
delay jitter, to quantify the user satisfaction on VoIP applications. All the above
mentioned network-based indexes are not able to fully evaluate the smoothness of
smartphones because those indexes are closely related the quality of networks. It is
hard to quantify the relationship between users’ interaction such as the clicking, long
pressing and the network-based indexes.
In order to evaluate system-wide performance, several benchmarks have been
developed to evaluate the performance of each hardware component of a smartphone,
such as AnTuTu-Benchmark, which includes “Memory Performance”, “CPU Integer
Performance”, “CPU Floating point Performance”, “2D 3D Graphics Performance”, “SD card reading/writing speed”, and “Database IO Performance”. Hyeon-Ju et al. [7] mentioned that hardware performance may not be able to fully represent software
performance. Using two different strategies to implement the same software function
on a platform will result in different performance. Hence, they adopted an Android
utility, named Dalvik Debug Monitor Server (DDMS), to measure execution time.
Although their method can evaluate the software performance, it requires the source
codes of the application under test. Our method, on the contrary, does not need source
codes and can perform black-box testing.
Tian et al. [1, 2] demonstrated that the average frame rate cannot fully reflect the
smoothness of a video because burst drop frame rate, which is rate of the suddenly
dropping frames,can significantly affect user satisfaction. As a result, they extracted
motion vectors (MVs) from a video to evaluate the smoothness. However, the motion
7
example, some dark frames on smartphones are static. The MV can be captured more
precisely by the internal recorders than the external camera. For example, the MVs of
some dark frames on smartphones are zero. However, for the external camera, MVs of
these frames may be mistaken because of the effect of light intensity of testing
environment. Therefore, the index of MVs is not suitable for the external camera.
Xiao Feng [10] discovered that the four indexes including maximal frame time, frame
time variance, frame rate, and frame drop rate may influence the smoothness of user
interactions. He first tested the same touch event of fling on two different
smartphones. He then found that the smartphone with lower hardware specification
performed better than that with higher hardware specification in user experience. The
reason was that the frame time variance and the maximal frame time of the low-end
smartphones are quite low. Users feel sluggish when frames do not display smoothly.
However, he used only fling operation for benchmarking which can’t represent every
aspect of smartphone smoothness. On the contrary, in this work, we extended the four
indexes Xiao Feng found and translated the frame time to frame intervals for the
consistence. However, the frame drop rate of one operation sequence is unknown. The
number of frame interval will be reduced if the frame drop rate becomes higher.
Therefore, the four indexes we used are the mean of frame intervals (MFI), variance
of frame intervals (VFI), maximal frame interval (MaxFI) and number of frame
intervals (NFI). In addition, the touch screen of smartphone is not sensitive and users
will end the tasks if the delay is longer than 10 seconds. For these reason, we also
used other two indexes, frame no response (FNR) and times of maximal frame
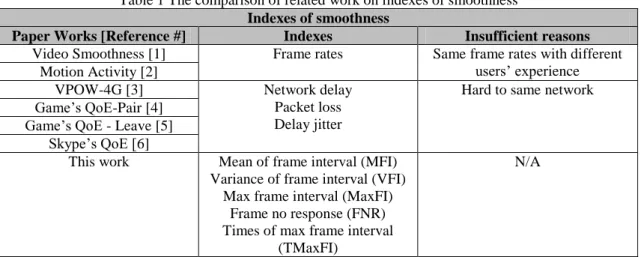
interval (TMaxFI), to evaluate the smoothness of operations. Table 1 shows that the
8
Table 1 The comparison of related work on indexes of smoothness Indexes of smoothness
Paper Works [Reference #] Indexes Insufficient reasons Video Smoothness [1] Frame rates Same frame rates with different
users’ experience Motion Activity [2]
VPOW-4G [3] Network delay Packet loss Delay jitter
Hard to same network Game’s QoE-Pair [4]
Game’s QoE - Leave [5] Skype’s QoE [6]
This work Mean of frame interval (MFI) Variance of frame interval (VFI)
Max frame interval (MaxFI) Frame no response (FNR) Times of max frame interval
(TMaxFI)
N/A
QoE models
There are two kinds of methods to build up a QoE model: subjective methods
and objective methods. A subjective method requires user’s opinion to assess the QoE
while an objective method adopts QoS parameters to assess the QoE. Most
objective-based methods were evaluated by user’s or application’s behaviors. For
example, Chen et al. [5, 6] collected packet traces to analyze the relationship between
user behaviors and user experience, such as the duration of time users leave a game or
end a phone call. However, low satisfaction is not the only reason that users leave a
game or end a phone. As a result, their argument may not be applied to every scenario.
Rohani Bakar et al. [3] evaluated Skype application by an existing standard, Standard
Quality Management (SQM) defined by ITU-T P.862. Although the SQM is good for
the perfect network, it may not be applicable to a network environment with packet
losses and propagation delay. More QoS parameters are required to evaluate
Skype-like applications. Chang et al. [4, 16] used the subjective method that adopted
paired comparison to access the game’s or multimedia’s satisfaction. They first asked
users to compare two similar samples, such as two videos or two pictures, and select
the one with better quality. Based on the users’ selection, they then adopted the
9
probability the sample has, the higher satisfaction user experience it is. However, the
comparison is not fair because the users’ selection may be influenced by similar samples. For example, in the case of showing continue similar samples, users consider
the second sample as non-smooth by comparing with the first sample. However, in the
case of showing non-continue similar samples, users consider the second sample as
smooth individually. In this work, we used yes or no question for a sample to avoid
possible influences of similar samples and fairly evaluate the smoothness of different
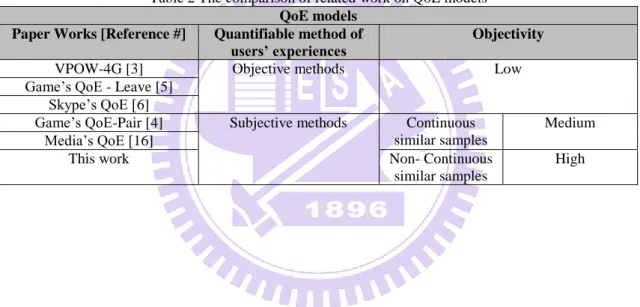
smartphones. Table 2 shows that the comparison of related work on QoE models.
Table 2 The comparison of related work on QoE models QoE models
Paper Works [Reference #] Quantifiable method of users’ experiences
Objectivity
VPOW-4G [3] Objective methods Low
Game’s QoE - Leave [5] Skype’s QoE [6]
Game’s QoE-Pair [4] Subjective methods Continuous similar samples
Medium Media’s QoE [16]
This work Non- Continuous
similar samples
10
Chapter 3 Problem Statements
3.1 Terminology
Let denote the number of behaviors used for smoothness evaluation. A behavior is defined as a sequence of operations for an application (APP) . For example, making a phone call is a behavior, which includes a sequence of operations, such as browsing the list of contacts and tapping phone
numbers. We use human operation sequence ( ) to represent the sequence of human operations in . In addition, the device operation sequence ( ) is the responses to . For example, the device operation sequence of making a phone call is a sequence of changing frames. Each is associated with a human
operation time sequence ( ), which stores the time instants of each human
operation. Similarly, each is associated with a device operation time sequence ( ), which stores the time instants of each device operation. In order to benchmark the smoothness of a smartphone, for each , we first extract all frame
intervals, named , from and . We then use the translation function to determine each , which is the j-th of ,; that is,
. Next, we find the relationship between and bythe translation function ; that is, . Let denote the set of all . We finally convert to by the function ; that is, Table 3 lists the definition of the notations used in this work.
For example, let represent the behavior of making a phone call, which
includes three operations. They are opening the APP, scrolling the contact list and
dialing up a phone. Then, is {opening the APP, scrolling the contact list, dialing up a phone}, and is {0s, 0.5s, 1.2s}, which records the starting time of each operation. In addition, in order to respond to , is {popping up
11
app, displaying the contact list, popping up a dialog of communication state}. Each
response in is mapped to several video frames. The timing of these video frames is recorded in . Assuming that is {0.1s, 0.2s, 0.3s, 0.6s, 0.7s, 0.8s, 1.3s, 1.4s}, it implies that the screen starts to change at 0.1s after the user
opening the APP. The timing 0.2s and 0.3s represent the process of showing up the
APP. The process of opening the APP finally completes as 0.3s. In addition, after the
user scrolled up the contact list, the smartphone made a series of corresponding
responses to the request at 0.6s, 0.7s and 0.8s. The process of scrolling the contact list
was completed at 0.8. Similarly, the smartphone started to display a dialog of
communication state at 1.3s and completed at 1.4s. In Chapter 4.2, we will introduce
the method of calculating .
3.2 Problem Description
Let denote the set of all and the set of all . Given and , we aim to design functions , and so that the can be determined.
12
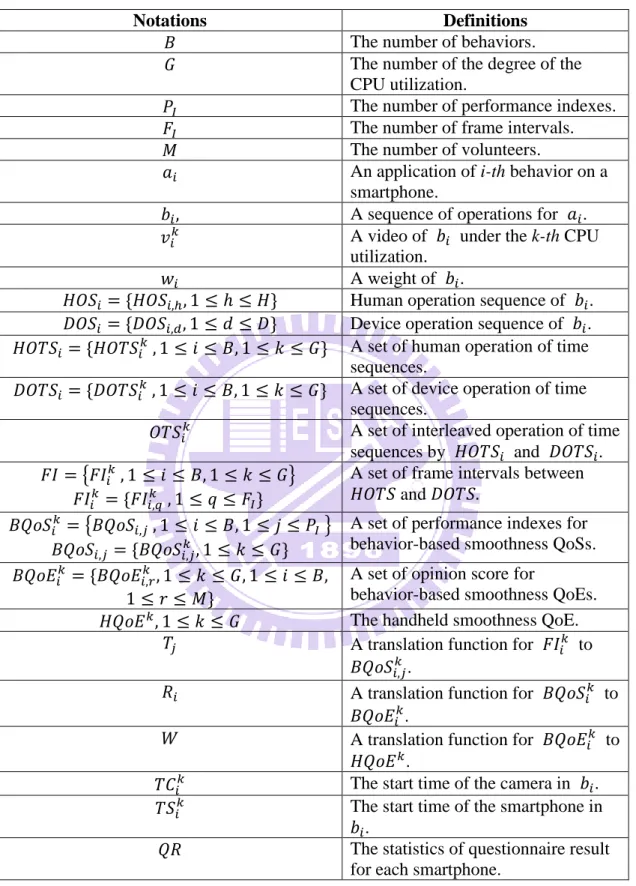
Table 3. Definition of notations
Notations Definitions
The number of behaviors.
The number of the degree of the
CPU utilization.
The number of performance indexes. The number of frame intervals.
The number of volunteers.
An application of i-th behavior on a smartphone.
A sequence of operations for .
A video of under the k-th CPU utilization.
A weight of .
Human operation sequence of . Device operation sequence of .
A set of human operation of time sequences.
A set of device operation of time sequences.
A set of interleaved operation of time
sequences by and . { }
A set of frame intervals between and .
{ }
A set of performance indexes for behavior-based smoothness QoSs.
A set of opinion score for
behavior-based smoothness QoEs.
The handheld smoothness QoE.
A translation function for to .
A translation function for to .
A translation function for to
.
The start time of the camera in .
The start time of the smartphone in
.
The statistics of questionnaire result
13
Chapter 4 Handheld Smoothness Evaluation over Regression
Accurately measuring every and building up a relationship between a and its associated are two key steps to determine Handheld Smoothness QoE . In this chapter, we first give an overview of HSER. We then describe the methods used to determine each and explain how to build up a relationship between a and its associated .
4.1 Overview of HSER
Figure 1. Flowchart of HSER
Figure 1 shows the overview of our approach. In order to benchmark the
smoothness of a smartphone, we adopted commonly-used behaviors for evaluation. For each behavior , we first record its associated and under different CPU utilization. Let denote the human operation time sequence of behavior under the k-th CPU utilization. In other words, is the set of , ,…, }. Similarly, is the device operation time sequence of behavior under the k-th CPU utilization and is the set of , ,…, }. For each CPU utilization, we extract all frame intervals, named , from and . We then use the translation
14
function to determine each , which is the j-th of ,under the k-th CPU utilization. In other words, we have . In this work, we consider six indexes. They are the mean of frame intervals (MFI), variance of frame intervals (VFI), maximal frame interval (MaxFI), frame no response (FNR),
times of maximal frame interval (TMaxFI) and the number of frame intervals (NFI).
Next, we design a questionnaire to find the relationship between and . We finally convert to by the function
4.2 The Acquisition of BQoS
There are two steps to obtain . The first step is to extract all , from and and the second step is to calculate by a translation function .
Step1: Extraction of all
We adopted eight commonly-used behaviors for evaluation. They are browsing web pages, viewing gallery, texting messages, listening to music,
making a phone call, viewing a map, playing a game and switching between different
desktops. For each behavior , we used Android keylogger (AKL) [17] to record
user behavior so that we can obtain under the condition of the k-th CPU utilization. In the replay stage, we replayed the user behavior and adopted an external
camera to capture the device responses. The captured video is then processed by our
tool, Ex-DOS (See Chapter 4.4) in order to obtain under the condition of the
k-th CPU utilization. Based on and , we extracted by the
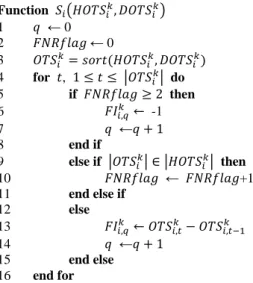
algorithm shown in Figure 2.
Let denote the time sequence which is obtained by sorting and (line 3), 𝑡 represent the t-th time instant in and notate the
15
The first case is no response; that is, there is no time instant of between current and next time instant of . In this case, is set to -1 (line 5 to 8). The second case is that is not including the waiting time from the last operation finished to the next operation started (line 9 to 11). The third case is that represents the response time of the operation in and the changing frame (line 12 to 15).
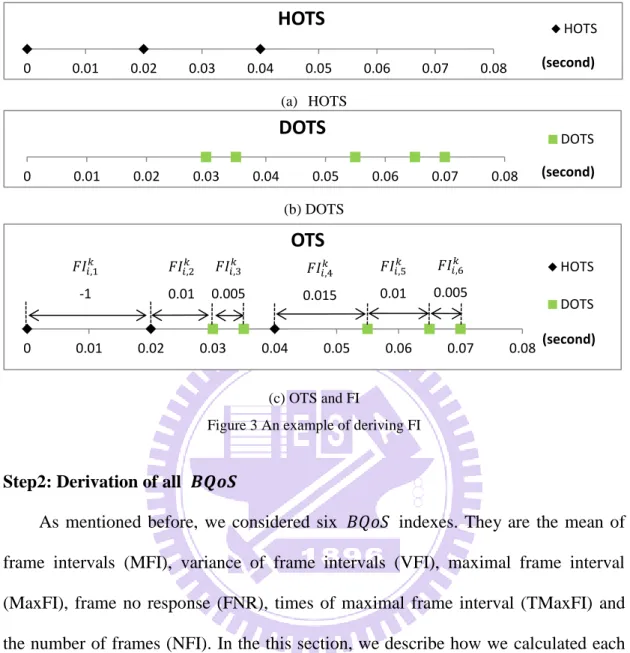
For example, as shows in Figure 3(a) and Figure 3(b), let be {0, 0.02, 0.04} and be {0.03, 0.035, 0.055, 0.065, 0.07}. Three triggered time of corresponding operations are at time instant 0, 0.02 and 0.04 respectively. After
sorting and , we can obtain {0, 0.02, 0.03, 0.035, 0.04, 0.055, 0.065, 0.07} shown in Figure 3(c) and the number with the baseline means the time
instant of . Since 0 and 0.02 are in , it implies that there is no response to the first operation of . As a result, is set to -1. In the second round, is set to the response time the second operation of ; that is = 0.01. The process stops until 0.055. Hence, is 0.005 (=0.035-0.03). Similarly, the response time of the third operation of is 4, which is calculated by 0.055-0.04. Finally, 5 is 0.01(=0.065-0.055) and 6 is 0.005 (=0.07-0.065).
Figure 2 The algorithm of computing frame intervals
Function ( ) 1 ← 0 2 ← 0 3 4 for , | | do 5 if then 6 -1 7 ← 8 end if 9 else if | | | | then 10 ← +1 11 end else if 12 else 13 𝑡 𝑡 14 ← 15 end else 16 end for
16 (a) HOTS
(b) DOTS
(c) OTS and FI
Figure 3 An example of deriving FI
Step2: Derivation of all
As mentioned before, we considered six indexes. They are the mean of frame intervals (MFI), variance of frame intervals (VFI), maximal frame interval
(MaxFI), frame no response (FNR), times of maximal frame interval (TMaxFI) and
the number of frames (NFI). In the this section, we describe how we calculated each
based on , in which .
The first index is average frame interval which is obtained by ( ) ( ) ∑ | ( )
|
| | ,
where is the index of behavior , is the index of CPU utilization and | | is the number of frames in . In addition, the function 𝑥𝑐𝑝( ), which sets the time as 10 seconds in the no response case and the larger time case, is defined as
𝑥𝑐𝑝( ) { . 0 0.01 0.02 0.03 0.04 0.05 0.06 0.07 0.08 (second)
HOTS
HOTS 0 0.01 0.02 0.03 0.04 0.05 0.06 0.07 0.08 (second)DOTS
DOTS 0 0.01 0.02 0.03 0.04 0.05 0.06 0.07 0.08 (second)OTS
HOTS DOTS -1 0.01 0.005 4 0.015 5 0.01 6 0.00517
The unit of is second. If is larger than 10 seconds, we set to 10. In order to examine how far a set of frame interval is spread out, the second index is variance, which is determined by
( ) ( ) ∑ ( 𝑥𝑐𝑝( ) ( ))
| |
| |
The third index is the maximal frame interval, which is obtained by ( ) 𝑥( ).
Since no response can significantly affect the smoothness of a smartphone, we
introduce the fourth index 4, named no response, which is defined as 4 4( ) ∑ | | ( ),
where calculates the number of frame intervals that represent no response. Similarly, the fifth index 5, maximal frame interval, which is defined as
5 5( ) ∑| | 𝑥 ( ),
where 𝑥 calculates the number of frame intervals that are larger than 10. Figure 4 show two video clips of the same file loading operation on two different
smartphones. There are five frames in the left-hand side case (Case 1) and three
frames in the right-hand side case (Case 2). Case 1 is smoother than Case 2 because
more frames are displayed during the file loading process. The sixth index 6 is the number of frame intervals, which is defined as
6 6( ) | |.
Figure 4 The factor of NFI
𝑁𝐹𝐼 5 𝑁𝐹𝐼 3
18
4.3 The Questionnaire for BQoE
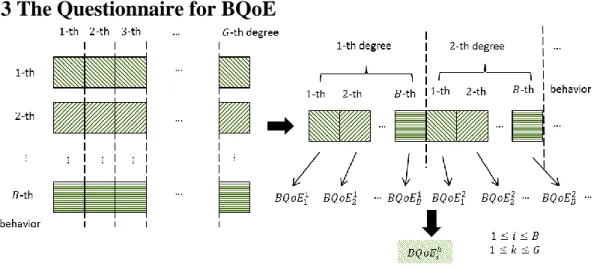
Figure 5 Idea of questionnaire
We designed a questionnaire to find the relationship between and its associated . As shows in Figure 5, for each behavior, such as browsing web pages, viewing gallery or texting messages, we prepared video clips, each of which was record under a specific CPU utilization. As a result, we have total video clips. Let denote the k-th video clip of behavior . The set of video clip { , , … , and represent the response of the applications under the lightest CPU utilization. On the other hand, the set of video clip { , , … ,and represent the response of the applications under the heaviest CPU utilization. In our
implementation, we adopted a background busy loop to generate different CPU
utilization, which is used by .
Let denote the number of volunteers and represent the r-th volunteer, in which . At the first round, we asked volunteers to evaluate the smoothness of , , … , and by answering “smooth” or “not smooth”. If
marks as “smooth”, then =1. Otherwise, we set = 0. Similarly, in the second, volunteers were asked to evaluate the smoothness of , , … , and
. We repeated the same process until all video clips were evaluated by all volunteers. As a result, we calculated the corresponding scores by
19
∑
(1)
Given all and , we used the statistic regression to find the relationship between and ; that is
4 5 6 . Finally, is determined by a weighted function , which is defined as
( ) ∑
∑ (2)
where is the weight of behavior .
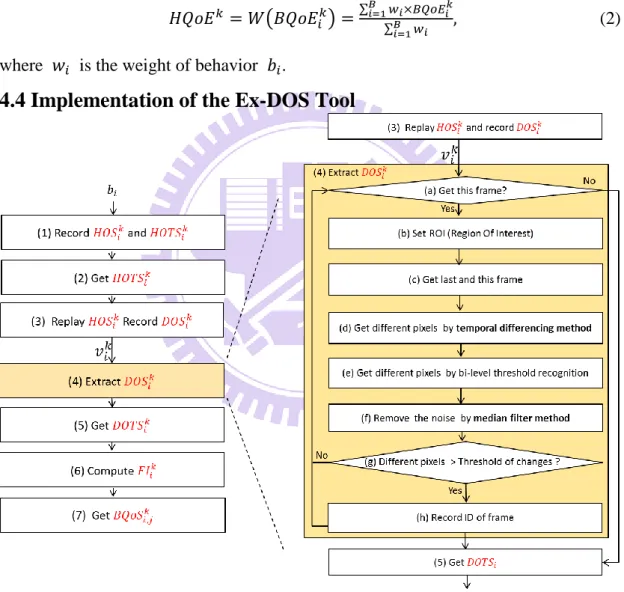
4.4 Implementation of the Ex-DOS Tool
Figure 6 The flow of acquisition of BQoS and the Ex-DOS tool
The purpose of tool Ex-DOS is to process a video clip in order to obtain its
associated . Figure 6 shows the flow of the acquisition and the position of Ex-DOS tool. For each behavior , we used Android keylogger (AKL) to
20
record user behavior so that we can obtain under the condition of the
𝑡 CPU utilization (step 1 & 2). In the replay stage, we replayed the user behavior
and adopted an external camera with 60 fps to capture the device response (step 3). The captured video was first converted into frames by Free Video to JPG Converter Tool [18] and then processed by our tool, Ex-DOS, in order
to obtain (step 4). Based on and (step 2 & 5), we extracted (step 6). Finally, based on all , we calculate each (step 7).
The right-hand side of Figure 6 shows the details of step 4, that takes as input and extracts . For each frame, we set a region of interest (ROI) (step a & b). We then got the current frame and the last frame for comparison (step c). Both
frames were converted from color frames to gray frames in order to detect the
difference. We compared pixel by pixel in two frames. If the differences of gray
levels between two pixels are larger than a predefined threshold, we marked them as
different pixels (step d). In order to further increase the speed of comparison, we
adopted bi-level threshold recognition[19] (step e). Since we adopted an external
camera to record the video, the quality of the video may be affected by the
environment such as light intensity. Some black pixels may be represented as gray
pixels. Therefore, we further adopted a medium filter to reduce the noises of each
frame (step f). Finally, if the number of different pixels was smaller than a predefined
threshold, we record the frame ID, which is the index of frames in , and derive the
time sequence . We repeat the same process until all frames have been processed (step g & h).
Figure 7 shows the three major steps of our Ex-DOS tool (numbered by 1, 2, and
21
these frames (step d-f) and obtain the different pixels. Finally, each was obtained.
In the record stage shown as Figure 6 (step 1), the AKL produced a script to
record . For each human operation in , the script recorded a batch of time and commands. Figure 8 shows an example of test script. We automatically
extracted every triggering time of human operation by detecting a specific pattern at
the end of each operation (line 72, line 76 and line 80-85 of Figure 8). In the replay
stage shown as Figure 6 (step 3), we use computer time to synchronize two different
time sequences for the purpose of deriving . One is obtained from smartphone and another is obtained from the camera. Let as the start time of the smartphone in and as the start time of the camera in . As Figure 9 shows, we first used a stopwatch to synchronize the time. However, the precision of stopwatch is
lower than the time of the smartphone. To reduce the error, we derive the by the frame rate of . For example, is the 21:33:10.11 (shown as Figure 9). We first find the time of the frame is 21:33:10 in and record the frame ID. Because the
average time of with 60 fps is about 0.016 second, we can derive the is 21:33:10.112 (21:33:10+ 0.11/0.016). We then obtained and respectively.
Figure 7 The flow of Ex-DOS tool
22
Figure 8 The acquisition of HOTS
Figure 9 The synchronization of time
𝑇𝑆𝑖𝑘
23
Chapter 5 Evaluation
In this chapter, we first introduce the experiment environment in Section 5.1.
Next, Section 5.2 illustrates the relationship between human and device operations.
Section 5.3 investigates the correlation between BQoSs and BQoE. Section 5.4
analyzes our HSER model. Finally, Section 5.5 evaluates the correctness of the HSER
model in three different smartphones.
5.1 Testbed
Our testbed includes a host PC, a Huawei U8860 smartphones with the AKL
agent and a Canon 550D camera with non-interlaced 720 lines at 60 FPS.
Common user behaviors
According the Verkasalo‘s research [20], the most used behaviors are voice
(34%), message (21%), multimedia (15%), browser (14%), games (3%), map (3%)
and other (10%) respectively. Table 4 shows the seven common types of behaviors.
Based on the seven common types of behavior, we adopted eight behaviors in our
experiment. They are making a phone call, texting messages, browsing web pages,
playing a game, viewing a map and switching between different desktops (i.e. “other”
in Table 4) respectively except the multimedia type, which is including two
commonly used behaviors, listing to music and viewing gallery; that is . The experiment environment
For each behavior , we used Android keylogger (AKL) to record of so that we can obtain under the condition of the k-th CPU utilization. In our implementation, we adopted a background busy loop control available CPU
utilization for . They are 1%, 2%, 3%, 4%, 5%, 10% and 100%; that is . The reason we choose this setting is that the CPU utilization of most operations in a
24
application always performs smoothly in the smartphones we tested.
In the replay stage shown as Figure 10, we replayed the user behavior by computer and adopted an external camera, Canon 550D camera to capture the device
response , stored in , on device under test (DUT), Huawei U8860. In order to eliminate the effect of environment such as light intensity, all experiments were
conducted in a dark box.
In the questionnaire stage, for the purpose of efficiency, we posted 56 videos on
an online website designed with PHP. Each video represents a behavior under a
specific CPU utilization. As the mentioned above, there are 8 behaviors and 7 kind of
CPU utilization. The content of videos is shown in Table 4. For example, the videos
of voice behavior under 7 kind of CPU utilization include the action of viewing the
contact and keying the phone number. To avoid the interference from another similar
video, a volunteer graded a video at a time. Each volunteer graded the videos which
are all kind of behaviors under 1-th CPU utilization with “smooth” or “non-smooth”
first and reproduce the process that grading the videos of the behaviors which were
graded with “smooth” until the videos of all behaviors are graded with “non-smooth”.
In addition, to avoid users confusing the network delay with the “non-smooth”
situation, we announced that users acted the judgement when the widgets of the frame
25
Table 4 The general operations for each behavior
Types of behavior Percentage of using time
General operations
Voice 34% View the contact Key the phone number Message 21% View the contact
Key the messages Multimedia
(music and gallery)
15% Music(7.5%):
View the song lists Change the listing song Build a playlist
Gallery(7.5%): View the photos Browser 14% View the websites
Games 3% Load a game with 2D animation
Map 3% View the map
Search the nearby places Other 10% Operate the home screen
Figure 10 The experiment environment
5.2 Relationship between HOS and DOS
Many existing work adopted the response time of an operation to evaluate the
smoothness of a smartphone. However, two operations with the same response time
may lead to different user experience because the way they change frames may be
different. One may perform smoothly in the early stage while another may perform
smoothly in the late stage. In order to investigate the relationship between HOS and
DOS, we defined as
| | | | | | ,
in which | | is the number of operations in and | | is the number of frame changes in . As Figure 11 shows, is larger than 97% in most behaviors. It implies that a behavior can induce a larger number of frame changes and the
26
response time cannot reflect every aspect of smoothness of a smartphone. As a result,
it is necessary to investigate the characteristics of frames when we determine the
smoothness of a smartphone.
Figure 11 The value of in different behaviors
5.3 Correlation between BQoSs and BQoE
Given all and , we aim to find the relationship between and ; that is
4 5 6 .
In order to reduce the complexity of , we estimate the relationship between each
. If one index can dominate another index, the dominated index will be removed. In other words, we aim to use as less indexes as possible to construct the function . In order to estimate the relationship between
each we adopted coefficient of correlation , which is determined by
∑ 𝑥 𝑥̅ ̅
√∑ 𝑥 𝑥̅ ∑ ̅
where 𝑥 presents a sample, is a sample ( ) and is the number of total samples. Table 5 shows coefficient of correlation between each
and under different functions which are linear function, logarithmic function, exponential function and power function. As Table 5 shows, logarithmic
function best fitted our data. We next investigated the logarithmic relationship among
s, and see if it is possible can reduce the number of indexes. A
97% 98% 97% 95% 95% 96% 97% 100% 3% 2% 3% 5% 5% 4% 3% 0% 0% 20% 40% 60% 80% 100%
browser gallery message music other voice map game
α
Behaviors
HOS DOS
27
correlation greater than 0.7 may produce the presence of collinearity[21] which may
lead to the large standard error. According to our results, VFI, MFI, FNR and TMaxFI
have a strong correlation with other indexes and the averages of the correlation of
them are higher than 71.5% shown as Table 6. To avoid the collinearity problem, the
final indexes used to construct the relationship are MaxFI ( and NFI ( 6 . According our result, we can derive that the situations users feel “non-smooth” are divided into the long waiting time and the fragmentary frames. For example, Nexus S smartphone need more time to process the task than Huawei U8860
smartphone in browser behavior under the general CPU utilization. However, the NFI
are almost the same, MaxFI index is good for NFI in this situation. On the other hand,
users feel “non-smooth” because of the fragmentary frames in other behavior when
available CPU utilization is reducing. In that situation, the frame interval is similar so
28
Table 5 The correlation of correlation between BQoSs and BQoE
BQoSs Correlation of BQoE
VFI Linear -0.438 Logarithmic -0.796 Exponential -0.146 Power 0.426 MFI Linear -0.390 Logarithmic -0.723 Exponential -0.142 Power -0.721 MaxFI Linear -0.494 Logarithmic -0.705 Exponential -0.101 Power -0.705 FNR Linear -0.402 Logarithmic -0.497 Exponential -0.192 Power -0.497 TMaxFI Linear -0.433 Logarithmic -0.559 Exponential -0.144 Power -0.559 NFI Linear 0.427 Logarithmic 0.546 Exponential 0.328 Power 0.546
Table 6 The correlation of correlation between BQoSs
VFI MFI MaxFI FNR TMaxFI NFI
VFI 1 MFI 0.953 1 MaxFI 0.837 0.713 1 FNR 0.800 0.819 0.573 1 TMaxFI 0.792 0.757 0.746 0.804 1 NFI -0.701 -0.841 -0.381 -0.606 -0.478 1 Average 0.817 0.817 0.65 0.720 0.715 0.601
29
5.4 Analysis of the HSER model
For the legal range of , we translate the odds ratio of with the logarithm function. Given all , 6 and , we aim to find the relationship among them; that is,
6 .
We adopted the multiple linear regressions to find logarithmic relationship. In
order to evaluate the accuracy of the regressions result, we use the coefficient of , which is obtained by
∑ ̂ ̅ ∑ ̅ ,
where ̂ is the predicted value of BQoE, is the actual value of BQoE (the questionnaire result), and is the total number of samples. closer to 1.00 is the better. As shown in Table 7, is 0.528 if all behaviors were considered together.
We further categorized behaviors into timing sensitive, which are voice, other and
gallery behaviors shown in Figure 12, and timing non-sensitive. For example, making
a phone call is a timing sensitive behavior while browsing a web page is not a timing
sensitive behavior. According to the value of , the regression performed better for
timing sensitive behaviors. We also investigate the correctness of regression for each
individual behavior. As shown in Table 7, the average is 0.872. In particular, for the behavior of viewing gallery and playing game, the is up to 0.986 and 0.973, respectively. It implies that our regression model can be used to evaluate the
30
Table 7 The R Square of the models
Type of models Regression
All behaviors 0.528 - ( ) ( ) ( 6) Sensitive-based behaviors High 0.713 0.694 ( ) 5 ( ) 3 ( 6) Low 0.675 ( ) 5 ( ) 5 ( 6) Single behavior Voice 0.813 0.872 ( ) 3 ( ) 5 ( 6) Message 0.811 ( ) 3 3 ( ) ( 6) Gallery 0.986 ( ) ( ) 3 ( 6) Music 0.951 ( ) 3 5 3 ( ) 5 55 ( 6) Browser 0.706 ( ) 5 ( ) 5 ( 6) Other 0.88 ( ) ( ) 3 ( 6) Map 0.856 ( ) 5 ( ) ( 6) Games 0.973 ( ) 3 ( ) 5 ( 6)
Figure 12 The relationship between the VFI and BQoE
0 0.2 0.4 0.6 0.8 1 0 0.2 0.4 0.6 0.8 1 1.2 B Qo E BQoS of VFI BQoE of VFI browser gallery message music other voice map
31
5.5 Evaluation of HSER model
In order to validate our HSER model of different smartphone, we conducted
another round of survey. We prepared several video clips about eight operations,
shown as Table 4, under normal CPU utilization on three different smartphones. They
are HTC hero with 2.2.1 Android platform, Huawei U8860 with 2.3 Android platform,
and Nexus S with 4.1.2 Android platform. In this survey, we had 45 volunteers to
grade each video with “smooth” or “non-smooth” and used the formula (1) and (2) to
compute the questionnaire result, denoted as , for each smartphone. The s are shown in Figure 13(a), in which Huawei U8860 is smoother than HTC hero and
Nexus S. The 95% confidence interval of each survey is also shown in Figure 13(b).
Consider that the online questionnaire have the influence of network delay, we
collected 10 volunteers to grade each video with the offline questionnaire. As a result,
the influence of the offline questionnaire results, whose ranges are in 95% confidence
interval, is lower than 10% shown in Figure 13(a). Therefore, users have good
judgment even in the circumstances with network delay. We then adopted our
regression result, shown in Table 7, to evaluate the smoothness of each smartphone.
As Figure 14 shows, the error rate, which is the error between and predicted result ( ) from our model for each smartphone, is obtained by
| | | | .
32
(a) The satisfaction of smartphones (b) The confidence interval of smartphones
Figure 13 The satisfaction and confidence interval of smartphones
Figure 14 The error rates between the models 55% 93% 80% 63% 99% 76% 0% 20% 40% 60% 80% 100% 120%
HTC hero Huawei Nexus S
R ati o o f o p in io n sc o re s (Q R ) Type of phones Online QR Offline QR 55% 93% 80% 0% 20% 40% 60% 80% 100% 120%
HTC hero Huawei Nexus S
R ati o o f o p in io n sc o re s Type of phones [ 55± 14.5% ] [ 93± 7% ] [ 80± 11.6% ] 39% 33% 33% 33% 14% 15% 9% 5% 5% 0% 10% 20% 30% 40% 50%
HTC hero Huawei Nexus S
Er ro r rate s (% ) Type of phones
33
Chapter 6 Conclusion and Future Work
In this work, we developed the handheld smoothness evaluation over regression
(HSER) model to fairly benchmark the smoothness of smartphones. We first
measured BQoS by extracting key indexes. They are the mean of frame intervals
(MFI), variance of frame intervals (VFI), maximal frame interval (MaxFI), frame no
response (FNR), times of maximal frame interval (TMaxFI) and the number of frame
intervals (NFI). Since the indexes may not always be measurable, especially when the
changes between frames are fast, we further developed a tool, named extract device
operation sequence (Ex-DOS), to obtain necessary information. Based on obtained
behavior-based smoothness quality of services (BQoS), we then designed a
questionnaire to determine the relationship between BQoS and behavior-based
smoothness quality of experience (BQoE). Finally, we converted the BQoE to
handheld smoothness QoE (HQoE) by considering how frequently each behavior is
performed in daily life.
In order to evaluate the effectiveness of the proposed method, we conducted
several experiments on three different smartphones, HTC hero, Huawei U8860 and
Nexus S. We investigated the applicability of the HSER model in different user
scenarios. Some user scenarios are timing sensitive while others are not. We validated
the correctness of the HSER model by comparing it to our questionnaire results.
According to our experiment results, the correlation of MFI, VFI, FNR and TMaxFI is
higher than 71.5% in logarithmic relationship. To avoid the collinearity problem,
MaxFI and NFI are used to be the indexes for our HSER model. MaxFI and NFI also
are good indexes for the “non-smooth” situations of the long waiting time and the
34
particular, for the behavior of viewing gallery and playing game, the is up to 0.986 and 0.973. Also, the error rate of HSER is less than 9%. It implies that our
regression model can be used to fairly evaluate the smoothness of a smartphone. In
addition, the error rate of HTC hero (9%) is higher than other two smartphones (5%).
The reason may be the variation that users grade the videos with “smooth” or
“non-smooth”. The same video for different users will get the different perception. In the future, we plan to investigate other indexes and collect more users’
experience in order to further enhance the accuracy of our model. Possible indexes
include the speed of fling and scroll operations. We also plan to improve the accuracy
35
References
[1] Dong Tian, Lansun Shen, and Zhiheng Yao, “Motion Activity Based Wireless Video Quality Perceptual Metric,” Proceedings of 2001 International Symposium on Intelligent Multimedia, Video and Speech Processing, 2001.
[2] Ruifen Xu, Mingwei Zhang, Lin Jia, and Yongli Li, “A Novel Algorithm for Video Smoothness,” Proceedings of Evaluation Advanced Computer Theory and Engineering, August 2008.
[3] Rohani Bakar, Muhammad Ibrahim, and D.M. Ali, “Performance Measurement of VoIP over WiMAX 4G Network,” Proceedings of IEEE 8th International Colloquium on Signal Processing and its Applications (CSPA), March 2012. [4] Yu-Chun Chang, Kuan-Ta Chen, Chen-Chi Wu, Chien-Ju Ho, and Chin-Laung
Lei, “Online Game QoE Evaluation using Paired Comparisons,” Proceedings of IEEE International Workshop Technical Committee on Communications Quality and Reliability (CQR), June 2010.
[5] Kuan-Ta Chen, Polly Huang, and Chin-Laung Lei, “Effect of Network Quality on Player Departure Behavior in Online Games,” Proceedings of IEEE Transactions on Parallel and Distributed Systems, May 2009.
[6] Kuan-Ta Chen, Polly Huang, Chin-Laung Lei, and Chun-Ying Huang, “Quantifying Skype User Satisfaction,” Proceedings of ACM SIGCOMM 2006, September 2006.
[7] Hyeon-Ju Yoon, “A Study on the Performance of Android Platform,” Proceedings of International Journal on Computer Science and Engineering, pp. 532–537, 2012.
[8] AnTuTu-Benchmark. [online], available from World Wide Web; https://play.google.com/store/apps/details?id=com.antutu.ABenchMark [9] SmartBench. [online], available from World Wide Web;
https://play.google.com/store/apps/details?id=com.smartbench.twelve
[10] Quantify and Optimize the User Interactions with Android* Devices. [online], available from World Wide Web;
http://software.intel.com/en-us/articles/quantify-and-optimize-the-user-interaction s-with-android-devices
[11] Miller, R. B., “Response Time in Man-computer Conversational Transactions,” Proceedings of Fall Joint Computer Conference, 1968.
[12] Jakob Nielsen, “Usability Engineering,” published by Morgan Kaufmann, San Francisco, 1993.
36
http://developer.android.com/training/articles/perf-anr.html
[14] Screencast Video Recorder Demo. [online], available from World Wide Web; https://play.google.com/store/apps/details?id=com.ms.screencastfree
[15] Chung-You Wei, Jen-Wei Hsieh, Tei-Wei Kuo, I-Hsiang Lee, Yian-Nien Wu, and Mei-Chin Tsai, “Resource Reservation and Enforcement for
Framebuffer-Based Devices,” Proceedings of Ninth International Conference on Real-Time and Embedded Computing Systems and Applications, 2003.
[16] Yu-Chun Chang, Kuan-Ta Chen, Chen-Chi Wu and Chin-Laung Lei, “A Crowdsourceable QoE Evaluation Framework for Multimedia Content,” Proceedings of ACM Multimedia, October 2009.
[17] Android keylogger (AKL). [online], available from World Wide Web; http://www.ebl.org.tw/.
[18] Free Video to JPG Converter Tool. [online], available from World Wide Web; http://www.dvdvideosoft.com/products/dvd/Free-Video-to-JPG-Converter.htm [19] Nikhil R Pal and Sankar K Pal, “A review on image segmentation techniques,”
Pattern Recognition 26 (1993) 1277–1294.
[20] H. Verkasalo, “Analysis of Smartphone User Behavior,” Proceedings of IEEE 2010 Ninth International Conference on Mobile Business and 2010 Ninth Global Mobility Roundtable (ICMB-GMR), 2010.
[21] Odewale J.O., Agho Collins, Ataga C.D., Odiowaya G., Hamza A., Uwadiae E.O. and Ahanon M.J., “Study of Some Fruit and Seed Traits Relationship and Assessment of Multicollinearity in Date Palm (Phoenix Dactylifera L) Accessions of Nigeria by Correlation and Principal Component Analysis, ” Proceedings of
Greener Journal of Agricultural Sciences, ISSN: 2276-7770 Vol. 3 (2), pp.