行政院國家科學委員會專題研究計畫 期中進度報告
子計畫三:應用自動圖資與專家系統於用戶停電電話處理系
統及重點用戶復電策略(2/3)
計畫類別: 整合型計畫
計畫編號: NSC92-2213-E-151-002-
執行期間: 92 年 08 月 01 日至 93 年 07 月 31 日
執行單位: 國立高雄應用科技大學電機工程系
計畫主持人: 林嘉宏
計畫參與人員: 葉芳俊,李鐘生,何姿瑩
報告類型: 精簡報告
處理方式: 本計畫可公開查詢
中 華 民 國 93 年 5 月 26 日
行政院國家科學委員會補助專題研究計畫
□ 成 果 報 告
;期中進度報告
配電系統運轉規劃策略研究-子計畫三:應用自動圖資與專家系統於
用戶停電電話處理系統及重點用戶復電策略(2/3)
計畫類別:□ 個別型計畫
;
整合型計畫
計畫編號:NSC 92-2213-E -151-002-
執行期間:2003 年 08 月 01 日至 2004 年 07 月 31 日
計畫主持人:
林嘉宏
共同主持人:
計畫參與人員:
葉芳俊 高雄應用科技大學電機工程系
李鐘生
高雄應用科技大學電機工程系
何姿瑩 高苑技術學院電機工程系
成果報告類型(依經費核定清單規定繳交):
;
精簡報告 □完整報告
本成果報告包括以下應繳交之附件:
□赴國外出差或研習心得報告一份
□赴大陸地區出差或研習心得報告一份
□出席國際學術會議心得報告及發表之論文各一份
□國際合作研究計畫國外研究報告書一份
處理方式:除產學合作研究計畫、提升產業技術及人才培育研究計畫、
列管計畫及下列情形者外,得立即公開查詢
□涉及專利或其他智慧財產權,□一年□二年後可公開查詢
執行單位:
高雄應用科技大學電機工程系
中 華 民 國 93 年 05 月 01 日
行政院國家科學委員會專題研究計畫期中進度報告
配電系統運轉規劃策略研究-子計畫三:應用自動圖資與專家系統於
用戶停電電話處理系統及重點用戶復電策略(2/3)
The Application of AM/FM and Expert System for Trouble Call Analysis and Restoration
Strategy Considering Key Customers
計畫編號:
NSC 92-2213-E -151-002-
執行期限:92 年 8 月 1 日至 93 年 7 月 31 日
主持人:林嘉宏 高雄應用科技大學電機工程系
計畫參與人員:葉芳俊 高雄應用科技大學電機工程系
計畫參與人員:
李鐘生
高雄應用科技大學電機工程系
計畫參與人員:何姿瑩 高苑技術學院電機工程
Abstract--A knowledge based trouble call system with colored Petri net (CPN) inference models is designed to identify the most probable faulted device for trouble call analysis (TCA) of distribution systems. The CPN model for inference engine considers two major parts: the traditional escalation method and the load comparison method. To identify the faulted device more accurately according to the outage reports by service customers, the searching procedures based on the improved escalation method are included in the best first search of the CPN. The most possible outage locations with corresponding blown out protective device are determined by applying parallel-like reasoning in the CPN to solve multiple fault events simultaneously. One of the distribution systems in Taiwan Power Company (Taipower) with 36000 customers is selected for computer simulation to demonstrate the effectiveness of the proposed methodology to enhance the function of distribution outage management.
Index Terms— Trouble call analysis, Colored Petri net,
Distribution automation system.
I. INTRODUCTION
With the advancement and application of computer control systems, unreliable power supply can be extremely costly to electric utilities and their customers. To improve system reliability and operation efficiency, a distribution automation system (DAS) has been implemented by Taipower since 1998. With TCA as one of ten functions, the outage duration of customers caused by system faults can be reduced by identifying the faulted device more accurately for repair crews to expedite power restoration. Besides, the outage information can be retrieved by distribution system operators so that proper load transfer can be taken for service restoration. With deregulation of power industry, it becomes important for utility companies to enhance service quality so that more customers can be kept in the competitive marketplace.
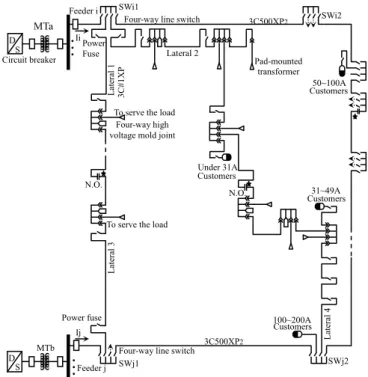
With a fault on the primary feeder of an underground distribution system in Fig. 1, the feeder circuit breaker will be tripped by over-current relays. System dispatchers can diagnose the contingency by SCADA system according to the status change of the circuit breaker and protective relays at switches along the feeder. After detecting the fault location, the boundary load breakers of 4-way line switches are opened to isolate the fault section. The feeder circuit
customers. After that, the proper switching operation plan is derived by considering the capacity reserve and operation constraints so that the downstream unfaulted but out of service area can be transferred to the other feeders. With the DAS system, the fault detection, isolation and service restoration (FDIR) can be completed within 3 to 5 minutes in Taipower.
With more than 80% of faults in Taipower distribution system on the lateral or customer sides, the blown fuse at the source size of lateral or distribution transformers will interrupt power service of the affected customers. It is still not cost justified for system operators to identify this type of fault by DAS systems because so many fault indicators and communication systems have to be installed and the affected area is much serious faults on main feeders. After receiving phone calls from customers to report the power outage, repair crews are sent out to do the field check to locate fault locations. It is very difficult and time consuming to identify faulted devices and complete service restoration
Fig. 1. A typical underground distribution system of Taipower. To serve the load
D S D S MTa Feeder i SWi1
Four-way line switch 3C500XP2 Power Fuse La te ra l 1 3C#1XP
To serve the load Four-way high voltage mold joint
La te ra l 3 Lateral 2 50~100A Customers SWi2 31~49A Customers 100~200A Customers Under 31A Customers N.O. 3C500XP2 Four-way line switch Feeder j SWj1 Power fuse Ij Ii SWj2 La te ra l 4 N.O. MTb Pad-mounted transformer Circuit breaker
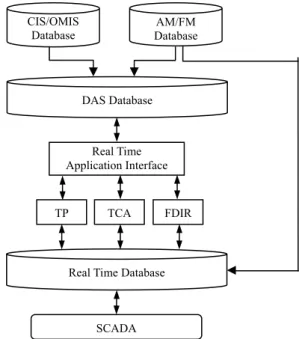
Fig. 3. The DAS database and application software for trouble call analysis
for an underground distribution systems. To solve the problem, a geographic based digital mapping system has been created for the DAS system to include system network connectivity and service customers with account number, telephone number, address and the distribution transformer connected. With so many protective devices and voluminous customers involved in distribution systems, system dispatchers have to identify the most probable protective device out of service for dispatching crews to fix the problem. To expedite the searching procedures, an efficient inference tool has to be developed to support TCA function by considering the knowledge base of distribution systems. Petri-Net (PN) is a powerful inference mechanism and has been successfully applied in the areas of service restoration scheduling [1] [2], fault section estimation [3], rule-based evaluation [4] and power system protection [5] [6]. With graphic representation, PN simulates the system operation by including their timing and sequence of physical objects. The knowledge and network configuration of distribution systems can be expressed systematically through a structured model with parallelism and synchronization [1].
In this project, the knowledge based trouble call system with colored Petri net (CPN) models is proposed to derive the TCA for Taipower distribution system. The CPN is applied to model the inference net to support decision making process by considering system topology and the change of feeder loading due to faults. When a permanent fault occurs, the knowledge to identify out-of-service areas is obtained by the searching procedures and system database. With the knowledge base and its parallel-like inference engines, the CPN can find the most probable outaged devices for system faults.
II. DESIGN OF THE KNOWLEDGE BASED TROUBLE CALL
SYSTEM
To enhance the TCA function for reasoning process so that the fault locations can be identified more efficiently, the proposed knowledge based system as shown in Fig. 2 is proposed in the project.
The knowledge base comprises the information retrieved from DAS database, system configuration by topology processor (TP), and searching procedures. The DAS database stores the geographic locations, attributes and connectivity records of distribution system components and customers. According to the connectivity records and dynamic statuses of switching devices, which have been retrieved from the real time SCADA system, TP is executed to determine system network configuration for inference
engine to process the trouble call analysis. The distribution system operation rules are included in the heuristic search to support deriving fault locations. The inference engine of high level CPN model is applied to find the most possible faulted devices and their locations. With the distribution system configuration and customer database, the searching procedures can estimate the switching devices which have been operated for fault clearance according to outage reports by the customer. The man-machine interface (MMI) provides the tools for operators to update the database and operation rules.
A. Distribution Automation System Database
Fig. 3 shows the SCADA and DAS database for real time application of TCA, TP and fault restoration. The DAS database consists of the information retrieved from the customer information system (CIS), outage management system (OMS) and automated mapping and facility management system (AM/FM). The customers served by distribution transformers within each service zone are identified. The transformers with protective fuses are connected to the laterals in Fig. 1. By retrieving the power consumption of customers from the CIS system, the hourly loadings of each customer and distribution transformer can be derived and power flow of each protective device can be estimated.
According to outage reports from the customers in out of service areas, the TCA system will identify the faulted feeder and retrieve the change of feeder loading levels from the real time database of the SCADA system. By comparing the change of feeder loading to the power flow of upstream protective devices, the most probable fault location can be obtained. With the facility information with topological graphic structure, the distribution system configuration is modeled to support the TCA function.
AM/FM Database CIS/OMIS Database DAS Database Real Time Application Interface TP FDIR
Real Time Database
SCADA TCA Knowledge base Inference engine (CPN) Man-machine interface Searching procedures Outage report DAS database
Fig. 2. The proposed knowledge based trouble call system
B. Topology Processor
Topology processor is to identify the network configuration based on the attributes of distribution connectivity model and dynamic switch statuses in DAS database. By tracing the FROM and TO fields of connectivity table which points to the upstream and downstream devices of each component, the system network configuration is determined and updated according to the operation of switching devices.
A distribution system component can be categorized as either branch or node. A branch is any device with two terminals such as line sections, switches, transformers, etc., while a node is the electricity point that connects several branch devices together. The topology process is executed by starting from a given node or a branch and continues until either an open tie switch is reached or all devices have been completely traced.
C. Searching Procedures for Trouble Call Analysis
The searching procedures for TCA are included in the colored Petri net model by considering the operation rules to handle the customer trouble calls in Taipower. The TCA consists of the connectivity tracing stage (CTS) and load comparing stage (LCS). Since the tripping of any upstream protective device will result in service outage of all customers in the downstream service zones, the CTS is to identify all upstream protective devices from the customers who have made the trouble calls. The LCS is to make comparison of loading reduction of faulted feeder and the load estimation of de-energized service zones with trouble calls.
To comply with the distribution system operation regulation for TCA, the following heuristic search steps are exploited in the CTS process.
Step 1. Determine distribution system configuration by
connectivity trace with a node-link scheme as described in Section B. The results of connectivity trace are stored in the connectivity table with corresponding attribute of elements in the DAS database. The system is therefore represented as a network with tree graph to determine the scope of distribution systems. The node reduction process has been executed to minimize the size of system model.
Step 2. With topology process in Step 1, a binary integer
matrix LR is created to represent the connectivity of protective devices and service zones.
A sample system in Fig. 4 is used to illustrate the process of determining the elements in the matrix LR. Based on the radial network structure and locations of protective devices, the entries of matrix LR can be determined as (1).
⎥ ⎥ ⎥ ⎥ ⎥ ⎥ ⎥ ⎥ ⎥ ⎦ ⎤ ⎢ ⎢ ⎢ ⎢ ⎢ ⎢ ⎢ ⎢ ⎢ ⎣ ⎡ = 1 0 0 1 1 1 1 0 1 1 0 1 1 1 0 0 1 0 1 1 1 0 0 0 1 1 1 1 0 0 0 0 1 1 1 0 0 0 0 0 1 1 0 0 0 0 0 0 1 7 6 5 4 3 2 1 SZ SZ SZ SZ SZ SZ SZ LR P P P P P P P 1 2 3 4 5 6 7 (1)
where SZ and P are the set of service zone groups and the set of protective devices, respectively. For the element LRij
with value 1, the trouble call from customers in service zone
SZi will be made if the jth protective device Pj is operated.
On the other hand, for element LRij with value 0, the
operation of protective device j will not cause the ith service zone SZi to be de-energized. Therefore, LR can reflect not
only the connectivity between the protective devices and service zones, but also the color settings of Petri net models for trouble call analysis.
Step 3. According to the trouble calls made by outaged
customers, the most possible fault location is estimated by searching customer geographic locations and tracing the network connectivity. The common points of connectivity in the upstream path from the locations of the callers will provide the possible protective devices for several crews to check and repaired.
With the structure of matrix LR in (1) for the sample distribution system in Fig. 4, trouble calls from service zones SZ5 and SZ7 will result in the tracing processes by the
escalation method as follows:
Set1= {SZ5→P5→P3→P2→P1}
Set2= {SZ7→P7→P4→P3→P2→P1}
From the above escalation paths, the intersection operation is implemented on sets Set1 and Set2 to identify the common path for upstream protective devices as follow.
P3→P2→P1
The probable outage device is suggested as P3, P2, or P1
Step 4. To deal with trouble calls for multiple outage
Main Feeder j
Main Feeder i
Substation D
S
Fig. 4. Sample underground distribution system.
FCBi FCBj MCB1 MCB2 Lateral P1 P2 P3 P4 P5 P6 P7 SZ1 SZ2 SZ3 SZ7 SZ4 SZ5 SZ6 : Four-way switch : Service zone : Protective device
problem, the outage escalation method is used to search the location of each caller until the first common protective device is reached. The multiple possible faulted devices will be the combinations of probable outage devices instead of the first common protective device.
For the above example, the tracing processes are repeated by the escalation method as follows:
Set3= {SZ5→P5→P3}
Set4= {SZ7→P7→P4→P3}
By investigating Set3 and Set4, the possible outage devices are determined as combinations of (P5, P7) and (P5, P4).
Step 5. For any additional trouble call, the processes in Step 3 and Step 4 are repeated until the most possible
fault point has been identified. By this way, the confidence level of faulted device can be improved with sufficient number of trouble calls.
In order to determine the most possible outage device, it is necessary to estimate the load current of associated service zones connected to each possible outage device. It is very tedious and impractical to solve the load estimation by conventional load flow analysis because of so many combinations of all associated service zones involved. The quick load estimation SL of service zone i by (2) is applied in this project by assuming the conforming loads for all customers. phase c b,or a, p TC TC I SL N i p i p i p FD p i = ⎟ ⎟ ⎟ ⎟ ⎠ ⎞ ⎜ ⎜ ⎜ ⎜ ⎝ ⎛ ⋅ = ∑ =1 (2) where p FD
I : actual feeder phase loading before outage,
p i
TC : total rated capacities of transformers within service zone i for phase p,
N: total number of service zones.
The following heuristic search steps are applied in the LCS process.
Step 6. Sum of load estimations of service zones for the
possible outage device k is calculated for each phase, ∑ = = n i p i p k SL I 1 (3)
Step 7. Retrieve phase currents of feeder loading before and
after trouble call from the SCADA system for the calculation of current change in (4).
p bef p aft p FD I I I = − ∆ (4)
Step 8. Solve the mismatch of loading estimation by (5).
(
) (
2) (
2 c)
2 FD c k b FD b k a FD a k k I I I I I I LD = −∆ + −∆ + −∆ ∆ (5)Step 9. Select the device i which will result in the minimum
mismatch as the most possible fault device.
III. THE INFERENCE MECHANISM OF THE COLORED PETRI
NET MODEL
In this project, a high-level CPN model [7] is used for the
determination of the most possible outage device. The place nodes (PL) represent the conditions and the transition nodes (TR) represent the events for state transitions of the study system. The CPN inference is performed by the tokens and colors passing from the system initial state to the final state. The TR node will be activated if the guard function of the enabled TR node is evaluated to be true. The tokens are then passed from the entering places to the outgoing places. For CPN inference mechanism, many tokens and colors may exist to result in the activation of several TR nodes at the same time. Therefore, these tokens and colors passing can be processed simultaneously to achieve parallel-like inference mechanism.
The CPN inference models have been proposed [8] by the authors to solve the proper switching operation for distribution system fault restoration. A totally different CPN model has been designed with new searching algorithm to assist the trouble call analysis function by considering the relationship of customer service zones and protective devices.
A. The Colored Petri Net Model for a Service Zone
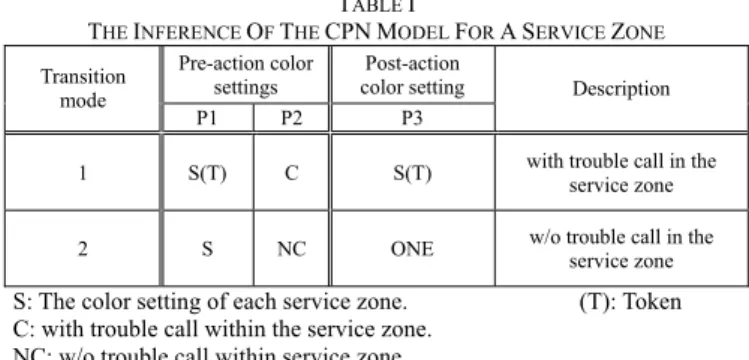
The proposed CPN model for a service zone of distribution systems is illustrated in Fig. 5. There are 3 PL nodes (P1, P2, and P3) and 1 TR node (T1). P1 represents the connectivity between the service zone and each protective device. The color setting of P1 is determined by matrix LR in the heuristic search Step 2. The color setting of P2 is defined by outaged customers in a service zone. The TR node is embedded with operation rules to decide the status transfer of P1, P2, and P3. The inference mechanism for transition nodes and place nodes is illustrated in Table I. The inference of transition mode 1 is to pass the color setting and token of P1 to P3 with the trouble calls of customers in the service zone. Mode 2 is applied to pass a non-calling color setting to P3 if no trouble call has been made by customers in the service zone. The non-calling color setting is ONE if all the row elements for the service zone in matrix LR are 1.
TABLE I
THE INFERENCE OF THE CPNMODEL FOR ASERVICE ZONE
Pre-action color
settings color setting Post-action Transition
mode
P1 P2 P3
Description 1 S(T) C S(T) with trouble call in the service zone 2 S NC ONE w/o trouble call in the service zone
S: The color setting of each service zone. (T): Token C: with trouble call within the service zone.
NC: w/o trouble call within service zone.
Suppose there are two customers to report the service outages for the sample distribution system in Fig. 4,
P1
Fig. 5. The colored Petri net model for a service zone P2
T1 P3
customer 1 in service zone SZ5 and customer 2 in service
zone SZ7. The inference of CPN model for 7 service zones
is illustrated in Table II.
TABLE II
THE INFERENCE OF THE CPNMODEL FOR THE SAMPLE DISTRIBUTION SYSTEM
The pre-action color
settings of place nodes settings of place nodes The post-action color Service zone P1 P2 P3 P1 P2 P3 Transition mode SZ1 1000000 NC 1111111 1000000 NC 1111111 2 SZ2 1100000 NC 1111111 1100000 NC 1111111 2 SZ3 1110000 NC 1111111 1110000 NC 1111111 2 SZ4 1111000 NC 1111111 1111000 NC 1111111 2 SZ5 1110100(T) C 1111111 1110100 C 1110100(T) 1 SZ6 1110110 NC 1111111 1110110 NC 1111111 2 SZ7 1111001(T) C 1111111 1111001 C 1111001(T) 1
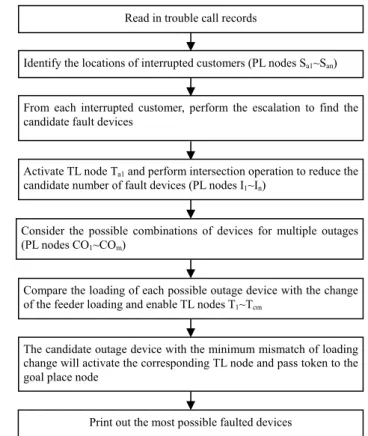
B. The CPN Inference Model for Searching the Most Possible Outage Devices
Fig. 6 shows the CPN inference model for searching the most possible outage devices. The color settings of PL nodes (Sa1~San) with service interruption reports are
determined by the inference of CPN model for a service zone in Table I. To solve the intersection operation in Step 3, the AND operation is executed for color settings of Sa1~San
of all service zones in the feeder as defined by (6).
an a
a S S
S1∩ 2∩L∩ (6)
For the CPN inference model in Fig. 6, all color settings of Sa1~Sa7 are ONE except SZ5 and SZ7 in Table II. The
common protective devices are determined as follows:
P1 P2 P3 P4 P5 P6 P7 ∩ 1 1 1 1 1 1 1 1 1 1 1 1 1 1 1 1 1 1 1 1 1 1 1 1 1 1 1 1 1 1 1 0 1 0 0 1 1 1 1 1 1 1 1 1 1 1 0 0 1 1 1 1 0 0 0 0
By executing the intersection (AND) operation and activating the TR node T1, the candidate outage devices (the
color settings of PL nodes I1~In) in common path are
determined. Besides, multiple device outages are also considered in the CPN model. In Step 4, the combinations
of possible outage devices (the color settings of PL nodes CO1~COm) are obtained by escalating from the location of
each caller to the first common protective device after intersection operation. In the example, the possible outage devices are P1, P2, and P3 and the combination of (P5, P4)
and (P5, P7) are considered for the possible multiple outages.
In Fig. 6, the PL node FD represents the feeder with trouble calls. The most possible outage device is determined by comparing the load estimation of service zones to the change of feeder loading in Step 8. The PL nodes (I1~In or
CO1~COm) which has the minimum mismatch will activate
its corresponding TR node among T1~Tcm and pass the
token to the corresponding goal PL node. Fig. 7 shows the inference process of the CPN model in Fig. 6.
For the proposed CPN model, the numbers of place nodes SPL, transition nodes STR, and directed arcs SARC in a
feeder can be obtained by (7), (8), and (9) respectively.
PD LT SZ PL S S S S = 3 + + (7) LT SZ TR S S S = +2 (8) PD LT SZ ARC S S S S =4 +2 + (9) where SZ
S : number of service zones.
LT
S : number of laterals.
PD
S : number of protective devices.
Sa1 San
I1 In CO1 COm FD
P1 Pn CP1 CPm
Ta1
T1 Tn Tc1 Tcm
Goal place nodes
Fig. 6 The CPN inference model for searching the most possible outage device
Read in trouble call records
Identify the locations of interrupted customers (PL nodes Sa1~San)
From each interrupted customer, perform the escalation to find the candidate fault devices
Activate TL node Ta1 and perform intersection operation to reduce the
candidate number of fault devices (PL nodes I1~In)
Consider the possible combinations of devices for multiple outages (PL nodes CO1~COm)
Compare the loading of each possible outage device with the change of the feeder loading and enable TL nodes T1~Tcm
Print out the most possible faulted devices
The candidate outage device with the minimum mismatch of loading change will activate the corresponding TL node and pass token to the goal place node
IV. PRACTICALSYSTEMSTUDY
To demonstrate the effectiveness of the proposed methodology to enhance trouble call analysis, an underground distribution system served by Tzyou Substation of Taipower is selected for computer simulation. Fig. 8 shows the partial diagram of the system with 3 main transformers, 18 primary feeders, 328 laterals, 379 service zones, and 362 protective devices to serve 36000 customers. To represent the distribution system by the proposed CPN model, 1827 PL nodes, 1035 TR nodes and 2534 directed arcs are created. In this project, a computer program is written in CLIPS and run on a personal computer Pentium-III 800 MHz to simulate the trouble call analysis with the proposed CPN model.
Case 1: Single Fault
A fault event is assumed to occur on the protective device P611 of Fig. 8 and two customers in service zones Z572 and Z609 have reported the service outage. Fig. 9 shows the locations of the above two customers with the associated candidate protective device sets and the intersection of these two sets generated by the proposed CPN model. It is found that there are two possible operated protective devices (P611 and P613) in the intersection set for the single fault. Besides, ten
combinations of [(P607,P578)(P607,P560)(P607,P576)(P607,P574)(P60
7,P573)(P610,P578)(P610,P560)(P610,P576)(P610,P57 4)(P610,P573)] are considered for the multiple operated protective devices.
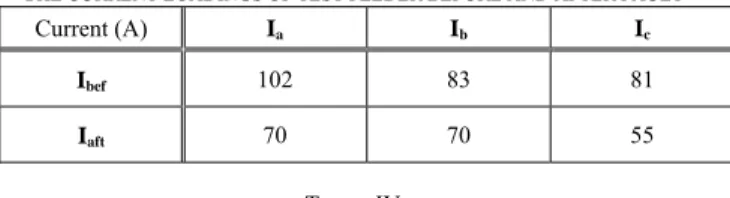
Table III shows the phase current loadings of the feeder, which have been collected by the SCADA system before and after system fault. By comparing the load estimation of service zones for the possible outage devices and the change of feeder loading (searching steps 6~9 in Section II-C) in Table IV, the mismatches of loading estimation for protective devices P613 and P611 are 16.5 and 14.6 respectively. With such a small difference of ∆LD, both P613 and P611 will be selected as the most probable faulted devices. According to the restoration rules in Taipower, the downstream protective device P611 will be checked first for fault
BF1 B2 B1 MT1 Tzyou 183 435 422 432 427 434 426 433 423 420 421 419 418 416 655 651 654 653 650 647 649 557 613 585 554 553 544 538 534 518 516 515 517 532 51 1 509 508 473 471 470 472 486 490 487 507 506 505 502 504 501 503 498 527 528 525 526 465 466 454 457 456 455 543 542 453 450 451 452 449 10 165 CB51 60 51 448 551 552 549 550 440 438 436 437 535 536 497 547 445 443 444 520 442 478 488 485 476 484 483 475 512 468 537 540 541 458 459 582 599 598 61 1 578 560 574 573 572 576 577 586 588 587 584 580 579 583 595 594 592 591 558 610 609 608 607 562 564 563 561 569 642 635 638 627 629 628 616 615 614 637 623 639 617 618 606 596 626 299 266 262 300 428 489 668 660 CB52 CB53 CB55 421 597 575 571
Fig.8 The one-line diagram of Taipower distribution system.
Z 617 Z 582 Z596 P5 99 Z 598 P61 1 P5 78 P5 60 P5 74 P5 73 Z 572 P5 76 Z575 Z577 Z571 P586 P5 88 z5 87 Z585 Z 584 P5 80 Z 579 P583 P597 P5 95 Z 594 P5 92 Z 591 Z 558 P6 10 Z 609 Z606 P608 P6 07 P562 P5 64 Z 563 Z561 P6 42 P6 35 P6 38 Z639 P627 P6 29 Z 628 Z626 P616 P6 15 Z 614 P618 Z623 P6 13 Z 637 Z 569 P60
Fig.9 The customer locations and the possible candidate operated protective devices
Customer 1 escalation path Customer 2 escalation path Intersection path
identification.
TABLE III
THE CURRENT LOADINGS OF TEST FEEDER BEFORE AND AFTER FAULT
Current (A) Ia Ib Ic
Ibef 102 83 81
Iaft 70 70 55
TABLE IV
MISMATCH OF LOADING ESTIMATION OF SERVICE ZONES AND FEEDER LOADING CHANGE FOR POSSIBLE OUTAGE DEVICES
Switchgear Room Protective device ΔLD
GD9690 P613 16.5 GD9692 P611 14.6 BD1466, GC2100 P607, P578 46.3 BD1466, FB9285 P607, P560 49.3 BD1466, EB9300 P607, P576 55.6 BD1466, FA4761 P607, P574 56.4 BD1466, FA6600 P607, P573 58.4 BD1690, GC2100 P610, P578 47.7 BD1690, FB9285 P610, P560 50.7 BD1690, EB9300 P610, P576 56.8 BD1690, FA4761 P610, P574 57.5 BD1690, FA6600 P610, P573 59.6
Case 2: Multiple Faults
For a large scale power outage of distribution systems caused by flood or storm damage, many trouble calls will be made by customers within 8 service zones in Fig. 10. The most possible faulted devices derived by both traditional TCA algorithm and the proposed method are presented. By the traditional escalation algorithm, the outage location will be escalated to fuses P578, P611, and P613. However, the proposed method as shown in Fig. 10 will report the outages at their lower levers of distribution system with four independent outages (fuses P560, P580, P583, and P586).
The incorrect identification of outage devices with over-escalation by the traditional algorithm may cause time delay to locate the faulted device for service restoration. On the other hand, the proposed CPN algorithm can predict the faulted device more effectively by considering system network connectivity and the comparison of load estimation of possible outage service zones and loading change of the faulted feeder.
V. CONCLUSIONS
In this project, a knowledge based outage management system with the associated CPN inference model has been developed to enhance the trouble call analysis. The most possible faulted devices are identified efficiently so that the power service of affected customers can be restored with less outage duration. By executing the topology process, the system network configuration is identified and updated according to the operation of line switches and
CPN inference model, the proposed methodology can locate the faulted devices by considering the loading estimation of service zones and the change of actual feeder loading. The searching procedures have been included in the CPN model for inference mechanism so that the trouble call analysis can comply with the operation regulation. By the searching procedures with parallel-like inference capability, the CPN has been applied successfully to improve the identification of possible outage protective devices for fault isolation and service restoration of distribution systems can be enhanced. To demonstrate the effectiveness of the proposed CPN based trouble call analysis, a practical distribution system in Taipower has been selected for computer simulation. It is found that the trouble call system can identify the outage location very efficiently by the CPN inference mechanism for both the small and large scale outage problems.
VI. REFERENCE
[1]. Jaw-Shyang Wu, Chen-Ching Liu, Kan-Lee Liou, and Ron F. Chu, "A petri net algorithm for scheduling of generic restoration actions, " IEEE Trans. on Power Syst., vol. 12, no. 1, pp. 69-75, Feb. 1997.
[2]. Jaw-Shyang Wu, "A petri-net algorithm for multiple contingencies of distribution system operation, " IEEE Trans. on Power Syst., vol. 13, no. 3, pp. 1164-1171, Aug. 1998.
[3]. C.L. Yang, A. Yokoyama, et al., "Fault section estimation of power system using color time petri nets, " Proc. of Expert System Application to Power Systems, pp. 321-326, 1993. [4]. K. Tomsovic, "Evaluation rule-based systems, " Proc. of Expert
System Application to Power Systems, pp. 2.1-2.3, 1988. [5]. L. Jenkins and H.P. Khincha, "Deterministic and stochastic petri
net models of protection schemes, " IEEE Trans. on Power Delivery, vol. 7, no. 1, pp. 84-90, Jan. 1992.
[6]. F. Wang and J. Tang, "Modeling of a transmission line protection relaying scheme using petri nets, " 96 WM 022-4 PWRD, IEEE/PES Winter Meeting, Jan. 21-25, 1996 Baltimore, Maryland, USA.
[7]. K. Jensen, Colored Petri Nets-Basic Concepts, Analysis Methods and Practice Use, Berlin, Germany: Springer-Verlag, 1992, vol. 1.
[8]. Chao-Shun Chen, Chia-Hung Lin, and Hung-Ying Tsai "A rule-based expert system with colored Petri net models for distribution system service restoration, " IEEE Trans. on Power Syst., vol. 17, no. 4, pp. 1073-1080, Nov. 2002.
P5 76 P5 88 Z 582
Fig. 10 The service interruption and candidate operated protective devices for case 2. Z596 P5 99 Z 598 P61 1 P5 78 P5 60 P5 74 P5 73 Z 572 Z575 Z577 Z571 P586 z5 87 Z585 Z 584 P5 80 Z 579 P583 P597 P5 95 Z 594 P5 92 Z 591 Z 558 P6 10 Z 609 Z606 P608 P607 P562 P5 64 Z 563 Z561 P6 42 P6 35 P6 38 Z639 P627 P6 29 Z 628 Z626 P616 P6 15 Z 614 P618 Z 617 Z623 P6 13 Z 637 Z 569 P60
To higher level feeder circuit breaker
Correct identification of outage devices by proposed algorithm
Incorrect identification of outage devices by traditional escalated algorithm