Received May 5, 2003 Address for correspondence: DAR-ZEN CHEN
Department of Mechanical Engineering, National Taiwan University
Constructing a patent citation map
using bibliographic coupling:
A study of Taiwan’s high-tech companies
MU-HSUAN HUANG,a LI-YUN CHIANG,a DAR-ZEN CHEN ba Department of Library and Information Science, National Taiwan University, Taipei (Taiwan), bDepartment of Mechanical Engineering, National Taiwan University, Taipei (Taiwan)
This paper uses bibliographic coupling analysis to plot out a patent citation map. It explores the current research and development in the high-tech electronic companies in Taiwan, and the relationship between companies and industries. Fifty-eight high-tech electronic companies under this study, between 1998 and 2000, obtained 4,162 patents from U.S., and cited 24,852 patents during these years. Through the data from bibliographic coupling analysis, the paper categorizes these companies into 6 major groups: semiconductor, peripheral, scanner, notebook / monitor, system, IC design / packaging. This research also uses multidimensional scaling to plot out a patent citation map, graphically displaying the association among the groups. The result shows a higher similarity among companies in semiconductor sector, whereas the distinction between industries grows more and more ambivalent, even overlapping in some cases.
Introduction
Patent information is one of the most crucial sources of key technologies for industry research and development. It is also important assets for companies in the knowledge economy. Major multinational companies all over the world emphasize the usage and access of patent information. For example, Canon prefers R&D staff to propose patent invention, rather than drafting technical research reports, and encourage them to study patent official gazettes instead of academic publications. The reason for such emphasis is that patent gazettes reveal over 90% of research result for the patents, while more than 80% of information is not enclosed in academic theses and publications. On top of that, patent information contains the most up-to-date and commercially feasible technologies. That is why patent information is a very useful tool in understanding industrial trends and serves as important reference for setting development directions.1
IT industry is always viewed as the mainstream force of Taiwan’s high-tech industries, of which the software sector already reached 470 billion US dollars in value in year 2000, ranking fourth globally,2 bringing Taiwan forward as a very important IT
powerhouse. However, although IT industry is considered important in Taiwan’s high-tech development, its domain has yet to be clearly defined. Even in the several important IT-related institutions, the classifications are not uniform. That is, the distinctions and divisions in high-tech industries are very complex. An example is electronic manufacturing industry, which includes upstream, mid-stream, and downstream of the supply chain. And even the upstream semiconductor sector has different sectors in its own supply chains, each affecting the other without overlapping.3
Based on the data in our study, IT industry can be categorized into products, industry, and technology sectors. And the product sector also includes sub-groups of product, industry, and technology. Similarly, in the product sector, Industrial Technology Research Institute (ITRI) and Institute for Information Industry (III) divide it into monitor, notebook computer, motherboard, case, scanner, multimedia, keyboard, mouse, Internet-related products, wireless, IC design, IC manufacturing, IT packaging, IC testing, optical components, optical communication, etc. Science Park Administration of Taiwan divides IT industry into computer and peripheral, communication, semiconductors, and optical sectors. As of technology sector, Ministry of Economic Affair Department of Industrial Technology of Taiwan groups IT industry into information technology, semiconductor, optical technology, communication technology, and consumer electronic technology.4 These classifications show that,
whether from product, industry, or technology as the classifying base, the results are very similar. The variation is probably due to the different functions or administrative directions. This research looks into the top 1,000 manufacturers in Taiwan, and chooses the electronic related industries as the research subjects, including four major industries: IT, electronics, semiconductor, and communication.
Statistics from Intellectual Property Office5 in Taiwan show that the companies with
more issued patents, such as Taiwan Semiconductor Manufacturing Co. (TSMC), Hon Hai Precision Industry Company, United Micro Electronics Corp. (UMC), Macronix International Company, etc. are predominantly electronic and IT companies, indicating the field’s high reliance upon technology and the close relationship with patent information. With Taiwan’s electronic and IT companies as research subjects, this paper will utilize bibliographic coupling analysis to plot out a patent citation map, to explore the current situation of Taiwan high-tech industry’s R&D as well as the association between different sectors.
Literature review
Citation analysis is a quantitative study on the bibliographic citations, to search for the relations between citing documents and cited documents. In other words, it is a statistic method to analyze, compare, and classify document citations, including number of citations, publication year of cited works and the relationships in between. Our research focuses on the relationships established by the patent citations, which assumes the higher the overlap between two citations, or the higher the co-citation frequency, then the higher the association between the two. Based on such assumption, co-citation network and bibliographic coupling network can reveal the association between citations, between authors, or between research topics.
Research on co-citation network started as early as 1973, when Marshakova and Small utilized co-citation analysis to explore the relationships between bibliographies.6
Co-citation means that when document A cites documents B and C, B and C are co-cited documents.7 Egghe and Rousseau6 also pointed out, the frequency of co-citation between documents B and C grows higher, it means these two documents are more related. Bibliographic coupling, as addressed by Kessler,8 is a method for grouping
technical and scientific papers. When the same reference is cited by two papers, it was defined as a unit of coupling between two papers. The coupling strength between them is measured by the numbers of coupling units. In other words, when two documents cite the same reference, these two articles are related. The strength of this association is determined by the frequency of coupling.6
Already there have been quite a few studies on citation network, mainly focusing on citation of academic bibliographies. Kessler8 as an example used bibliographic coupling
to group the citations into clusters. Price and Schiminovich9 measured the association
between citations through bibliographic coupling to explore the development and changes in library and information science, and further cluster these citations. White and Griffith,10 through co-citation analysis, explored the development and trends in the
research area of library and information science area. In Taiwan, Tsay and Wu11 studied
the bibliographic citations in semiconductor periodicals, using the co-citation method to group them into clusters, and study the relationship among these clusters.
Some studies have conducted citation analysis on non-periodical or thesis documents. Narin12 proposed patent bibliometrics to study patent information
statistically, and developed various analytical indicators using patent citations. Karki13
also studied the various applications for analyzing patent citations. Up to now, there already exist quite some case studies for patent citation analysis. These efforts can be divided into two general directions – patents citing articles, or patents citing patents.
The former studies the relationship between science and technology, including the interaction, linkage, and the relationship between science and technological development, etc. Related studies include Meyer’s14 effort, using keywords to search
through Science Citation Index (SCI) database, searching through patent database in similar methods to compare the ratio of individual country’s articles and patents; Tijssen, Buter and van Leeuwen’s15 analysis on the Dutch scientific articles cited by US
patents between 1987 and 1996; and Narin and Olivastro’s16 comparison of the
scientific articles cited by US patents and European patents.
The study of patent documents citing patent documents aims to find the connection among technologies, countries, and companies. The quantitative studies in this area are similar to the concept of bibliographic coupling, assuming if patents A and B share certain patents in their citations, or are co-cited by other patents, or have high frequency of co-citations themselves, these two patents are closer related. From the angle of companies, this means the products or development directions between the two companies are very similar, indicating a possible cooperative alliance or competitor. From the angle of technologies, this means the two technologies are closely related. The same goes for the angle of countries.
To further understand patent citation, Ellis, Hepburn, and Oppenheim17 chose five
domains in US patents as study domain, evaluated the correlation of citation and sketch out a patent citation map to show the patents with highest citation frequency. Additionally, Verspagen18 also studied patent citation in the Netherlands. Although
Verspagen, like Ellis, Hepburn, and Oppenheim, used graphs to show the study results as well, Verspagen focused on European patents and tried to see the co-citation relationship in Dutch patents. In Taiwan, Meng, Hwang, Chang, and Kuo19 analyzed
patent citations of US patents, using CHI database to collect US patents issued to Taiwanese assignees between 1980 and 1996 to analyze innovation indicators and industrial trends in Taiwan.
Over all, the significance of patent citation study is already well established. It has been proven to be a very useful tool in formulating economic and industrial indicators. However, up to now, there have few efforts to analyze patent citation through co-citation and bibliographic coupling. That is why our study will use the bibliographic coupling method to analyze the patent citation of Taiwan’s high-tech companies, and construct a patent citation map to find the association in the technologies among these companies. Most importantly, this paper, for the first time, combines bibliographic coupling with patent bibliometrics, to prove its success in distinguishing the difference between companies, industry sectors, and their technologies.
Methodology
The study applies bibliographic coupling method to draw a patent citation map in Taiwan’s high-tech companies. Detailed explanation of subject and research design are as followed:
Subject
The subjects in this paper are high-tech companies from IT, electronic, semiconductor, and communications industries included in Taiwan’s top 1,000 firms list, compiled and published by Common Wealth Magazine in 2000. From these 1,000 firms, 411 companies belong to the above industries, including 119 from the IT industry, 212 from electronics industry, 64 from semiconductor industry, and 16 from communication industry.
To grasp the actual patent ownership for these 411 companies, our research initially searches USPTO database to find the number of patents issued to these companies in U.S. Those with less than five patents from 1992–2000, and those without issued patents from 1998–2000 are excluded in this study. The compilation results in the total of 58 companies under this condition, including 29 IT companies, 12 electronics companies, 15 semiconductor companies, and 2 communication companies.
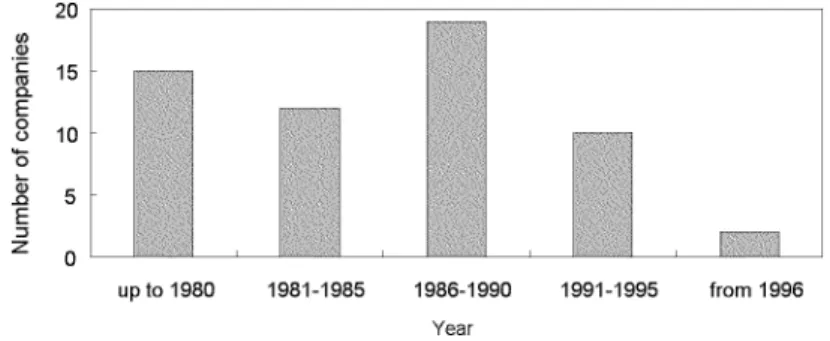
Assembling the year when each of these firms was founded results in Figure 1. In the interval of five years, there were 15 companies founded before 1980, 12 founded from 1981–1985, 19 from 1986-1990, 10 from 1991–1995, and 2 after 1996. Over all, the figure shows no high concentration of companies being founded during any particular time frame.
Research method
Using bibliographic coupling to study patent citation map, this paper will combine literature review, database searching, and bibliographic coupling analysis as major research methods.
Literature review. We first gather the relevant studies in this area, both domestically and internationally. Therefore it is necessary to search through relevant literature in various databases, not only to understand the current situation, but also for better designing the research content and procedures, as well as foreseeing possible obstacles. Also, to familiarize the subjects and understand the basic information of these companies, we also collect annual reports, company rankings and almanacs to use as references.
Database searching. To get a better picture of the patents issued to these companies, first we search through the USPTO database to collect the patents granted to these companies between 1998 and 2000, including patent numbers, titles, assignees, classifications, and patent citations.
Bibliographic coupling. Bibliographic coupling quantifies the frequency of citing the same patents by company pairs. The researchers grouped patents by assignees and coupled every company pair. The frequency of bibliographic coupling is generated by calculating the numbers of two patents citing the same patents according to each company pair. The main assumption here is: the higher the frequency, the more closely they are related. Considering number of shared patents might yield better results in this study. However, one single reference may not be sufficient to reflect strong links between patents, it does show there is a relation between two patents. Our study uses the frequency to further construct the correlation coefficients between companies. Then a multidimensional scaling is used to plot out a patent citation map. This patent citation map graphically shows the relationship between the companies. A shorter distance between the two indicates a closer relationship.
Research procedures
The steps in conducting this research is consisted of the following parts:
Searching Relevant Articles. Initially, it is necessary to study concepts, methodologies and background involved in related studies on this research. It involves
the use of domestic and international databases to search for relevant articles and reference materials on these subjects, methodologies, and related concepts.
Searching number of patents issued to subjects. To access the number of US patents granted to these companies between 1998 and 2000, it requires intensive patent searches in USPTO database. To ensure the accuracy of our statistics, the search item is limited to the “Assignee Name”, limiting the time frame of patents granted from 1998 to 2000. Regarding the different English names of the same company, it is important to consider the variations and abbreviations of each company. An example includes the term “Technology” which is sometimes referred as “Technologies” or “Tech.” Some companies also search by limiting assignee country to Taiwan to avoid finding patents owned by companies outside Taiwan.
Correction of errors on assignee country. In the process of search, some obvious errors appear in the patent information pertaining to assignee country. Sometimes Taiwan’s country code “TW” is mistaken for Turkey – “TR” or China – “CN”. We provided the necessary correction with the following rules:
(1) Use the assignee country, rather than the inventor country.
(2) If assignee country is not Taiwan, but its assignee city locates in Taiwan, such as Hsinchu or Taipei, then the assignee country is corrected to Taiwan. (3) If assignee country is not Taiwan (TW) and the assignee name is blank, even
though the inventor country is Taiwan, the assignee country is not corrected. Basic patent analysis. Basic patents analyses are done for each selected company. The results provide number of patents granted, patent classifications, patent citation, and average numbers of patent citation provide a good overview of these companies’ current patent status.
Calculating frequency of bibliographic coupling. We couple the patent granted by these companies from 1998 to 2000 to calculate the frequency of bibliographic coupling. These data is provided as basis for calculation of correlation coefficient.
Calculating correlation coefficient. With the frequency of bibliographic coupling, SPSS software computes the correlation coefficients between the coupled companies. This correlation coefficient is used for further cluster analysis and multidimensional scaling.
Plotting patent citation map. After obtaining the correlation coefficients, data from the analysis by SPSS cluster analysis and multidimensional scaling can construct a two-dimensional graph – the patent citation map.
Results Basic patent analysis
Basic patent analysis is consisted of two parts: statistic analysis of number of patents issued to these companies, and number of patents cited by these companies.
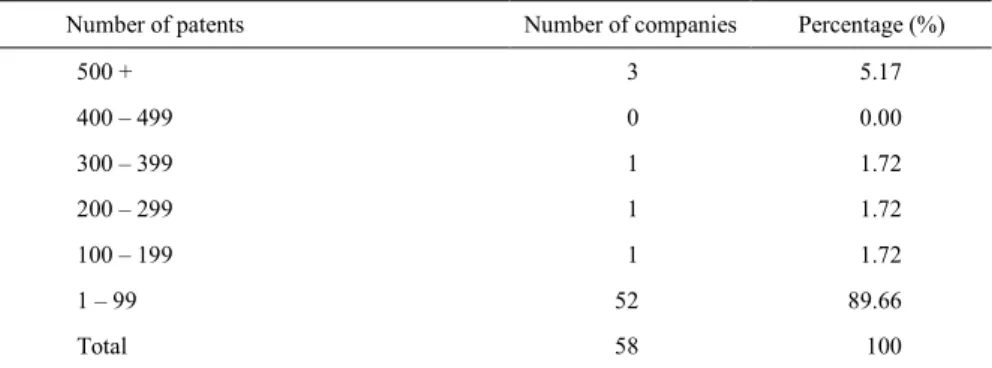
Number of patents. Results show that between 1998 and 2000, the 58 companies have been issued 4,162 patents (The overlapped 18 patents between Mosel Vitelic and ProMOS Technologies, and between Vanguard Semiconductor and Etron Technology have been deleted.). Each company by average own 71.76 patents. Table 1 lists the number of patents issued to each company. Most companies possess 1 to 99 patents, composing a percentage of 89.66%, while the rest have 151 to 885 patents, a percentage of 10.34%.
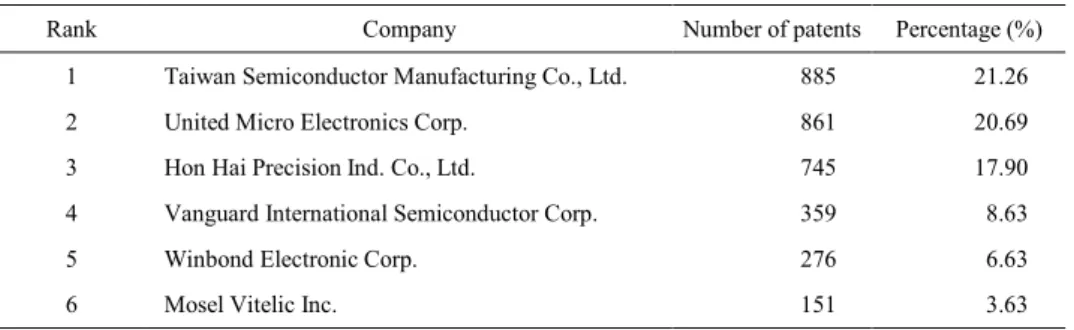
Table 2 includes companies with more than 100 granted patents, with TSMC leading with 885 patents, 21.26%. Ranking second is UMC with 861 patents, 20.69%. Hon Hai Precision ranks third with 745 patents, 17.9%. These 3 companies own 59.85% of total patents, while the rest 55 companies possess less than 400 patents, which total in 1,671 patents, 40.15%. This indicates the patent ownership is unevenly distributed, with few companies owning most of the patents.
Patent Citation Statistics. During the period of 1998 to 2000, these 58 companies cited 24,852 patents (not including the overlapped 96 by Mosel Vitelic and ProMOS, and by Vanguard and Etron Technology), averaging 5.97 per patent. Table 3 shows the distribution of number of patent citations by these companies. The data indicates 89.66% of the companies cited 1 to 999 patents, 3.45% of them cited 1,000 to 1,999, and the remaining cited 2,287 to 6,398 patents.
Table 1. Number of issued patents
Number of patents Number of companies Percentage (%)
500 + 3 5.17 400 – 499 0 0.00 300 – 399 1 1.72 200 – 299 1 1.72 100 – 199 1 1.72 1 – 99 52 89.66 Total 58 100
Table 2. Companies with more than 100 patents
Rank Company Number of patents Percentage (%)
1 Taiwan Semiconductor Manufacturing Co., Ltd. 885 21.26
2 United Micro Electronics Corp. 861 20.69
3 Hon Hai Precision Ind. Co., Ltd. 745 17.90
4 Vanguard International Semiconductor Corp. 359 8.63
5 Winbond Electronic Corp. 276 6.63
6 Mosel Vitelic Inc. 151 3.63
Table 3. Number of patents cited by companies
Number of cited patents Number of companies Percentage (%)
5,000 + 1 1.72 4,000 – 4,999 1 1.72 3,000 – 3,999 1 1.72 2,000 – 2,999 1 1.72 1,000 – 1,999 2 3.45 1 – 999 52 89.66 Total 58 100
Frequency of bibliographic coupling
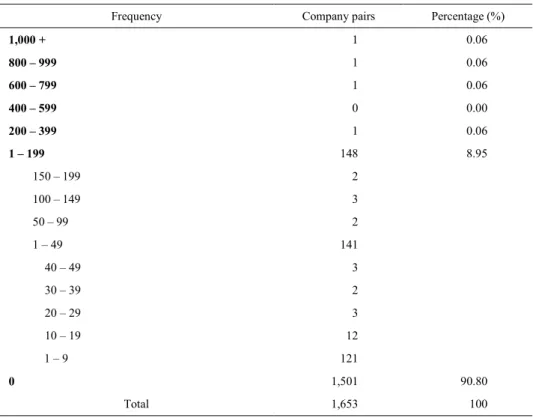
Calculating the frequency of bibliographic coupling is the first step in sketching the patent citation map. It is also the basis to calculate correlation coefficient. The research pairs up the 58 companies to produce 1,653 company pairs, in which there are 153 pairs with bibliographic couples.
Table 4 is the distribution of the frequency. In the total of 1,501 company pairs, the coupling frequency of 0 takes up 90.8%. 148 pairs have frequency of 1 to 199, a ratio of 8.95%, but 121 of those have the frequency of 1 to 9.
Table 4. Frequency of bibliographic coupling for each company pair
Frequency Company pairs Percentage (%)
1,000 + 1 0.06 800 – 999 1 0.06 600 – 799 1 0.06 400 – 599 0 0.00 200 – 399 1 0.06 1 – 199 150 – 199 100 – 149 50 – 99 1 – 49 40 – 49 30 – 39 20 – 29 10 – 19 1 – 9 148 2 3 2 141 3 2 3 12 121 8.95 0 1,501 90.80 Total 1,653 100
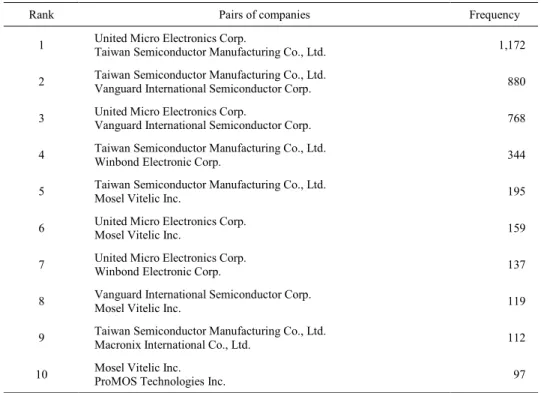
Table 5 ranks the top ten company pairs with the highest bibliographic coupling frequencies. Bibliographic coupling frequency in this study refers to numbers of patents in each company pair that cited the same patent. According to the basic assumption of bibliographic coupling, the higher the bibliographic coupling frequencies, the closer the relationship of the two companies. The leading pair is UMC and TSMC, with the frequency of 1,172. Second in ranking is the pair of TSMC with Vanguard, showing the frequency of 880. Third in ranking is UMC with Vanguard, with frequency of 768. As the frequencies of these three pairs are much higher than the rest, it indicates a close similarity among UMC, TSMC and Vanguard. Fourth in ranking is the pair of TSMC with Winbond Electronic, with frequency of 344, showing a drop of at least 50% in frequency from the first three pairs. Remaining pairs have frequencies under 200.
Table 5. Top 10 pairs of companies with highest bibliographic coupling frequencies
Rank Pairs of companies Frequency
1 United Micro Electronics Corp.Taiwan Semiconductor Manufacturing Co., Ltd. 1,172
2 Taiwan Semiconductor Manufacturing Co., Ltd.Vanguard International Semiconductor Corp. 880
3 United Micro Electronics Corp.Vanguard International Semiconductor Corp. 768
4 Taiwan Semiconductor Manufacturing Co., Ltd.Winbond Electronic Corp. 344
5 Taiwan Semiconductor Manufacturing Co., Ltd.Mosel Vitelic Inc. 195
6 United Micro Electronics Corp.Mosel Vitelic Inc. 159
7 United Micro Electronics Corp.Winbond Electronic Corp. 137
8 Vanguard International Semiconductor Corp.Mosel Vitelic Inc. 119
9 Taiwan Semiconductor Manufacturing Co., Ltd.Macronix International Co., Ltd. 112
10 Mosel Vitelic Inc.ProMOS Technologies Inc. 97
Calculating correlation coefficient
From the frequency of bibliographic coupling, we use SPSS to calculate the Pearson correlation coefficient and construct the bibliographic coupling matrix. The purpose of this step is to normalize the raw data, and to measure the correlation coefficient for later use in sketching the patent citation map.
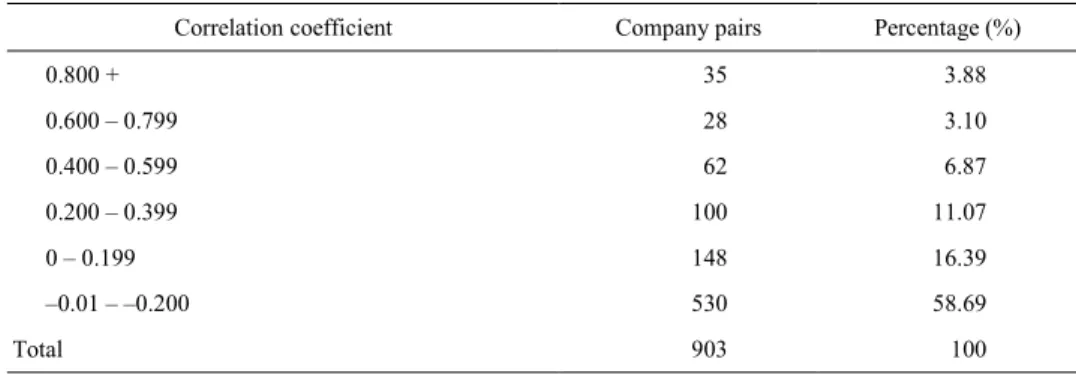
Before calculating the correlation coefficient, it’s also necessary to eliminate the companies with no coupling or only one coupling from the list. There are 15 companies removed. Coupling the remaining 43 companies produces 903 pairs. Table 6 shows the frequency distribution of correlation coefficient for each pair of company. 530 of these pairs has a negative correlation coefficient, a ratio of 58.69%; 148 company pairs have correlation coefficient between 0 and 0.199, a rate of 16.39%; 100 pairs have correlation coefficient between 0.200 and 0.399, a rate of 11.07%; and remaining pairs have correlation coefficient above 0.400, a rate of 13.85%.
Table 6. Frequency distribution of correlation coefficient for each company pair Correlation coefficient Company pairs Percentage (%)
0.800 + 35 3.88 0.600 – 0.799 28 3.10 0.400 – 0.599 62 6.87 0.200 – 0.399 100 11.07 0 – 0.199 148 16.39 –0.01 – –0.200 530 58.69 Total 903 100
Also, in these 903 company pairs, 146 have correlation coefficient that reaches significant level, among them 26 have correlation coefficient over 0.900, 9 with correlation coefficient between 0.800 and 0.899, 9 between 0.700 and 0.799, 19 between 0.600 and 0.699, 21 between 0.500 and 0.599, 41 between 0.400 and 0.499, and 21 between 0.300 and 0.399.
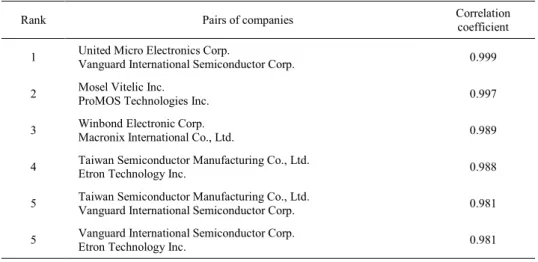
Table 7 is the list of 6 company pairs with highest correlation coefficients. The company pair that ranks first is UMC and Vanguard, with correlation coefficient of 0.999. Second in ranking is Mosel Vitelic and ProMOS., with correlation coefficient of 0.997. Third is Winbond Electronic and Macronix, with correlation coefficient of 0.989. Fourth ranking pair is TSMC with Etron Technology, with correlation coefficient of 0.988. Fifth in ranking are two pairs of TSMC with Vanguard and Vanguard with Etron Technology, both with correlation coefficient of 0.981. All these companies are from the semiconductor sector. The difference between Table 5 and Table 7 depends on whether we normalizing the raw data or not. Table 5 uses the frequency of bibliographic coupling that is based on the numbers of patents of each company, and the results are influenced by the original numbers. The correlation coefficient given in Table 7 is being normalized to avoid the above bias. It is important to note that, the value of correlation coefficient is affected by both research range and the cooperative relationship. For example, for the second ranking company pair of Mosel Vitelic and ProMOS, the latter is the spin-off of the former. Fifth ranking pair of TSMC and Vanguard – these are related companies, as Vanguard was partially invested by TSMC.
Patent citation map
Patent citation map is a two-dimensional graph that visually displays the relationship established by bibliographic coupling. Each point represents a company,
Table 7. Top 5 pairs of companies with highest correlation coefficient
Rank Pairs of companies Correlationcoefficient
1 United Micro Electronics Corp.Vanguard International Semiconductor Corp. 0.999
2 Mosel Vitelic Inc.ProMOS Technologies Inc. 0.997
3 Winbond Electronic Corp.Macronix International Co., Ltd. 0.989
4 Taiwan Semiconductor Manufacturing Co., Ltd.Etron Technology Inc. 0.988
5 Taiwan Semiconductor Manufacturing Co., Ltd.Vanguard International Semiconductor Corp. 0.981
5 Vanguard International Semiconductor Corp.Etron Technology Inc. 0.981
and the distance between the two is the association between them – shorter distance indicating a closer relationship, and vice versa. The sketch of patent citation map is based on the correlation coefficient of the companies, analyzing through SPSS’s cluster analysis and multidimensional scaling.
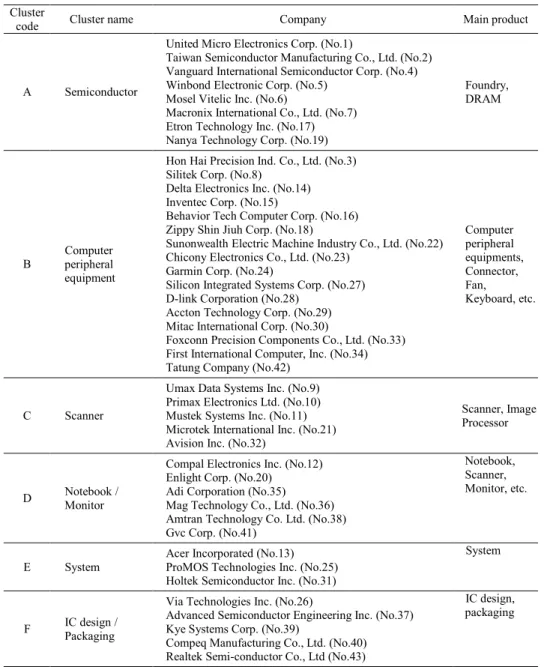
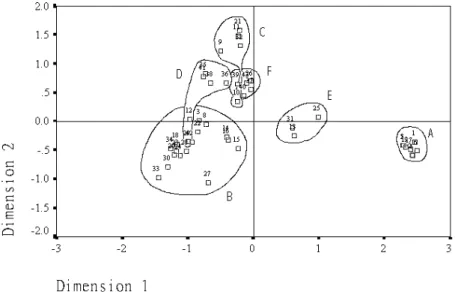
Table 8 shows the result of cluster analysis, showing six clusters from this research: Semiconductor (Cluster A), Computer peripheral equipment (Cluster B), Scanner (Cluster C), Notebook/Monitor (Cluster D), System (Cluster E), IC design/Packaging (Cluster F). Semiconductor cluster includes UMC (No.1), TSMC (No.2) and 6 others. Computer peripheral equipment cluster includes Hon Hai Precision (No.3), Silitek (No.8), 16 companies in all. Scanner cluster includes Umax (No.9), Primax Electronics (No.10), 5 companies in all. Notebook/Monitor cluster includes Compal (No.12), Enlight (No.20), 6 in all. System cluster has Acer (No.13), ProMOS (No.25) and Holtek (No.31). IC design / packaging cluster has 5 companies, including Via Technologies (No. 26), Advanced Semiconductor (No. 37), etc.
Figure 2 shows the patent citation map of these 43 companies. Semiconductor cluster (Cluster A) is located mostly in the fourth quadrant, of which 8 are from the semiconductor sector with very close relations among them. These companies are less related to others, showing a tighter connection of semiconductor sector in comparison to other sectors.
Table 8. Six clusters of high-tech companies Cluster
code Cluster name Company Main product
A Semiconductor
United Micro Electronics Corp. (No.1)
Taiwan Semiconductor Manufacturing Co., Ltd. (No.2) Vanguard International Semiconductor Corp. (No.4) Winbond Electronic Corp. (No.5)
Mosel Vitelic Inc. (No.6)
Macronix International Co., Ltd. (No.7) Etron Technology Inc. (No.17) Nanya Technology Corp. (No.19)
Foundry, DRAM B Computer peripheral equipment
Hon Hai Precision Ind. Co., Ltd. (No.3) Silitek Corp. (No.8)
Delta Electronics Inc. (No.14) Inventec Corp. (No.15)
Behavior Tech Computer Corp. (No.16) Zippy Shin Jiuh Corp. (No.18)
Sunonwealth Electric Machine Industry Co., Ltd. (No.22) Chicony Electronics Co., Ltd. (No.23)
Garmin Corp. (No.24)
Silicon Integrated Systems Corp. (No.27) D-link Corporation (No.28)
Accton Technology Corp. (No.29) Mitac International Corp. (No.30)
Foxconn Precision Components Co., Ltd. (No.33) First International Computer, Inc. (No.34) Tatung Company (No.42)
Computer peripheral equipments, Connector, Fan, Keyboard, etc. C Scanner
Umax Data Systems Inc. (No.9) Primax Electronics Ltd. (No.10) Mustek Systems Inc. (No.11) Microtek International Inc. (No.21) Avision Inc. (No.32)
Scanner, Image Processor
D MonitorNotebook /
Compal Electronics Inc. (No.12) Enlight Corp. (No.20)
Adi Corporation (No.35) Mag Technology Co., Ltd. (No.36) Amtran Technology Co. Ltd. (No.38) Gvc Corp. (No.41)
Notebook, Scanner, Monitor, etc.
E System
Acer Incorporated (No.13) ProMOS Technologies Inc. (No.25) Holtek Semiconductor Inc. (No.31)
System
F PackagingIC design /
Via Technologies Inc. (No.26)
Advanced Semiconductor Engineering Inc. (No.37) Kye Systems Corp. (No.39)
Compeq Manufacturing Co., Ltd. (No.40) Realtek Semi-conductor Co., Ltd (No.43)
IC design, packaging
Figure 2. Patent citation map
Computer peripheral equipment cluster (Cluster B) spreads in the second and third quadrants. This cluster has the largest company members of 16. The natures of these companies are also more complicated than other clusters: 10 from IT industry, 5 from electronic, and one from the semiconductor industry. Further probe into the products of these companies finds the inclusion of connector, computer peripheral equipments, notebook computers, fan, keyboard, GPS system, etc. System technology from the semiconductor industry is less related than the rest. Perhaps it’s because system technology is also less related than the rest of the semiconductor technologies; thus, it is grouped into this cluster that is more related to IT and electronic sectors.
Scanner cluster (Cluster C) is located in the second quadrant. The five companies in this cluster are all in the IT sector. The products of these companies are all mostly scanner, monitors and others. The location of No. 10, Primax seems more related to IC design/packaging (Cluster F), but its products bring it to this cluster after analysis.
Notebook/Monitor (Cluster D), spreading out crosses the second and third quadrants, includes 6 companies, from which 5 are from IT sector and one is from communication sector. From the product perspective, most of these companies produce monitor or image processor. The only company that is located in the third quadrant is
Enlight (No. 20) that produces power supply, case and other parts, not really related to the products of this cluster. That is why it is geographically located closer to Cluster B.
System cluster (Cluster E) spreads out between first and fourth quadrants and includes 3 companies. Two are from the semiconductor industry and one from IT industry. The 2 companies from semiconductor industry are located in the fourth quadrant, also closer to the semiconductor cluster (A). A possible explanation for being in this cluster may be its relatively low correlation coefficient, but with a similar value with the rest of the members in this group. On the other hand, although Acer (No.13) is an IT company by nature, its location is actually closer to semiconductor sector. This shows that from analysis of patent citation, the result positions it closer to the semiconductor industry.
IC design/packaging cluster (Cluster F) is in the second quadrant with 5 companies that includes 3 from the semiconductor sector, one from IT and one from electronic industry. The semiconductor companies in this cluster are mostly involved in IC design or packaging, relatively different from the other semiconductor companies. Kye Systems, an IT company, also produces scanner; however, cluster analysis still groups it into IC design/packaging cluster. It may be the value of correlation coefficient that positions it here. Still, Kye’s (No.39) location on the map is closer to Scanner cluster. As for Compeq (No.40), an electronic company which produces printed circuits, since there is not a related cluster for the company, the cluster analysis still places it in the IC design/packaging cluster.
Over all, although our research groups the high-tech companies into 4 general industries of IT, electronic, semiconductor and communication, according to the classification by Common Wealth Magazine, but cluster analysis further divides the industry into different sub-groups. Take IT sector as an example. It can be further divided into scanner, monitor or computer peripheral equipments. Semiconductor sector can be further grouped into IC manufacturing, IC design, packaging. The result also shows certain companies from different clusters can be closely related, such as Acer to semiconductor sector. Dividing industries by quadrant also brings interesting results in showing relationship between the companies. For example, second quadrants are mostly IT companies, whereas fourth sector is mostly composed of semiconductor companies.
Conclusions
The results from cluster analysis and multidimensional scaling can construct a patent citation map. On the map, companies that produce computer peripheral equipments, scanner, monitor, and image processor are located closer to the center, in the core of high-tech industry in Taiwan. Semiconductor companies are located further from the rest of the companies. Studying the association between the companies inside each cluster will reveal that semiconductor companies are more related, while companies from the other clusters are not as closely related.
In the research subjects, IT companies are the largest group with 29 companies. With bibliographic coupling, we find that IT industry can be further grouped into sub-clusters of computer peripheral equipment, scanner, and monitor. The members of individual sub-cluster are much more closely related. In all these electronic high-tech industry, IT sector plays an important role, with the highest number of companies and includes the widest range of technologies. In this sector, companies producing scanner, monitor and image processor are also the most associated.
Additionally, from the analysis of patent citation map, it shows that apart from semiconductor cluster with the highest correlation coefficients, the division between IT, electronic, and communication is becoming ambivalent, even overlapping in some cases. This indicates there is no absolute line between different sectors. The difficulty in classification of the industry is also clearly shown here.
This study also clearly indicates that bibliographic coupling not only can be a useful tool in exploring the relationship between periodical articles, or assistance in information retrieval, but can also be used to analyze patent information and sketch patent citation map to show the association among companies, technologies, and products. It is indeed a research domain worthy of further exploration.
Reference
1. W. L. HSIA, The value of patents toward business, Intellectual Property Management, 16 (1998) 20–21. (In Chinese).
2. 2000 TAIWAN INFORMATION INDUSTRY ALMANAC EDITING GROUP, 2000 Taiwan Information Industry Almanac, Taipei: Institute for Information Industry, 2001. (In Chinese).
3. W. Y. MA, Y. L. YANG, A reassessment in the empirical study of the high-tech industry, Forum of Business, 2(2) (2001) 31–57. (In Chinese).
4. DEPARTMENT OF INDUSTRIAL TECHNOLOGY, MINISTRY OF ECONOMIC AFFAIRS, R. O. C. 1996, The 1995 White Paper of Industries. http://doit.moea.gov.tw/06success/1995/dic.asp (23 July 2002) (In Chinese).
5. INTELLECTUAL PROPERTY OFFICE. 2002. Statistics of Taiwan’s Applied and Issued Patents in 2001.
http://www.moeaipo.gov.tw/news/ShowNewsContent.asp?otype=1&postnum=1197&from=board
(12 June 2002) (In Chinese).
6. L. EGGHE,R. ROUSSEAU, Introduction to Informetrics: Quantitative Methods in Library, Documentation and Information Science, New York: Elsevier Science Publishing Company, 1990.
7. A. F. J. VAN RAAN, Fractal geometry of information space as represented by co-citation clustering, Scientometrics, 20 (3) (1991) 439–449.
8. M. M. KESSLER, Bibliographic coupling between scientific papers, American Documentation, 14 (1963) 10–25.
9. N. PRICE, S. SCHIMINOVICH, A clustering experiment: First step toward a computer-generated classification scheme, Information Storage and Retrieval, 4 (1968) 271–280.
10. H. D. WHITE, B. C. GRIFFITH, Visualizing a discipline: An author co-citation analysis of information science, 1972-1995, Journal of the American Society for Information Science, 49 (4) (1998) 327–355. 11. M. Y. TSAY, C. W. WU, Co-citation study of semiconductor journals, Journal of Information,
Communication, and Library Science, 8 (2) (2001) 9-21. (In Chinese). 12. F. NARIN, Patent bibliometrics, Scientometrics, 30 (1) (1994) 147–155.
13. M. M. S. KARKI, Patent citation analysis: A policy analysis tool, World Patent Information, 19 (4) (1997) 269–272.
14. M. MEYER, Patent citations in a novel field of technology – What can they tell about interactions between emerging communities of science and technology? Scientometrics, 48 (2) (2000) 151–178. 15. R. J. W. TIJSSEN,R. K.BUTER, T. N. VAN LEEUWEN, Technological relevance of science: An assessment
of citation linkages between patents and research papers, Scientometrics, 47 (2) (2000) 389–412. 16. F. NARIN, D. OLIVASTRO, Linkage between patents and papers: An interim EPO/US comparison,
Scientometrics, 41 (1-2) (1998) 51–59.
17. P. ELLIS, G. HEPBURN,C.OPPENHEIM, Studies on patent citation networks, Journal of Documentation, 34 (1) (1978) 12–20.
18. B. VERSPAGEN, The role of large multinationals in the Dutch technology infrastructure: A patent citation analysis, Scientometrics, 47 (2) (2000) 427–448.
19. H. C. MENG, M. J. HWANG, D. M. CHANG, K. H. KUO, Industry innovation indicator: Patent citation analysis and patent indicator (I), Journal of Technology Management, 5 (1) (2000) 31–49. (In Chinese).