Analyze the Impact to Backbone Router of Cooperative Caching Proxy Server.
22
0
0
全文
(2) Table of Contents 1. Introduction ............................................................................................................1 2. The Deployment of Cooperative Proxy Server on TANet...................................2 2.1 OVERVIEW OF TANET ................................................................................................ 2 2.2 COOPERATIVE PROXY SERVER ON TANET ................................................................ 3. 3. Analytical Model of Proxy Server Meshes ...........................................................5 3.1 TRAFFIC ANALYSIS – VOLUME OF TRAFFICS ............................................................. 8 3.2 TRAFFIC ANALYSIS – VOLUME OF PACKETS.............................................................. 9 3.3 ESTIMATION OF THE PARAMETERS........................................................................... 10 3.4 VOLUME OF TRAFFICS .............................................................................................. 11 3.5 VOLUME OF PACKETS ............................................................................................... 14. 4. Discussions ............................................................................................................16 5. Conclusions and Future Works...........................................................................18 References ...................................................................................................................20. ii.
(3) 1. Introduction Caching proxy server is widely used as an effective way to reduce network traffic. It migrates copies of requested objects from origin web servers to a place closer to the clients. Essentially, once the object pointed to by an URL has been cached in the proxy server, subsequent requests for the same URL will result in the cached copy being returned, and little or no extra network traffic will be generated. There are many projects on deploying proxy server in the national wide network. These include NLANR (National Laboratory for Applied Network Research, United States), CHOICE Project (Europe), HENSA (United Kingdom), Academic National Web Cache (New Zealand), W3 CACHE (Poland), SingNet (Singapore), CINECA (Italy) and Korea Cache Project (Korea). [1, 2, 3, 4, 5] A single proxy server has its limitation in capacity to serve the requests. Although the network bandwidth grows with respect to the requirement of user, the proxy server cannot afford the capacity to serve the increasing requests. This is the problem of scalability, which also yields the problem of load sharing among standalone proxy server. Another Problem with a single proxy server is that the reliability of service. A system failure on account of any reason will hinder the normal operation of the service, which highly impacts the user or the client. Thus, how to device a mechanism or protocol to cooperate the standalone proxy server become an important issue. Alternative solutions are being proposed to meet specific requirements and circumstances. There are many protocols and systems, either research domain or proprietary, deployed in cooperative proxy caching today. These include ICP [6, 7, 8], Cache Digests [9, 10], CARP [11, 12], WCCP [13] and so on. Additional protocols or dedicated devices are being invented to satisfy the innovated requirements. Although there are many caching related techniques being proposed by research papers, there exist case-by-case deviation in practical deployment. In section 1.2, we gave a brief introduction of the current status of TANet. Then, we mentioned the deployment of cooperative proxy server on TANet. In section 1.3, an analytical model was proposed to analyze the volume of traffics and packets gaining from the. 1.
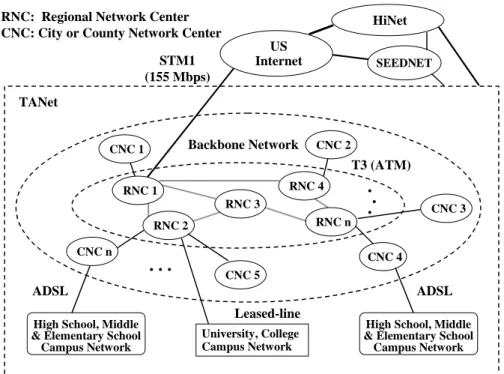
(4) cooperative proxy server. We discussed the lessons and experiences learned from the deployment of cooperative proxy server in section 1.4. Although there are many related techniques proposed by the research paper, there still left much to be considered in practical deployment. Finally, we pointed out the future research direction to be continued in the domain of cooperative proxy caching server.. 2. The Deployment of Cooperative Proxy Server on TANet 2.1 Overview of TANet. RNC: Regional Network Center CNC: City or County Network Center STM1 (155 Mbps). HiNet US Internet. SEEDNET. TANet Backbone Network. CNC 1. CNC 2. T3 (ATM) RNC 4. RNC 1 RNC 3. CNC 3. RNC n. RNC 2 CNC n. .... . . . CNC 4. CNC 5. ADSL. ADSL. High School, Middle & Elementary School Campus Network. Leased-line University, College Campus Network. High School, Middle & Elementary School Campus Network. Figure 1.1: The network topology of TANet. Computer Center of the Ministry of Education (MOECC) and some national universities built TANet in July 1990. The objective is to establish a common national academic network infrastructure to support research and academic institutes in Taiwan. At present, there are 12 regional network centers (RNCs) including 11 national universities and the Ministry of Education; and 27 city/county network centers (CNCs), which are governed by the Education Bureau of City/County. All schools have been connected to TANet since July 1999. It consists of about 4100 schools and 100 academic related institutes including universities, colleges, and. 2.
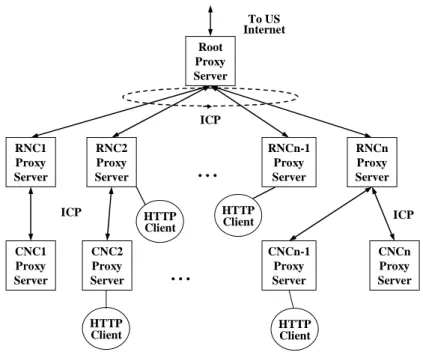
(5) K12 schools. It estimates that the user is up to two million. TANet is a three-layered architecture consisting of RNCs, CNCs and campus networks as depicted in Figure 1.1. The RNCs are interconnecting with high-speed ATM circuit. The incoming and outgoing bandwidth of RNC is 120 Mbps. CNC is the aggregated point which connect K12 schools inside the city/county, and then connects to neighbor RNC with ATM T3 circuit. The international link from TANet to U.S. Internet is a STM1 (155 Mbps) circuit. With the rapid growth of institutes and users, it becomes congested to connect to other country via the international link. To solve the problem of limited international bandwidth, we strategically partition the 100 Mbps into two parts: 36 Mbps for general-purpose use and another 64 Mbps for proxy server use only. In order to take advantage of the specific portion of 64 Mbps of the international link, a tentative-staged proxy server construction project had been applied since Dec. 1998 to improve the congestion situation.. 2.2 Cooperative Proxy Server on TANet. To US Internet Root Proxy Server. ICP RNC2 Proxy Server ICP. HTTP Client CNC2 Proxy Server. HTTP Client. . ... CNC1 Proxy Server. . ... RNC1 Proxy Server. RNCn-1 Proxy Server. HTTP Client. RNCn Proxy Server ICP. CNCn-1 Proxy Server. CNCn Proxy Server. HTTP Client. Figure 1.2: The topology of proxy server on TANet. (1st stage) Most RNCs and CNCs on TANet use Squid proxy server not only for cost reason but also for the capability of tailoring source code. Squid support the Internet Cache Protocol. 3.
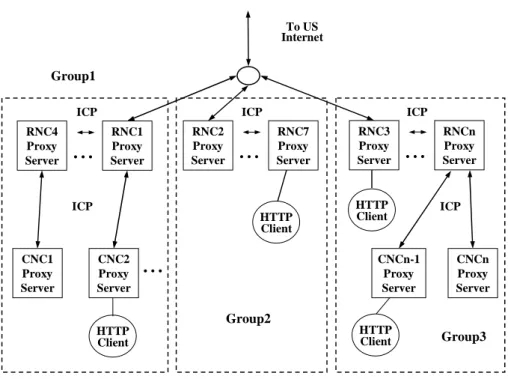
(6) (ICP), which make it possible to share cached object in other caches. The initial topology of cooperative proxy server on TANet is depicted in Figure 1.2. It is a hierarchical architecture of three levels: (1) the top level is the root server at MOECC, (2) the first level is RNC, and (3) the next level is CNC. There is a sibling relationship among RNCs through ICP message of Squid. In additional to serve the proxy server of CNC, RNC’s proxy server also serves the universities directly connected to it. The CNC proxy server serves K12 schools that connect to it. On account of too many ICP query messages generated in RNC level, which make the congested network, become worse. Moreover, they heavily increase the latency time of client request. Another problem is that the capacity of root server and some RNCs cannot afford to handle the volume of requests.. To US Internet. Group1 ICP. ICP. RNC7 Proxy Server. HTTP Client CNC2 Proxy Server. Group2 HTTP Client. RNC3 Proxy Server. HTTP Client. CNCn-1 Proxy Server. . ... CNC1 Proxy Server. RNC2 Proxy Server. ICP. . ... RNC1 Proxy Server. . ... . ... RNC4 Proxy Server. ICP. HTTP Client. RNCn Proxy Server. ICP. CNCn Proxy Server. Group3. Figure 1.3: The topology of proxy server on TANet. (2nd stage) To solve the above problem, we narrow down the hierarchical topology. The root server is also removed. The RNC level is partition into groups of caches based on geographic. 4.
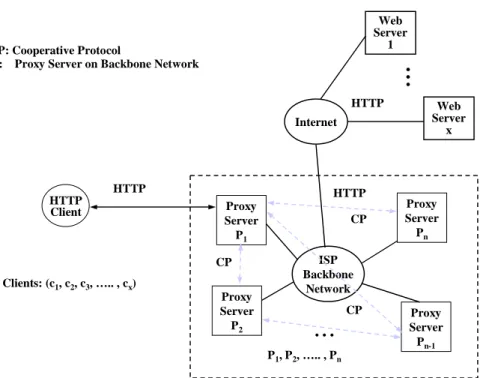
(7) location. Each group can directly connect to the U.S. Internet. The sibling relationship is still existed inside the groups. It becomes a two-level architecture as illustrated in Figure 1.3. The ICP traffic among groups still exists and occasionally in an unacceptable high latency because the backbone network utilization is near congested during office hour. Although the partition into groups was made to reduce the ICP traffic, the inter-cache communication among the groups still do not work well. Based on the traffic analysis in next section, the cooperation among groups of RNCs is removed. There is no cooperative protocol running among RNCs.. 3. Analytical Model of Proxy Server Meshes. Web Server 1. CP: Cooperative Protocol Pi: Proxy Server on Backbone Network. .. . HTTP Internet. HTTP HTTP Client. HTTP Proxy Server P1 CP. Clients: (c1, c2, c3, ….. , cx). Proxy Server Pn. ISP Backbone Network CP. . ... Proxy Server P2. CP. Web Server x. Proxy Server Pn-1. P1, P2, ….. , Pn. Figure 1.4: Topology of a typical ISP proxy server architecture. A generic topology of proxy server architecture of Internet Service Provider (ISP) is shown in Figure 1.4. Left side of the figure is one of the regional networks of the ISP. The regional network proxy sever P1 serves the HTTP requests of its clients Cx. The same case is also applicable for other proxy servers on the ISP backbone network. The information changed among the proxy servers is the cache cooperation protocol. If there is a sibling relationship between two proxy servers, a cache miss in one proxy server will query another.. 5.
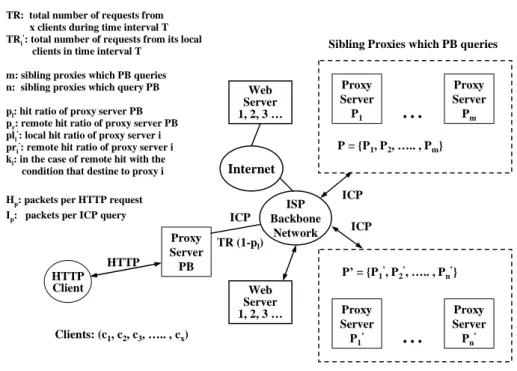
(8) It is not necessary for any two proxy servers to have the relationship of sibling.. Figure 1.5 was derived from Figure 1.4 without loss of generality. The objective is to simplify the model for analysis. For any proxy server Pi on the backbone network, the relations of sibling could be categorized into two kinds: (1) Siblings which pi sends queries, (2) Siblings which send queries to pi .. TR: total number of requests from x clients during time interval T TRi’: total number of requests from its local clients in time interval T m: sibling proxies which PB queries n: sibling proxies which query PB. Hp: packets per HTTP request Ip: packets per ICP query. HTTP HTTP Client. Web Server 1, 2, 3 …. Internet. TR (1-pl). ISP Backbone Network. ICP ICP. P’ = {P1’, P2’, ….. , Pn’} Web Server 1, 2, 3 …. Proxy Server P 1’. . ... Clients: (c1, c2, c3, ….. , cx). Proxy Server Pm. P = {P1, P2, ….. , Pm}. ICP Proxy Server PB. Proxy Server P1. . ... pl: hit ratio of proxy server PB pr: remote hit ratio of proxy server PB pli’: local hit ratio of proxy server i pri’: remote hit ratio of proxy server i ki: in the case of remote hit with the condition that destine to proxy i. Sibling Proxies which PB queries. Proxy Server Pn’. Sibling Proxies which query PB. Figure 1.5: Generic model of an ISP proxy server. As shown in Figure 1.5, HTTP requests from a set of clients C={C1, C2, …, Cx} are send to the regional proxy server PB. If the proxy server PB has the requested object in its cache, no more messages are generated. Otherwise, PB sends ICP queries to the set of siblings P={P1, …, Pm} and each of them returns reply, a hit or a miss, to the proxy server PB. If some siblings return hits, it forwards the HTTP requests to the sibling that returns the hit first. If no siblings return hits, it forwards the HTTP request to the origin web server. On the other hand, PB receives ICP queries from another group of siblings P ' = {P1' ,..., Pn' } . This model can be. 6.
(9) generalized for every backbone network proxy P and P’. The local hit ratio of proxy server PB is pl and the remote hit ratio is p r . The set of clients { C1,C2,…,Cx } send HTTP requests to PB. Since the local hit rate of PB is pl , it sends ICP queries to its siblings with the probability of (1 − pl ) . One of this ICP queries makes a hit at a sibling with the probability of p r , and in such case the HTTP request is forwarded to the sibling. The probability that the entire ICP queries make misses is. (1 − pl − p r ) , and in such case the HTTP request is forwarded to the origin web server. The related variables are as follows.. TR : the number of total HTTP requests. V : the total volume of traffics generated.. VC : the total volume of traffics generated to process HTTP requests. V P : the total volume of traffics generated to process ICP messages to its siblings.. V p' : the total volume of traffics generated by P ' to query PB. S : the total number of packets generated.. S C : the total number of packets generated to process HTTP requests. S P : the total number of packets generated to process ICP messages to its siblings. S p' : the total number of packets generated by P ' to query PB.. H s : traffic size (Bytes) per HTTP request. I s : traffic size (Bytes) per ICP message. H p : packets per HTTP request. I p : packets per ICP message. m : the number of siblings which PB sends ICP queries. n : the number of siblings which send queries to PB. The siblings Pi ' receive TRi' HTTP requests and its local hit ratio is pli' . If Pi '. 7.
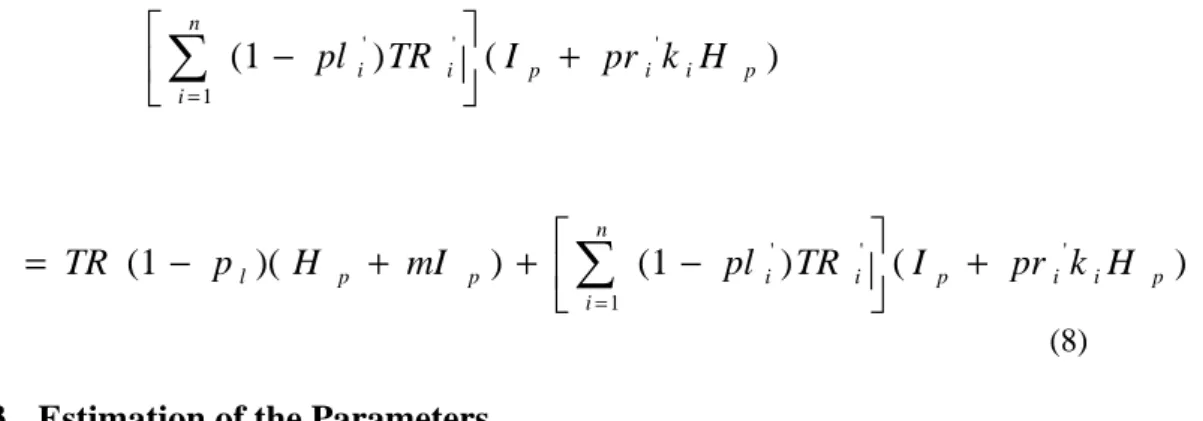
(10) does not have the requested object in its local cache, it send ICP queries to its siblings and one of the ICP queries is for the proxy PB. The remote hit ratio of Pi ' is pri ' . When ICP queries from Pi ' make hits at its sibling,. Pi ' forwards the HTTP request to the sibling, which returns the hit first. The conditional probability that PB returns the first hit is ki .. 3.1 Traffic Analysis – Volume of Traffics In this subsection, the total volume of traffics generated to process HTTP requests is denoted as V . The volume of traffics contribute to the backbone network were be measured. These traffics consist of: (1) VC : traffics to process HTTP requests; (2) VP : traffics to manipulate the ICP queries to its siblings; and (3) VP' : traffics to process the queries from other proxy servers.. Vc = p r H s + (1 − pl − p r ) H s = (1 − pl ) H s. remote HTTP hit HTTP requests to origin web servers (1). V p = TR (1 − pl )mI s. (2) the ICP queries sent to its siblings. V. ' p. n = ∑ (1 − pl i' ) TR i' I s i =1 n + ∑ (1 − pl i' ) TR i' pr i k i H i =1 . s. n = ∑ (1 − pl i' ) TR i' ( I s + pr i ' k i H s ) i =1 . (3). The total volume of traffics V is as follows.. V = Vc + V p + V p' = (1) + (2) + (3). = (1 − pl ) H s + TR (1 − p l ) mI. s. +. 8.
(11) n ' ' ' ∑ (1 − pl i ) TR i ( I s + pr i k i H s ) i =1 . = TR (1 − p l )( H. s. n + mI s ) + ∑ (1 − pl i' ) TR i' ( I s + pr i ' k i H s ) i =1 (4). 3.2 Traffic Analysis – Volume of Packets In this subsection, the total volume of packets generated to process HTTP requests is denoted as S . The volume of packets contribute to the backbone network were be measured. These packets consist of: (1) Sc : packets to process HTTP requests; (2) S P : packets to manipulate the ICP queries to its siblings; and (3) S P' : packets to process the queries from other proxy servers.. S c = pr H p + (1 − pl − p r ) H p. remote HTTP hit HTTP requests to origin web servers. = (1 − pl ) H p. (5). S p = TR (1 − pl )mI p. (6) the ICP queries sent to its siblings. S. ' p. n = ∑ (1 − pl i' ) TR i' I i =1 . p. n + ∑ (1 − pl i' ) TR i' pr i k i H i =1 n = ∑ (1 − pl i' ) TR i' ( I i =1 . p. p. + pr i ' k i H. p. ) (7). The total number of packets S is as follows.. S = Sc + S p + S p' = (5) + (6) + (7). = (1 − pl ) H p + TR (1 − p l ) mI. p. +. 9.
(12) n ' ' ∑ (1 − pl i ) TR i ( I i =1 . = TR (1 − p l )( H. p. + mI. p. + pr i ' k i H. p. ). n ' ' ) + p ∑ (1 − pl i ) TR i ( I i =1 . p. + pr i ' k i H. p. ). (8). 3.3 Estimation of the Parameters The related parameters are derived from the proxy server of NSYSU. The detail logs could be downloaded from [14]. The log file duration is from 8th April 2002 to 14th April 2002. Table 1.1 gives the summary of the logs. The related parameters are as follows. Table 1.1 The statistics of transaction log from proxy server in NSYSU. Date. #Req.. L_HitR. R_HitR. MByte. KBytes/Req.. 2002/4/8. 25,515,828. 37.03. 9.29. 245,709. 9.9. 2002/4/9. 28,052,361. 43.91. 9.73. 263,670. 9.6. 2002/4/10. 27,742,357. 43.57. 10.01. 264,022. 9.7. 2002/4/11. 30,041,678. 43.99. 10.21. 272,156. 9.3. 2002/4/12. 29,416,858. 45.21. 9.91. 287,781. 10.0. 2002/4/13. 18,287,712. 45.36. 8.49. 219,997. 12.3. 2002/4/14. 16,829,643. 47.44. 8.06. 172,054. 10.5. 25,126,634. 43.79. 9.38. 246,484. 10.2. Average. 1. TR, TRi' : 2.5 × 10 7 In this model, we assume that the clients of all backbone proxy server with the same scale of clients. 2. pli' : 0.44 , pri ' : 0.094 3. ki : 0.2 The value of ki depends on many factors, such as the round trip time between the sibling pair of proxy server, the local hit ratio, the numbers of sibling, and so on. Since our objective is to investigate the traffic and packet effect of the configuration. 10.
(13) of cooperative proxy server, we set the value to 0.2. #Req.:. Number of requests.. L_HitR:. Local hit ratio.. R_HitR:. Remote hit ratio.. 4. H s : 10.2 KBytes, H p : 17 The transport layer protocol HTTP used is TCP. The TCP connection use 3-way handshaking (SYN, SYNACK, ACK) to setup connection. After TCP session established, HTTP request issued from client to the server and server responses ACK to client. Next, the data transfer from server to client begins. The average size of the requested object is 10.2 KBytes. It is known that the maximum segment size is 1460 Bytes in general case. It needs about 8 packets for data to be transferred. Finally, the FIN and FINACK packet are exchanged. The total amount of packets needed for a general HTTP request are about 17 (3+2+8+4). 5. I s : 100 Bytes (0.1 KBytes), I p : 2 ICP is a request-response protocol using UDP transport layer protocol. Proxy server sends an ICP request to query its sibling. The sibling receives the ICP query, searches its cache for the specified object and returns the result. The ICP message contains a header of 20 Bytes and the payload containing the URL of the object. Since the general URL length is less than 100 Bytes, thus ICP message need one IP packet. Consequently, 2 IP packets are needed for ICP communication.. 3.4 Volume of Traffics From equation 4, we substitute the parameters derived in subsection 3.3.. TR (1 − p l )( H. s. + mI. n ' ' ' ) + s ∑ (1 − pl i ) TR i ( I s + pr i k i H s ) i =1 . = TR (1 − Pl )(0.1m + 0.2917 n + 10.2) = 2.5 × 10 7 (1 − Pl )(0.1m + 0.2917 n + 10 .2). (9). Case 1: m = 0, n = 0. 11.
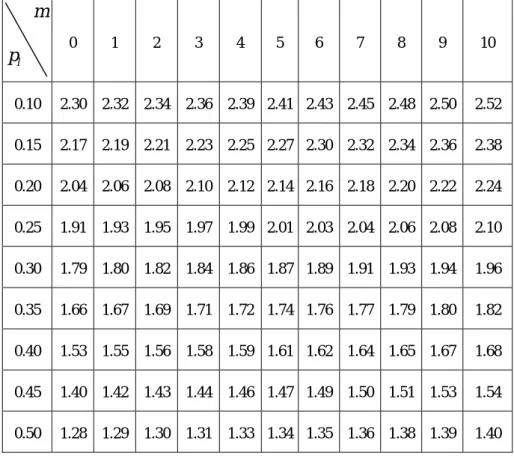
(14) This means no siblings relationship existed with PB and there are also no queries from siblings to PB. The equation (9) become. 2.55 × 10 8 (1 − p l ) . The total volume of traffics depend fully on pl , that is the local hit ratio of PB. This is a special case of case 2 when m=0, the related value of p l and m are shown in table 1.2. Case 2: m ≠ 0, n = 0 There existed siblings which PB sends queries, but no queries from other siblings. The equation (9) become. 2.5 × 10 7 (1 − p l )(0.1m + 10 .2) . The related value of p l and m are shown in table 1.2. Table 1.2 The result of case 2 in traffic analysis.. m 0. 1. 2. 3. 0.10. 2.30. 2.32. 2.34. 2.36. 2.39 2.41 2.43 2.45 2.48 2.50. 2.52. 0.15. 2.17. 2.19. 2.21. 2.23. 2.25 2.27 2.30 2.32 2.34 2.36. 2.38. 0.20. 2.04. 2.06. 2.08. 2.10. 2.12 2.14 2.16 2.18 2.20 2.22. 2.24. 0.25. 1.91. 1.93. 1.95. 1.97. 1.99 2.01 2.03 2.04 2.06 2.08. 2.10. 0.30. 1.79. 1.80. 1.82. 1.84. 1.86 1.87 1.89 1.91 1.93 1.94. 1.96. 0.35. 1.66. 1.67. 1.69. 1.71. 1.72 1.74 1.76 1.77 1.79 1.80. 1.82. 0.40. 1.53. 1.55. 1.56. 1.58. 1.59 1.61 1.62 1.64 1.65 1.67. 1.68. 0.45. 1.40. 1.42. 1.43. 1.44. 1.46 1.47 1.49 1.50 1.51 1.53. 1.54. 0.50. 1.28. 1.29. 1.30. 1.31. 1.33 1.34 1.35 1.36 1.38 1.39. 1.40. pl. 4. 5. 6. 7. 8. 9. 10. Case 3: m = 0, n ≠ 0. 12.
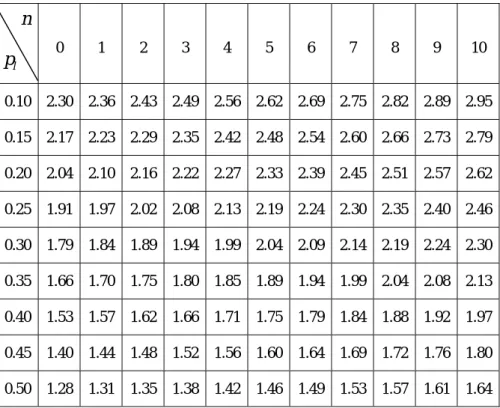
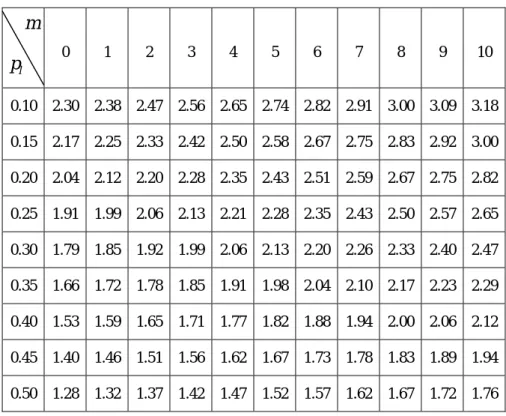
(15) There are no siblings which PB send queries, but the queries from other siblings do existed. This also means that PB is robust enough to afford the queries from other siblings. Meanwhile, the other siblings could be with limited capacity to support others’ queries. It also implies that PB is connected with higher bandwidth to the Internet. The equation (9) become. 2.5 × 10 7 (1 − p l ) + (0.2917 n + 10 .2) . The related value of p l and n are shown in table 1.3. Table 1.3 The result of case 3 in traffic analysis.. n 0. 1. 2. 3. 4. 5. 6. 7. 8. 9. 10. 0.10. 2.30. 2.36. 2.43. 2.49. 2.56. 2.62. 2.69. 2.75. 2.82. 2.89. 2.95. 0.15. 2.17. 2.23. 2.29. 2.35. 2.42. 2.48. 2.54. 2.60. 2.66. 2.73. 2.79. 0.20. 2.04. 2.10. 2.16. 2.22. 2.27. 2.33. 2.39. 2.45. 2.51. 2.57. 2.62. 0.25. 1.91. 1.97. 2.02. 2.08. 2.13. 2.19. 2.24. 2.30. 2.35. 2.40. 2.46. 0.30. 1.79. 1.84. 1.89. 1.94. 1.99. 2.04. 2.09. 2.14. 2.19. 2.24. 2.30. 0.35. 1.66. 1.70. 1.75. 1.80. 1.85. 1.89. 1.94. 1.99. 2.04. 2.08. 2.13. 0.40. 1.53. 1.57. 1.62. 1.66. 1.71. 1.75. 1.79. 1.84. 1.88. 1.92. 1.97. 0.45. 1.40. 1.44. 1.48. 1.52. 1.56. 1.60. 1.64. 1.69. 1.72. 1.76. 1.80. 0.50. 1.28. 1.31. 1.35. 1.38. 1.42. 1.46. 1.49. 1.53. 1.57. 1.61. 1.64. pl. Case 4: m ≠ 0, n ≠ 0 Both the siblings which PB sends queries and the queries from other siblings are existed. It implies that the bandwidth to Internet is high and also robust enough to handle additional ICP messages. The grouping of siblings means that both ICP query and reply existed with any pairs of proxy server inside the group. Thus, we may assume that m equal to n. The related value of p l and m/n are shown in table 1.4.. 13.
(16) Table 1.4 The result of case 4 in traffic analysis.. m 0. 1. 2. 3. 4. 5. 6. 7. 8. 9. 10. 0.10. 2.30. 2.38. 2.47. 2.56. 2.65. 2.74. 2.82. 2.91. 3.00. 3.09. 3.18. 0.15. 2.17. 2.25. 2.33. 2.42. 2.50. 2.58. 2.67. 2.75. 2.83. 2.92. 3.00. 0.20. 2.04. 2.12. 2.20. 2.28. 2.35. 2.43. 2.51. 2.59. 2.67. 2.75. 2.82. 0.25. 1.91. 1.99. 2.06. 2.13. 2.21. 2.28. 2.35. 2.43. 2.50. 2.57. 2.65. 0.30. 1.79. 1.85. 1.92. 1.99. 2.06. 2.13. 2.20. 2.26. 2.33. 2.40. 2.47. 0.35. 1.66. 1.72. 1.78. 1.85. 1.91. 1.98. 2.04. 2.10. 2.17. 2.23. 2.29. 0.40. 1.53. 1.59. 1.65. 1.71. 1.77. 1.82. 1.88. 1.94. 2.00. 2.06. 2.12. 0.45. 1.40. 1.46. 1.51. 1.56. 1.62. 1.67. 1.73. 1.78. 1.83. 1.89. 1.94. 0.50. 1.28. 1.32. 1.37. 1.42. 1.47. 1.52. 1.57. 1.62. 1.67. 1.72. 1.76. pl. 3.5 Volume of Packets From equation 8, we substitute the parameters derived in subsection 3.3.. TR (1 − p l )( H. p. + mI. n ' ' ) + p ∑ (1 − pl i ) TR i ( I i =1 . p. + pr i ' k i H. p. ). = TR (1 − Pl )( 2m + 2.32 n + 17 ) = 2.5126 × 10 7 (1 − Pl )( 2 m + 2.32 n + 17 ). (10). Case 1: m = 0, n = 0 The equation (10) become. 4.2714 × 10 8 (1 − p l ) . This is a special case of case 2 when m=0, the related value of p l and n are shown in table 1.5. Case 2: m ≠ 0, n = 0 The equation (10) become. 2.5126 × 10 7 (1 − p l )( 2 m + 17 ) .. 14.
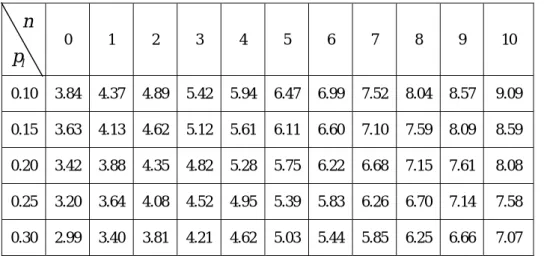
(17) The related value of p l and n are shown in table 1.5. Table 1.5 The result of case 2 in packet analysis.. n 0. 1. 2. 3. 4. 5. 6. 7. 8. 9. 10. 0.10. 3.84. 4.30. 4.75. 5.20. 5.65. 6.11. 6.56. 7.01. 7.46. 7.91. 8.37. 0.15. 3.63. 4.06. 4.48. 4.91. 5.34. 5.77. 6.19. 6.62. 7.05. 7.47. 7.90. 0.20. 3.42. 3.82. 4.22. 4.62. 5.03. 5.43. 5.83. 6.23. 6.63. 7.04. 7.44. 0.25. 3.20. 3.58. 3.96. 4.33. 4.71. 5.09. 5.46. 5.84. 6.22. 6.60. 6.97. 0.30. 2.99. 3.34. 3.69. 4.05. 4.40. 4.75. 5.10. 5.45. 5.80. 6.16. 6.51. 0.35. 2.78. 3.10. 3.43. 3.76. 4.08. 4.41. 4.74. 5.06. 5.39. 5.72. 6.04. 0.40. 2.56. 2.86. 3.17. 3.47. 3.77. 4.07. 4.37. 4.67. 4.97. 5.28. 5.58. 0.45. 2.35. 2.63. 2.90. 3.18. 3.45. 3.73. 4.01. 4.28. 4.56. 4.84. 5.11. 0.50. 2.14. 2.39. 2.64. 2.89. 3.14. 3.39. 3.64. 3.89. 4.15. 4.40. 4.65. pl. Case 3: m = 0, n ≠ 0 The equation (10) become 2 2.5126 × 10 7 (1 − pl )( 2.32 n + 17 ) . The related value of p l and n are shown in table 1.6. Table 1.6 The result of case 3 in packet analysis.. n 0. 1. 2. 3. 4. 5. 6. 7. 8. 9. 10. 0.10. 3.84. 4.37. 4.89. 5.42. 5.94. 6.47. 6.99. 7.52. 8.04. 8.57. 9.09. 0.15. 3.63. 4.13. 4.62. 5.12. 5.61. 6.11. 6.60. 7.10. 7.59. 8.09. 8.59. 0.20. 3.42. 3.88. 4.35. 4.82. 5.28. 5.75. 6.22. 6.68. 7.15. 7.61. 8.08. 0.25. 3.20. 3.64. 4.08. 4.52. 4.95. 5.39. 5.83. 6.26. 6.70. 7.14. 7.58. 0.30. 2.99. 3.40. 3.81. 4.21. 4.62. 5.03. 5.44. 5.85. 6.25. 6.66. 7.07. pl. 15.
(18) 0.35. 2.78. 3.16. 3.53. 3.91. 4.29. 4.67. 5.05. 5.43. 5.81. 6.19. 6.57. 0.40. 2.56. 2.91. 3.26. 3.61. 3.96. 4.31. 4.66. 5.01. 5.36. 5.71. 6.06. 0.45. 2.35. 2.67. 2.99. 3.31. 3.63. 3.95. 4.27. 4.59. 4.91. 5.23. 5.56. 0.50. 2.14. 2.43. 2.72. 3.01. 3.30. 3.59. 3.88. 4.18. 4.47. 4.76. 5.05. Case 4: m ≠ 0, n ≠ 0 The related value of p l and n are shown in table 1.7. Table 1.7 The result of case 4 in packet analysis.. m 0. 1. 2. 3. 4. 5. 0.10. 3.84. 4.82. 5.80. 6.77. 7.75. 8.73. 9.71 10.68 11.66 12.64 13.61. 0.15. 3.63. 4.55. 5.48. 6.40. 7.32. 8.24. 9.17 10.09 11.01 11.93 12.86. 0.20. 3.42. 4.29. 5.15. 6.02. 6.89. 7.76. 8.63. 9.50 10.36 11.23 12.10. 0.25. 3.20. 4.02. 4.83. 5.65. 6.46. 7.27. 8.09. 8.90. 9.72 10.53 11.34. 0.30. 2.99. 3.75. 4.51. 5.27. 6.03. 6.79. 7.55. 8.31. 9.07. 9.83 10.59. 0.35. 2.78. 3.48. 4.19. 4.89. 5.60. 6.30. 7.01. 7.72. 8.42. 9.13. 9.83. 0.40. 2.56. 3.21. 3.87. 4.52. 5.17. 5.82. 6.47. 7.12. 7.77. 8.42. 9.08. 0.45. 2.35. 2.95. 3.54. 4.14. 4.74. 5.33. 5.93. 6.53. 7.13. 7.72. 8.32. 0.50. 2.14. 2.68. 3.22. 3.76. 4.31. 4.85. 5.39. 5.93. 6.48. 7.02. 7.56. pl. 6. 7. 8. 9. 10. 4. Discussions From the volume of traffics analysis in subsection 3.4: table 1.2 to table 1.4, we conclude the following results. 1.. The volume of traffics is increasing at the rate about 1 percent with respect to the number of siblings which PB sends query.. 2.. The volume of traffics is increasing at the rate about 3 percent with respect to the number of siblings which send query to PB.. 16.
(19) 3.. The effect of the number of siblings which send query to PB is more significant than the number of siblings which PB sends query.. 4.. From 1 and 2, the total volume of traffics increased is ranging from 1 to 3 percent.. 5.. The local hit rate has significant influence on the volume of traffics.. On the other hand, analysis of the volume of packets in subsection 3.5: table 1.5 to table 1.7 reveals the following results. 1.. The volume of packets is increasing at the rate about 8 percent with respect to the number of siblings which PB sends query.. 2.. The volume of packets is increasing at the rate about 14 percent with respect to the number of siblings which send query to PB.. 3.. The effect of the number of siblings which send query to PB is more significant than the number of siblings which PB sends query.. 4.. From 1 and 2, the total volume of packets increased is ranging from 8 to 14 percent.. 5.. The local hit rate has significant influence on the volume of packets.. Comparing the result of volume of traffics and packets, we reached the following results. 1.. Increasing volume of traffics is ranging from 1 to 3 percent with respect to the number of siblings. The effect is contributed to the WAN traffic. That is, it consumes more bandwidth to fulfill the requests.. 2.. As the number of siblings increasing to 10, the total traffics gain is ranging from 10 to 38 percent.. 3.. Increasing volume of packets is ranging from 8 to 14 percent with respect to the number of siblings. The effect is contributed to the border router. That is, the router should robust enough to process the additional packets.. 4.. As the number of siblings increasing to 10, the total packets gain is ranging from 12 to 255 percent. The effect is contributed to the border router of the backbone network which needs to sustain double or triple packets.. In the initial and the following stages mentioned in section 2, we know that ICP do really work with caching hierarchy or mesh. When the network is not overloaded it can sustain the. 17.
(20) ICP message and work smoothly. But under the circumstance of already or near congested network, it make the cooperation in vain. From the analysis of total packets gained, the increment load of the border router makes the ICP fail to work. Moreover, become a failure point and cannot take the advantage of cooperation of caching proxy server. Another issue is that we should estimate the server capacity of a parent proxy. All the requests under this parent node will be served by the parent node. It should be robust enough in capacity to supply the services; otherwise it will become the failure point in the proxy server hierarchy. The scalability of parent proxy should also to be taken into consideration. In order to make a proxy server or cooperative proxy server system to work properly, we should take the following criteria into consideration in practical deployment. These include capacity, scalability, load balancing, reliability, and functionality. Other than functionality, the criteria must be addressed in every reasonable caching proxy server system. The functionality is to address the functions supported by the proxy server system. If it is equipped with user friendly interface that the client side need not to do other work while system updated or one of the proxy server failure. That means the system modification is transparent to the user. The overhead or additional system element needs to be set up in the system, such as network device or RAM of the proxy server system. To the maintainer of the system, is it complicated or laborious to do the maintenance work. The related functionalities are cache replacement policy, prefetching technique, transparency, adaptivity, data consistency, efficiency, capability to deal with heterogeneity and capability to support streaming media.. 5. Conclusions and Future Works In this paper, we construct an analytical model with parameters from traffic logs of regional network proxy server. From the analysis results, it reveals that the increasing packets owing to cooperative proxy server are significant to backbone router. As a result, we should take the impact of packets generated by cooperative proxy server scheme into consideration in planning and deploying cooperative proxy server system. Being a parent proxy server especially the root one in hierarchical topology, the capacity is significantly important.. 18.
(21) Finally, there are still more works both theoretical and practical left to be done in the future. It is necessary to do the analytical or quantitative analysis of alternative cache protocols to improve the performance of inter-cache group communication. It is worthwhile to do the study of content-aware mechanism to alleviate the load of router and proxy caching system. To pick up with the pace of information technology innovation, we should take the expansion of network bandwidth into consideration. The bandwidth for previous IP backbone networks deployed by Internet service providers or regional network center has been limited to 45 Mbps. Current and future IP networks provide bandwidth ranging from 155 Mbps to 2.4 Gbps. Thus, due to emerging network technologies, the capacity and scalability of proxy caching server will become a problem.. 19.
(22) References [1]. Bradley Huffaker et al., "Visualization of the Growth and Topology of the NLANR Caching Hierarchy", Proceedings of the Third International WWW Caching Workshop, Manchester, England, June 1998.. [2]. Jieun Lee et al., "Report on the Costs and Benefits of Cache Hierarchy in Korea", the Third International WWW Caching Workshop, Manchester, England, June 1998.. [3]. "DESIRE: Development of a European Service for information on Research and Education", http://www.desire.org/html/services/caching/.. [4]. Michael Baentsch et al., "the Web's Infrastructure: From Caching to Replication", IEEE Internet Computing, Vol. 1, No. 2, 1997.. [5]. Dean Provey, John Harrison, "A Distributed Internet Cache", Proceedings of the 20th Australian Computer Science Conference, Sydney, Australia, Feb. 5-7 1997.. [6]. K. Claffy, D. Wessels, "ICP and the Squid web cache", IEEE Journal on Selected Areas in Communications, pp. 345 - 357, 1997.. [7]. D. Wessels, K. Claffy, "Internet Cache Protocol (ICP), version 2" RFC 2186, September 1997.. [8]. D. Wessels, K. Claffy, "Application of Internet Cache Protocol (ICP), version 2" RFC 2187, September 1997.. [9]. Martin Hamilton, Alex Rousskov and Durane Wessels, "Cache Digest Specification Version 5", Dec. 1998.. [10]. Li Fan, Pei Cao, Jussara and Andrei Z. Broder, "Summary Cache: A Scalable Wide-Area Web Cache Sharing Protocol", IEEE/ACM Transactions on Netwoking, Vol. 8, No. 3, June 2000.. [11]. V. Valloppillil and K. W. Ross, "Cache Array Routing Protocol v1.0", Internet Draft, http://ircache.nlarnr.net/Cache/ICP/draft-vinod-carp-v1-03.txt, Feb. 1998.. [12] "Cache Array Routing Protocol (CARP) Version 2.0", White paper from Cisco Inc. [13]. Cisco Systems, "Web Cache Communication Protocol Version 2", Cisco Cache Engine User Guide, Version 2.1.0.. [14]. Proxy Server Logs of the RNC in NSYSU from 8th April 2002 to 14th April 2002, http://proxy.nsysu.edu.tw/.. 20.
(23)
數據
+7
相關文件
Reading Task 6: Genre Structure and Language Features. • Now let’s look at how language features (e.g. sentence patterns) are connected to the structure
• To introduce the use of the LPF as a tool for planning the school English Language curriculum; and
Understanding and inferring information, ideas, feelings and opinions in a range of texts with some degree of complexity, using and integrating a small range of reading
Writing texts to convey information, ideas, personal experiences and opinions on familiar topics with elaboration. Writing texts to convey information, ideas, personal
Promote project learning, mathematical modeling, and problem-based learning to strengthen the ability to integrate and apply knowledge and skills, and make. calculated
“In assessing the impact of the PNET Scheme on the professional development of local teachers, the centralised seminars have made a significant contribution and their value should
Writing texts to convey simple information, ideas, personal experiences and opinions on familiar topics with some elaboration. Writing texts to convey information, ideas,
We explicitly saw the dimensional reason for the occurrence of the magnetic catalysis on the basis of the scaling argument. However, the precise form of gap depends
compounds, focusing on their thermoelectric, half-metallic, and topological properties. Experimental people continue synthesizing novel Heusler compounds and investigating
