國立交通大學
材料科學與工程學系
博士論文
分散技術及其在奈米陶瓷和鋰電池電極製
備之應用研究
Dispersion Technology and Its Applications
to the Fabrication of Nano-ceramics and
Electrode of Lithium Ion Battery
學生姓名:應國良(
Kuo- Liang Ying)
指導教授:謝宗雍
博士(Dr. Tsung-Eong Hsieh)
分散技術及其在奈米陶瓷和鋰電池電極製備之應用研究
學生:應國良 指導教授:謝宗雍 博士 國立交通大學 材料科學與工程學系摘 要
本論文探討奈米分散技術及其在鈦酸鋇(BaTiO3,BTO)奈米陶瓷和鋰電池 中鋰鈷氧(LiCoO2)之電極製備之應用;鈦酸鋇相關之陶瓷材料包含純鈦酸鋇、鈦酸鍶鋇(Ba0.7Sr0.3TiO3,BST)和添加氧化鑭之鈦酸鍶鋇(La2O3-doped BST, LBST)。奈米陶瓷實驗中使用兩性之氨丙基丙醯胺(α-N,N-2 甲基-丙烯乙基氧, Polyacrylamide/(α-N, N-dimethyl-N-acryloyloxyethyl) Ammonium Ethanate , PDAAE)和陰離子型高分子分散劑(聚甲基丙烯酸,Poly(methacrylic Acid, PMAA-Na)為分散劑,本研究另合成一種新型之樹枝狀高分子分散劑(聚(4-4, 2 苯 胺 甲 基 苯 氧 基 鄰 苯 二 甲 酐 ), Poly(4-{4-[di(4-aminophenyl)methyl] phenoxy}phthalic Ether Imide,PEI)以分散奈米碳管(Carbon Nanotube,CNT) 並應用於鋰電池鋰鈷氧電極基板 之製備中,以提高鋰電池之效能。 奈米鈦酸鍶鋇及其相關之陶瓷係利用物理研磨加上化學分散進行製備漿 料,分散效果之測試包含:黏度、沈降體積、表面電位和高分子分散劑之吸附量 來判斷粉體之分散狀況,之後奈米粉體再經過適當之燒結過程而製成電容並測試 其相關之介電性質。實驗中發現,控制燒結環境條件可將奈米陶瓷粉末燒結成具 有良好之微結構、結晶相和介電特性之電容元件。
結可獲得小晶粒、高密度和良好之介電性質(室溫下介電常數為 8000,介電損 失為 5×10⁻³)之電容元件。其次,高密度(≥ 95%)、高介電性質之奈米鈦酸鍶 鋇電容可藉1200°C、6 小時燒結製程(晶粒大小約為 200 nm,室溫下介電常數 為9700,介電損失為 0.04)或 1300°C、1 小時燒結製程(晶粒大小約為 220 nm, 室溫下介電常數為9800,介電損失為 0.075)而獲得。此外,奈米鈦酸鍶鋇電容 相較於傳統之鈦酸鋇及鈦酸鍶鋇具有較低之居禮溫度。最後,添加1 mol.%氧化 鑭之鈦酸鍶鋇經由1400°C、1 小時燒結可得晶粒大小約為 200 nm、最佳之介電 常數為13800 和最低之介電損失 2.8×10⁻⁴之電容元件。 在關於奈米碳管之分散部分,經由等溫吸附曲線、流變和沈降實驗得知PEI 之最佳劑量為 2 wt.%(此係相對於奈米碳管重量之比例)。由電化學阻抗光譜
(Electrochemical impedance spectroscopy,EIS)之量測得發現電池之交流阻抗由 287 Ω(電極未添加 PEI)降至 161 Ω(電極中含 2 wt.%之 PEI),而其主要之原 因為分散良好之奈米碳管在電極中形成一網狀結構並藉此提供良好之電荷轉移 路徑。在充放電實驗(Charge-discharge Test)中發現,電極含分散良好之奈米碳 管之鋰電池在大電流放電下(8 C)其放電容值仍可維持在 74 %(電流密度為 101 mAh/g),高放電容量和較長之壽命將有助於大型鋰電池在高電源工具、電動腳 踏車、電動摩托車等之應用。
Dispersion Technology and Its Applications to the Fabrication of
Nano-ceramics and Electrode of Lithium Ion Battery
Student: Kuo-Liang Ying Advisor: Dr. Tsung-Eong Hsieh
Department of Materials Science and Engineering National Chiao-Tung University
Abstract
This thesis discusses the dispersion technology and their applications to the fabrication of barium titanate (BaTiO3, BTO)-relating nano-ceramics and LiCoO2 electrode of lithium ion battery (LIB). The BTO-relating ceramics include the genuine BTO, Ba0.7Sr0.3TiO3 (BST) and La2O3-doped BST (LBST). An amphibious dispersant, polyacrylamide/(α-N, N-dimethyl-N-acryloyloxyethyl) ammonium ethanate (PDAAE), and an anionic dispersant, poly(methacrylic acid) (PMAA-Na), were adopted to the dispersion of nano-ceramics. A new dispersant, poly(4-{4-[di(4-aminophenyl)methyl]phenoxy}phthalic ether imide) (PEI), was synthesized for the dispersion of carbon nanotube (CNT) conduction agent in LiCoO2 electrode so as to improve the performance of high power LIBs.
BST-relating nano-ceramic powders were prepared via a physical grinding in conjunction with the chemical dispersion. Dispersion properties including viscosity, sedimentation volume, particle size distribution, zeta-potential and isothermal adsorption were investigated so as to determine the optimal dispersion condition. The capacitor samples were then prepared by appropriate sintering process and then
dielectric property measurement was followed. It was found that specific control on sintering condition is required for the nano-ceramic powders to achieve desired microstructure, crystalline phase and dielectric properties of devices.
The major achievements in BTO-relating nano-ceramics are as follows. BTO sample sintered at 1100°C for 6 hrs possesses relatively small grain sizes (about 140 nm), high density (about 95% T.D.) and distinct room-temperature dielectric properties (dielectric constant = 8000; dielectric loss = 5×10⁻³). High-density (≥ 95%) BST samples with desired dielectric properties could be obtained via sintering at 1200°C for 6 hrs (grain size ≈ 200 nm; dielectric constant = 9700; dielectric loss = 0.04) or at 1300°C for 1 hr (grain size ≈ 220 nm; dielectric constant = 9800; dielectric loss = 0.075). Besides, the BST samples exhibited a lower Curie point (TC) in
comparison with conventional BTO and BST systems. The 1.0 mol.% La-doped BST sample sintered at 1400°C for 1 hr possesses the finest grain size about 200 nm, the highest dielectric constant about 13800 and lowest dielectric loss about 2.8×10⁻⁴.
In the part relating to the dispersion of CNT, the optimal amount of PEI (about 2 wt.% relating to the weight of CNT) was determined by means of the studies of adsorption isotherm, rheology and sedimentation behaviors. Electrochemical impedance spectroscopy (EIS) revealed that the ac resistance of electrode decreases from 287 Ω for cell without PEI to 161Ω for the cell at containing optimal amount of PEI. This is attributed to the network established by dispersed CNTs that effectively promotes the charge carrier migration in electrode. The C-rate test indicated that at the high-rate discharge test results, that the LIB test cell with modified electrode possesses 8 C-discharge capacity of 101 mAh/g, which is about 74% of its 0.2 C-discharge capacity. The results of high rate capability and long cycle life evidences the promising applications of such a LIB to power sources, e.g., power tools, electric
致 謝
在實驗室中也要特別感恩小麥、榮正、宜豐、賀昌、小 a 還有其他學弟、妹 的幫忙,在我最後一段日子中對我的一路相挺,這份恩情我也會銘記在心中(尤 其是小麥和正哥),真是感恩了。在這實驗室中,我唯一遺憾的是我的好朋友重 伊不能和我一起畢業,回想當初一起打拼但終究不能一起走,讓我有些遺憾,我 真心的祝福他能一切順利並能拿到這學位,未來可以再一起努力。此外,也要感 謝閎康科技的總經理謝詠芬博士在我實驗上的諸多指導並且能給我機會能在閎 康學到許多學校沒辦法教的事,真的非常感恩。另外,也感恩工研院的林人傑學 長、盧俊安學長和陳金銘博士在我實驗上的幫忙,謝謝。 最後,我要感恩我的父母和兄長,他們總是默默的支持我並且鼓勵我,真是 非常感恩。此外,吾妻在我這段唸書期間獨自扛起家計而讓我能專心於學業,並 且總是扮演開心果的角色,因此每當我回到家內心總能得到溫暖,因此心情就能 放鬆而能迎接每次的挑戰,真的感恩您,欣宜。 最後,感恩一切大眾,感恩了Contents
摘 要...i
Abstract... iii
致 謝...v
Contents ...vi
List of Figures ...xi
Table Captions ... xviii
List of Symbols ...xix
CHAPTER 1 Introduction……….1
CHAPTER 2 Literature Review………4
2.1 Nano Powder Dispersive theory………..4
2.1.1 Interparticle Force………4
2.1.2 DLVO Theory………6
2.1.3 Electrostatic Double Layer Forces………7
2.1.4 Polymer Induced stabilization………...9
2.2. The Characteristics of Barium Titanate (BTO)……….12
2.2.1 Surface Chemistry of BTO……….….12
2.2.3. The Sintering Behavior of BTO………..18
2.2.4. The Electrical Properties of BTO………...20
2-3. Introduction to LIBs……….………….…24
2-4. CNT-based Anode in LIBs………...……….27
2.5. Motivation……….28
2.5.1. Nano BTO-relating Ceramics………..28
2.5.2. Dispersion of CNTs in LiCoO2 electrode of LIBs………...29
Chapter 3 Experiment Methods………..….31
3.1. Dispersion and Preparation of nano ceramic materials………31
3.1.1 Raw materials………..31
3.1.2 Chemical Dispersant……….……...…………...33
3.1.3 The Experimental Flow Diagram………34
3.2 Characterizations of Aqueous Slurries……….38
3.2.1. Particle size Distribution………38
3.2.2. Zeta potential ……….38
3.2.3. Viscosity……….38
3.2.4. Adsorption of Dispersant………39
3.3 Characterizations of Sintered Samples………..……….………39
3.3.2. Microstructure……….40
3.3.3. The Phase Identification of Materials……….40
3.3.4. Dielectric Properties………...41
3.4. Dispersion of CNTs………..………41
3.4.1. Synthesize of PEI………41
3.4.2. Experimental Flow of LIB Experiment………...46
3.4.3. Optical Microscope……….48
3.4.4. Viscosity measurement………...49
3.4.5. Adsorption of Dispersant………49
3.4.6. The Microstructure Observation………....49
3.4.7. Cyclic Voltammograms………...49
3.4.8. Electrical Characterizations………...50
Chapter 4 Results and Discussion………51
4.1. Dispersion and Preparation of Nano-scale BTO materials………51
4.1.1. Rheological Behaviors………51
4.1.2. Particle Size Distribution………53
4.1.3. Zeta Potentials………...56
4.1.4. Adsorption of Dispersants on BTO………....60
4.1.6. Phase Constitution………...69
4.1.7. Dielectric Properties………70
4.2 Preparation nano Nano-Ba0.7Sr0.3TiO3 Ceramic and Their characteristics….74 4.2.1. Dispersion and Preparation of Nano-Ba0.7Sr0.3TiO3 Ceramic…….75
4.2.2. Sintering Behaviors and Microstructure Evolution……….76
4.2.3. Dielectric Properties………83
4.2.4. Characterization of TC……...………..86
4.3. Preparation and Characterizations of La-doped BST Ceramics…………...88
4.3.1. Dispersion and Preparation of LBST………88
4.3.2. Sintering Behaviors and Microstructure Evolution………..91
4.3.3. Dielectric Properties……….98
4.3.4. Characterization of TC………..101
4.4. Dispersion of CNTs and Its Application to LiCoO2 Electrode in LIBs…103 4.4.1. Monomer Synthesis………...103
4.4.2. PEI Synthesis and Characterizations……….……103
4.4.3. Adsorption Isotherm………..105
4.4.4. Rheological Behaviors………..108
4.4.5. Sedimentation Behaviors……….111
4.4.8. C-rate Performance of LIB………...116
Chapter 5 Conclusions………...120
Chapter 6 Future Work and Prospects………123
References………..125
List of Figures
Figure 2-1. Illustration of the relationship between the total interparticle interaction
potential energy and resulting suspension structure...5
Figure 2-2. The DLVO theory relative figure……….7
Figure 2-3. Structure of the electrical double layer………9
Figure 2-4. Conformations of homopolymer chains at the surface of a colloidal particle showing schematically trains, loops and tails……….10
Figure 2-5. Steric stabilization of colloidal particles………...11
Figure 2-6. BaO-TiO2 binary alloy phase diagram………..………14
Figure 2-7. Ion position in ideal perovskite structure………..15
Figure 2-8. Ion position in tetragonal BTO……….….16
Figure 2-9. Structural variation of BTO unit cell……….16
Figure 2-10. Temperature dependence constant. ………..………...17
Figure 2-11. Schematic figure of domain structure………..18
Figure 2-12 The grain and hole changing behavior in different sintering process…...20
Figure 2-13. Effect of grain size on measured values of dielectric constant for BTO ceramics with grain sizes ranging from 1-50 µm………...………..22
Figure 2-14. Effect of isovalent substitution on TC of BTO composition………24
Figure 2-15. Schematic illustration of LIBs……….27
Figure 3-1. The structure of MiniZeta ………...………..32
Figure 3-2. Experimental flow of BTO specimens………..35
Figure 3-3 Experimental flow of BST specimens………36
Figure 3-4 Experimental flow of LBST specimens……….37
Figure 3-5. Chemical Structure of PEI……….45
Figure 3-6. Experimental flow for LIB experiment……….47
Figure 3-7. The coin cell assembly of LIB test cell……….48
Figure 4-1. The effect of dispersant concentration on the viscosity of 60 wt.% BTO suspensions subjected to various grinding/mixing processes………..52
Figure 4-2. The effect of dispersant concentration on the mean particle size (d50) of powder in 30 wt.% BTO suspensions subjected to different grinding/mixing processes………...54
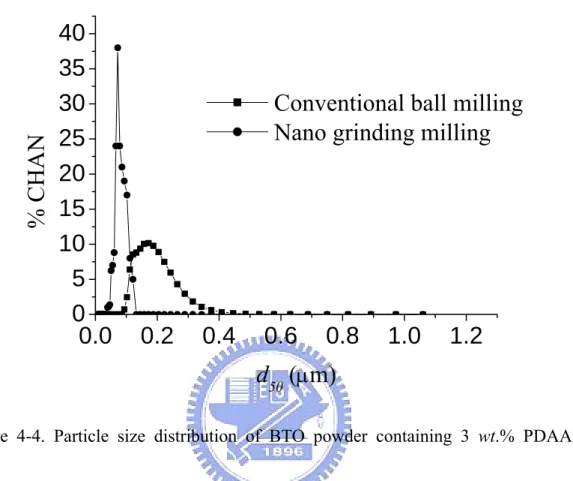
Figure 4-3. Particle size distribution of BTO powder containing 2 wt.% PMAA-Na subjected to conventional ball milling and nano grinding/mixing processes………..56
Figure 4-4. Particle size distribution of BTO powder containing 3 wt.% PDAAE subjected to conventional ball milling and nano grinding/mixing processes….……..57
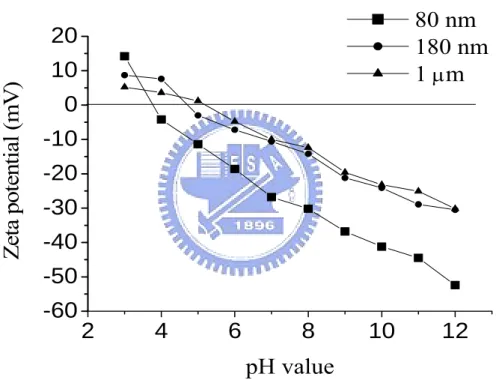
Figure 4-6. Zeta potentials of BTO suspensions containing different chemical
dispersants………59
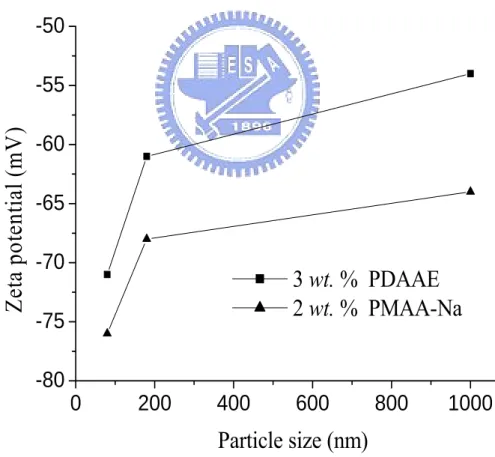
Figure 4-7. Specific adsorption of PMAA-Na on BTO of different particle sizes…..61
Figure 4-8. Specific adsorption of PDAAE on BTO particles of different particle
sizes………..62
Figure 4-9. Langmuir analysis for the suspension containing PMAA-Na…………..63
Figure 4-10. Langmuir analysis for the suspension containing PDAAE……….64
Figure 4-11. SEM Micrograph of nano-sized BTO powders subjected to chemical
dispersion and physical grinding/mixing process………65
Figure 4-12. SEM Micrographs of nano-BTO sintered at (a) 1100°C (b) 1200°C (c)
1300°C for 6 hrs………..67
Figure 4-13. Relative density change versus sintering times at different
temperatures……….68
Figure 4-14. The relative density and grain size versus sintering time of sample
sintered at 1100°C………68
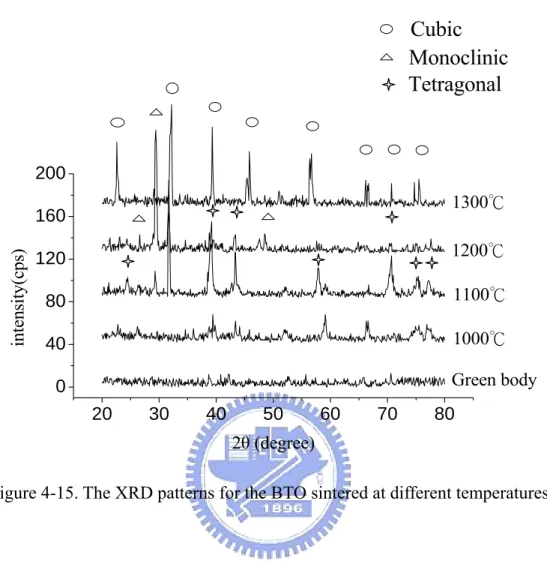
Figure 4-15. The XRD patterns for the BTO sintered at different temperatures……..70
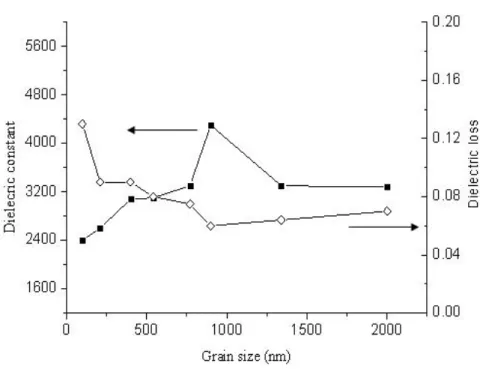
Figure 4-16. 1-kHz dielectric constants and loss versus grain sizes of nano-BTO
sintered at 1100°C………...72
1200°C………73
Figure 4-18. 1-kHz dielectric constants and loss versus grain sizes of BTO sintered at
1300°C……….74
Figure 4-19. SEM micrograph of nano-scale BST powders subjected to chemical
dispersion and physical grinding process……….76
Figure 4-20. Particle size distribution of nano-BST powder in the slurry subjected to
chemical dispersion and physical grinding process………77
Figure 4-21. Viscosity of aqueous suspensions containing nano-BST powder and 5
wt.% of PDAAE as a function of shear rate……….77 Figure 4-22. Relative density change of nano-BST samples versus sintering
temperature………..78
Figure 4-23. SEM micrographs of nano-BST samples sintered at 1200°C for (a) 1 hr,
(b) 3 hrs, (c) 6 hrs (d) 8 hrs………..80
Figure 4-24. SEM micrographs of nano-BST samples sintered at 1300°C for (a) 1 hr,
(b) 3 hrs, (c) 6 hrs and (d) 8 hrs………81
Figure 4-25. The XRD patterns for the BST sample sintered at different temperatures.
………..82
Figure 4-26. 1-kHz dielectric constant and dielectric loss of nano-BST samples
Figure 4-27. 1-kHz dielectric constant and dielectric loss of nano-BST samples
sintered at 1300°C versus sintering time………..85
Figure 4-28. The dielectric constants of BST sample sintered at 1200 and 1300°C for
1 hr as a function of temperature………..88
Figure 4-29. The effect of dispersant concentration on the viscosity of 1.0LBST
suspensions subjected to various grinding/mixing processes………..90
Figure 4-30. Particle size distribution of nano-xLBST powder in the slurry subjected
to chemical dispersion and physical grinding process………...90
Fig. 4-31. Relative densities of BST and xLBST samples sintered at various
temperatures for 1 hr………92
Fig. 4-32. Average grain sizes of the BST and the LBST samples as a function of
sintering temperature deduced from SEM observatio……….92
Fig. 4-33. SEM micrographs of BST samples doped with: (a) BST (b) 0.5LBST (c).
1.0LBST (d) 1.5LBST sample subjected to 1400°C/1-hr sintering………94
Figure 4-34. TEM image (a) 0.5 LBST (b) 1.0 LBST...95
Fig. 4-35. XRD patterns for raw LBST powder and xLBST samples sintered at
1400°C for 1 hr………97
Fig. 4-36. XRD patterns for 1.0 LBST sample sintered at different temperatures…..97
1.0LBST sample sintered at 1400°C for 1 hr………..98
Figure 4-38. 1-kHz dielectric constant and dielectric loss of 1.0 LBST samples
sintered at versus sintering temperature……….101
Figure 4-39. The dielectric constants of LBST sample sintered at 1400°C for 1 hr as a
function of temperature………..102
Figure 4-40. (a) 1H-NMR spectrum, and (b) molecule structure of compound 3…..104
Figure 4-41. (a) 1H-NMR spectrum, and (b) molecule structure of PEI………105
Figure 4-42. FTIR spectra of PEI………...105
Figure 4-43. The adsorption amount of PEI on CNT as a function of the initial PEI
concentration……..………107
Figure 4-44. Plot of Fig. 4-43’s data in terms of the Langmuir adsorption analysis.107
Figure 4-45. (a) Shear rate dependence of steady-state viscosity for CNT slurries
containing various amounts of PEI. (b) Shear rate dependence of thixotropic-state
shear stress for CNT slurries without or with 2 wt.% PEI……….110
Figure 4-46. Sedimentation volume of CNTs slurries as a function of PEI
concentration…………..………112
Figure 4-47. The OM morphology of CNTs slurry (a) without and (b) with PEI
dispersant………..……….113
0 wt.%; (b) 1 wt.%; (c) 2 wt.%; (d) 3.5 wt.%...114
Figure 4-49. The ac impedance profiles of the LiCoO2 electrodes containing various
amounts of PEI in the half cells measured by EIS……….115
Figure 4-50. Cycle voltammograms of LIB test cells without or with 2 wt. PEI in
LiCoO2 electrode………117
Figure 4-51. The cycle performance at 1 C rate of test battery cells without or with 2
wt. PEI in LiCoO2 electrode at the rate of 1.0-C current density………...117
Figure 4-52. Discharge curves of LIB test cells without or with 2 wt. PEI in LiCoO2
electrode. The two nearly overlapped profiles on the top of the figure are the charging
Table Captions
Table 2-1. Ionic radius and dopants to replace sites in ABO3……….25
Table 3-1. Properties of chemical dispersants……….32
Table 4-1. Critical dispersant concentrations to reach the adsorption plateau……….61
Table 4-2. Monolayer absorption of dispersants on BTO surface………64
Table 4-3. The EDS analysis of Ba:Ti ratio of samples sintered at different
temperatures for 6 hrs………...………70
List of Symbols
C: capacitance
εr: relative dielectric constant
ε0: dielectric constant in vacuum
d50: mean particle size
Ce: equilibrium concentration of dispersants in solution As: adsorbent of the dispersant
CHAPTER 1
Introduction
Emergence of nano-materials has attracted numerous research interests in last
decade. Nano-materials involve fundamental studies in various fields of physics and
chemistry as well as the applications in electronics, mechanics, biotechnology, etc. A
major difficulty encountered in the study of nano-scale materials is their
appgrgation.1-3 When the size of materials is reduced to nano-scale, they tend to
aggregate together due to the van der Waals force attraction resulted from large
specific surface area (SSA). Appropriate dispersive technique is hence one of the key
issues to realize the applications of nano-materials in various occassions.3,4
Colloidal processing comprises of the dispersion of fine ceramic particles in a
liquid medium and subsequent consolidation of the colloidal particle. This assists in
producing a uniform microstructure and high packing density for the powder
compaction.5-8 The dispersibility of the colloidal suspension affects both the sintering
behaviors and resultant properties of the dense ceramics. Dispersants such as
polyacrylic acid, ammonium salt of polyacryloc acid, polymethacrylic acid,
ammonium polymethacrylate and phosphate ester are added to prepare a stable
first part of this thesis study, we investigate the dispersion method and preparation of
nano-scale BTO-relating (BTO, BST and La-doped BST) ceramic powders via a
combination process of mechanical grinding and chemical dispersion utilizing the
known PDAAE and PMAA-Na dispersants. The sintering behavior, microstructure
changes and dielectric properties of capacitor samples fabricated based on such
nano-ceramic powders were investigated accordingly. Experimental results showed
that the nano-ceramic samples possess relatively small grain sizes, high density and
distinct room-temperature dielectric properties under a specific control on the
sintering condition of samples. For nano-BTO sample, dielectric constant = 8000 and
dielectric loss = 5×10⁻³ were achieved. For nano-BST sample, dielectric constant =
9700 and dielectric loss = 0.04 were achieved. The dramatic improvement of
dielectric properties in comparison with conventional BTO-relating ceramics was
mainly attributed to the fine microstructure in the samples. As to the La-doped BST
sample, the best dielectric properties are dielectric constant about 13800 and lowest
dielectric loss about 2.8×10⁻⁴. This was ascribed to the fine microstructure as well as
the segregation of La elements in the grain boundaries which enhance the electrical
polarization in the samples
In second part of this thesis study, we first synthesized a new chemical dispersant,
highly polar solvent, N-methyl pyrrolidone (NMP). The dispersant was then
implanted to the dispersion of CNT which serves as the conduction agent of electrode
in LIBs. The optimal dispersant content (relating to the weight of CNT) was
determined as 2 wt.% by means of the studies of adsorption isotherm, rheology and
sedimentation behaviors. Electrochemical impedance spectroscopy (EIS) revealed that
the ac resistance of electrode decreases from 287 Ω for cell without PEI to 161Ω for
the cell at containing optimal amount of PEI. This is attributed to the network
established by dispersed CNTs that effectively promotes the charge carrier migration
in electrode. The cycling performance showed that the test cell containing 2 wt.% PEI
obviously exhibits the better capacity retention in comparison with the cell free of PEI.
The C-rate test indicated that at the high-rate discharge test results, that the LIB test
cell with modified electrode possesses 8 C-discharge capacity of 101 mAh/g, which is
about 74% of its 0.2 C-discharge capacity. The results of high rate capability and long
cycle life evidences the promising applications of such a LIB to power sources, e.g.,
CHAPTER 2
Literature Review
2.1. Dispersive Theory
2.1.1. Inter-particle Force13
The importance of inter-particle forces can be realized from the consideration of
the stability of colloidal dispersion in medium. By controlling the inter-particle forces,
colloidal suspension are able to disperse in various conditions, e.g., weakly
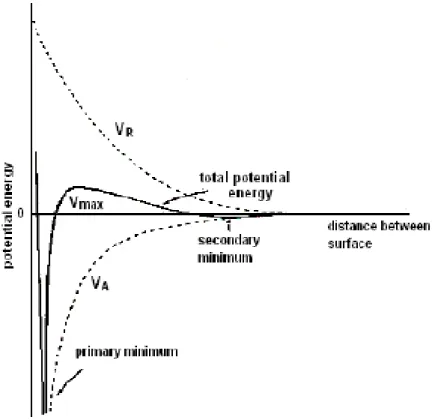
flocculation, or strongly flocculation, as shown in Fig. 2-1. From the plot of potential
energy versus particle separation, the particles repel one another when they approach
to a close distance and the positive potential implies the repulsive force in a
well-dispersed state. In the weakly flocculate state, particles coagulate in a secondary
minimum, forming flocs in a suspension. Mechanical forces, especially the shear
force can disperse the flocs. In the strongly flocculated state, particles aggregate
strongly by a primary minimum attractive force, forming clusters in the suspension.
Colloidal stability in ceramic systems is dominate by the total inter-particle
energy, Etotal, which can be simply expressed as
where EvdW is the attractive interaction due to short-range van der Waals interactions
between particles, Eelect is the repulsive potential resulting from electrostatic
interactions between charged particle surface, and Esteric is the repulsion between
particle surfaces bearing polymeric species. The first two terms of Eq. (2.1) constitute
the major part of Derjaguin-Landau-Verwey-Overbeek (DLVO) theory. Brief
considerations of the theories underlying each of interaction are described as follows.
Figure 2-1. Illustration of the relationship between the total inter-particle interaction
2.1.2. DLVO Theory14-17
DLVO theory was simultaneously developed by Derjaguin, Landau, Verwey, and
Overbeek.14-17 It is the interaction between charged particles. The theory is a central
concept for predicting colloidal stability. In the theory, the repulsive electrostatic term
is the source for a stable suspension and an attractive van der Waals force induces
flocculation of the particles. Under such a competition of two opposite forces, the
theory offers the understanding of colloidal powder processing phenomena.
According to the DLVO theory, the total energy between two particles is given
by
Vtotal, DLVO = VvdW + Velect (2.2)
where the Vtotal DLVO is the total energy, VvdW is the van der Waals attractive force, Velect
is the electric repulsive force.
The total energy relationship to distance is shown in Fig. 2-2. This curve showed
the Vmax (i.e., the energy barrier). Some particles can pass through energy barrier to
lowest energy state (primary minimum) and reach a stable coagulation when particles
get close to each other. The work of the dispersant will increase the value of Vmax and
In the view of long range forces, the attractive van der Waals forces, FvdW, is
noticeably insensitive to variation in electrolyte concentration and pH value, and thus
it may be considered as constant in a first approximation. In contrast, at small enough
distances, the van der Waals attraction always exceeds the electrostatic repulsion. The
electrostatic interaction, in fact, rises more slowly as the separation distance approach
zero.16,17
Figure 2-2. DLVO theory: the plot of total energy versus distance.
Electrostatic forces repel the ions of same charge but attract oppositely charged
ones into a thin, non-shear layer next to surface. Hence, in the polar liquid media,
particles are able to develop a charge at the solid-liquid interface. Although net charge
neutrality must be achieved, a difference in electrical potential between the surface
and the bulk solution can be maintained, as shown in Fig. 2-3.18
(2) Zeta Potential
The electric potential at the shear plane is called a zeta potential. The zeta
potential measured by an electrophoresis technique; the sign of zeta potential is the
same sign of the surface charge. If all the particles in a suspension have a large
negative or positive zeta potential then they will tend to repel each other. On the other
hand, if the particles have a low zeta potential value, then there will be much less
force to preclude the particles from coming together, and resulting in fluctuation. The
general dividing line between stable and unstable suspensions with micro ceramic
particles is generally taken at +30 or −30 mV. Particle with zeta potentials greater than
Figure 2-3. Structure of the electrical double layer.
2.1.4. Polymer Induced stabilization
Polymers are usually applied as dispersants in ceramic colloidal processing.
Steric stabilization of colloidal particles is imparted by the polymer attached to the
particle surface. Since the spatial extensions of polymer molecules are usually in
excess of the range of van der Waals attraction between colloidal particles, the
polymers are capable of offering repulsion. One major advantage of polymers is that
their dimensions are sensitive to electrolyte concentration, unlike electrical double
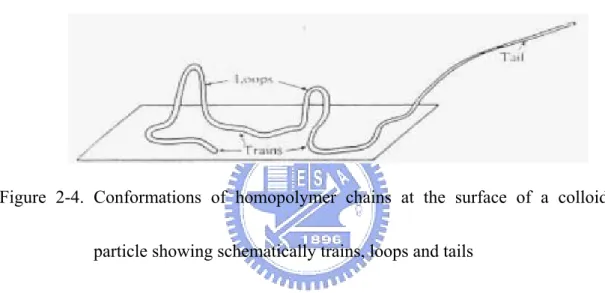
The spatial extension of polymer molecules depends upon the mode of
adsorption on the surface. If the chains are attached terminally at one end, they are
referred to as tails. Terminal adsorption at both ends leads to loops. All segments
abutting on the surface are termed trains. Schematic illustrations are shown in Fig.
2-4.22,23
Figure 2-4. Conformations of homopolymer chains at the surface of a colloidal
particle showing schematically trains, loops and tails
(2) Steric Forces
When two surfaces covered with polymer approach each other, once the
separation distance is below a few radius of gyration, the outer segments start to
overlap, which often results in a repulsive osmotic force because of the unfavorable
entropy that occurs when the chains are compressed between the surfaces. This
repulsion is usually referred to as the steric force as illustrated in Fig. 2-5.13 To be
the van der Waals attraction can be overwhelmed and bridging flocculation would be
avoided. Besides, such polymers should be anchored strongly onto the particle surface
to prevent desorption during particle collisions. Additionally, the thickness, the
amount of the absorbed polymer, and solvency of the adsorbed polymer layers, and
the affinity of the polymer to surface are all noticeable interrelated.13,24
Figure 2-5. Steric stabilization of colloidal particles
(3). Electrosteric Forces
Electrosteric stabilization depicts how polyelectrolyte dispersants are utilized to
induce electrostatic and steric repulsions to control colloidal stability. Polyelectrolyte
adsorption is remarkably affected by the chemical and physical properties of particle
surface. Adsorption is strongly favored when polyelectrolyte species and the colloid
solution.13
For thicker adsorbed layer with extending chains protruding into the solution, the
polymeric contribution becomes more significant. For examples, the PDAAE and
PMAA, the principal mechanism of stabilization should be electrostatic and steric
force. Besides the steric contribution there is always an electrostatic contribution,
since the adsorption of highly charged polyelectolytes on a weakly charged particles
surface often causes an increase in the net charge density.23,24
2.2. The Characteristics of Barium Titanate (BTO)
2.2.1. Surface Chemistry of BTO
It has been reported that when BTO is milled in deionized water, Ba2+ ions are
leached out from the powder. That would result in a Ti-rich surface. It is also found
that the level of Ba2+ leaching is dependent upon the pH of solution. The reason for
the unfavorable effects is the instability of alkaline earth titanates in water, which has
been experimentally observed first on calcium titanate (CaTiO3). The reaction of
BaTiO3 in H2O are
BaTiO3 + 2H+→ Ba2+ +TiO2 +H2O (2.3)
BaTiO3 + H2O → Ba2+ +TiO2 +2OH− (2.4)
The dissolution of Ba2+ ion not only change Ba/Ti ration of particle surface, but
also affect the pH value of solution. In the other way, leached Ba2+ ions would be
reposited on the powder surface during dry period, and result in exaggerated grain
growth and sintered density.23
2.2.2. The Properties of BTO25-31
BTO-based compounds are the most important ferroelectric materials frequently
used as capacitor materials for their excellent dielectric properties. The crystal
structure of BTO is simple perovskite, so BTO can easily form solid solutions with
other oxides. This is the reason why BTO is most widely used in various electronic
applications.
BTiO powders are synthesized conventional by solid-state reaction of titanium
dioxide (TiO2) and barium carbonate (BaCO3). After mixing, the powders are calcined
in a temperature of 1250 to 1350°C. The reaction can be shown as
The phase diagram in BaO-TiO2 system is shown in Fig. 2-6. BTO is formed
when the stoichiometric ratio of TiO2/BaO was nearly unity. Figure 2-6 also shows
various crystal structures of BTO. Above 1460°C, the structure of BTO is a
non-ferroelectric hexagonal form. The hexagonal phase transforms to cubic phase (i.e.,
the perovskite type shown in Fig. 2-7) when temperature is below 1460°C.
Figure 2-7. Ion position in ideal perovskite structure.
In perovskite BTO, the Ba2+ ion with the ionic size about 0.159 nm locates at the
corner site of cubic crystal and Ti4+ with the ionic size about 0.061 nm locates at the
body center site of this crystal. The O2− ions located at the face-center site of the
crystal and are octahedron formed to surround the Ti4+.25-28
The cubic crystal is one of symmetrical paraelectric materials, and has no
behavior of spontaneous polarization. Below 130°C, the perovskite-type structure
elongates along the plane (001). This temperature of phase transformation is termed
as Curie temperature (TC). The cell of tetragonal phase with the lattice constant c
larger than a is formed as shown in Fig. 2-8. The Ti4+ ion was deviation from the
center of the crystal, and dielectric dipole is formed in the crystal.29,30
Upon further cooling, another two polymorphic transitions occur at 0°C and
−90°C. The orthorhombic phase with elongation along a body diagonal is formed at
−90°C as shown in Fig. 2-9. In each temperature range, the direction of ferroelectric
dipole parallels the elongation of the unite cell. The relationship of dielectric constant
versus temperature is given in Fig. 2-10.
Figure 2-10. Temperature dependence dielectric constant.
The interface between domain and domain is called “domain wall” or “domain
boundary”. As the differential of polarization between domains is 180°, the domains
are termed the 180° domains; whereas, the differential of polarization is 90°, the
domains are termed the 90° domains. The domain structure is illustrated in Fig. 2-11.
The 90° domains of BTO exhibit a lamellae shape varied from micro thickness.28
Due to phase transformation of BTO takes place during cooling through TC, the
crystal structure transforms from cubic crystal into tetragonal one, leading to the
increase of c and decrease of a lattice constant. The change of lattice constant may
produce stress within the structure. In single crystal, the stress can be released without
any stress concentration by free surface. Whereas, for polycrystalline BTO, the
formation of 90° domains.31
Figure 2-11. Schematic illustration of domain structure.
2.2.3. The Sintering Behavior of BTO32-41
The solid sintering process can be divided into the initial stage, the intermediate
stage and the final stage as illustrated in Figure 2-12. The green body can be treated as
loose powders bonded by polymeric binder. In the initial stage: the powders start to
combine with each other in order to reduce the total surface free energy. As the area
of intimate contact between powders dramatically increases and the intra-particle
holes start to round-up, the sintering process would step into the intermediate stage. In
this stage, there are open holes which allow the flow out of gas from the interior to
promotes the densification. In this stage, diffusion would dominate the atom
movement so as to induce the lattice rearrangement aw well as the grain growth. In
final stage of sintering, the open holes nearly diminish; their diminution eliminates the
barrier of gain growth and thus grain coarsening becomes obvious.
Figure 2-12. Structure evolution of sintering process.
The co-existence of abnormal grain growth and increase of densification in BTO
was first reported by Xue et al.32 However, most reports pointed out that pores are
easily trapped into abnormal grain.
Schmelz proposed that a solid-state diffusion controlled mechanism is dominated
in initial shrinkage of BTO as the temperature is 1000°C below the eutectic
temperature (at 1250°C).33 On the other hand, Enomoto et al. and Xue suggested that
sintering of BTO.34,35
As sintering proceeds, the dominant mechanism is under investigation for many
years. Anderson suggested that the species dominating the diffusion is oxygen
vacancy in the initial stage of sintering of BTO by the analysis of sintering kinetics.36
The result was also supported by Nowontny et al.37
Various fluxes are added in electric ceramics to promote the sintering rate. The
addition of fluxes, such as LiF and 4PbO-B2O3 can lower the sintering temperature to
yield dense BTO.38,39
Most of the studies relating to sintering of BTO concentrated on the liquid-phase
sintering.40 Nevertheless, liquid-phase sintering may cause the abnormal grain growth
and consequently low the relative permittivity. The amount of liquid phase, the
solubility of solid phase in liquid, good wetting and grain size of BTO are important
as far as good electrical properties are concerned.41
2.2.4. The Electrical Properties of BTO
An enhancement of the dielectric constant (εr), for fine grain (≈ 1 µm) BTO
ceramics below TC, was reported as early as 1981.34 When BTO ceramics are
prepared with a grain size as small as 0.5- 1 µm, the εr values below TC, become
εr≈ 1500 for coarse grain (50 µm) ceramics at room temperature. The effect is clearly
illustrated in the data reported by Enomoto and Yamaji, as shown in Fig. 2-13.34 The
value of 5000 for fine-grain microstructures was suggested by Buessem et al., and
Martirena et al.42,43 These authors ascribed the high relative permittivity observed in
the fine grained BTO to of high internal stress in fine-grained BTO. No 90° domains
can exist in fine-grained BTO whose grain size is smaller than 1 µm. The internal
stress of fine-grained BTO is increased when the lattice is distorted below Curie
temperature. It is due to the absence of stress relaxation by the formation of 90°
domains as normally shown in coarse grains.42,43 With further reduction in grain size
below 0.5 to 1.0 µm, the εr value in the tetragonal phase was observed to decrease
again. This behavior is illustrated in the data reported by Arlt et al.44 Due to practical
difficulties in preparing dense BTO ceramics with a grain size less than 0.5 µm, little
data has been reported for εr values below that grain size. Most importantly, a
rigorous explanation of the effect has remained elusive. Arlt et al., proposed that the
decrease in εr resulted from changes in crystal structure (i.e., a “pseudocubic”
structure, not tetragonal structure) with grain size reduction.
The electric properties of BTO depend highly on its microstructure. For the
commercial BTO dielectrics, doping with various elements to tailor the dielectrics
substitution, donor doping, and acceptor doping.
Figure 2-13. Effect of grain size on measured values of dielectric constant for BTO
ceramics with grain sizes ranging from 1-50 µm.
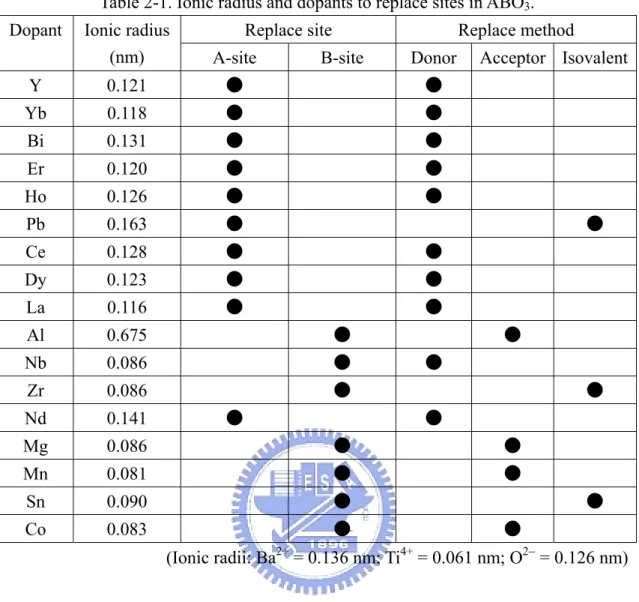
The ion that has the similar ionic radius as Ba2+ or Ti4+ or has same valence as
Ba2+ or Ti4+ can easily substitute the site of Ba2+ or Ti4+ in BTO lattice. The frequent
et al. for replacing Ti4+. If the effect of dopants can change the T
C, the dopants are
named the shifter of TC, e.g., the Sr2+ and Pb2+ shown in Fig. 2-14. On the other hand,
extending the temperature range of usage is also important. For the modification of
BTO-based capacitors in a wider temperature range, Zr4+, and Hf4+ are usually added
to modify the dielectric coefficient with temperature. Another type of dopants that are
useful in formulating BTO dielectric are know as Curie-peak broadeners.41-45
Donor doping is the doping of excess-valance ions in order to replace the metal
ions in the lattice. For instance, Nd3+ and La3+ replace Ba2+; Nb5+ and Ta5+ replace
Ti4+. However, doping with low level of donors may lead to the inhibitions of grain
growth of BTO.46,47
On the other hand, acceptor doping is the doping of less valence ions in order to
replace the metallic ions in the lattice. Most of the previous studies reported about the
substitution of Ti4+. For example, Mn2+ or Mn3+, Co2+ or Co3+, and Ni2+ replace Ti4+.
After the equilibrium of the substitution, the oxygen vacancies are formed. The
vacancies will induce the electrolytic migration of the O2− in the direct current field. It
reduces the resistance and the dissipation factor of BTO, the dielectric properties
increases.48-50 At last, the dopants that may replace the site of A or B in ABO
3 structure are summarized in Table 2-1.
Figure 2-14. Effect of isovalent substitution on TC of BTO composition.
2-3. Introduction to LIBs
During the pass two decades, LIBs are extensively studied due to their practical
applications in various fields. Among those attempts, great efforts have been made to
improve their capacity and cycle life in order to develop portable LIBs with the
Table 2-1. Ionic radius and dopants to replace sites in ABO3. Replace site Replace method Dopant Ionic radius
(nm) A-site B-site Donor Acceptor Isovalent
Y 0.121 ● ● Yb 0.118 ● ● Bi 0.131 ● ● Er 0.120 ● ● Ho 0.126 ● ● Pb 0.163 ● ● Ce 0.128 ● ● Dy 0.123 ● ● La 0.116 ● ● Al 0.675 ● ● Nb 0.086 ● ● Zr 0.086 ● ● Nd 0.141 ● ● Mg 0.086 ● ● Mn 0.081 ● ● Sn 0.090 ● ● Co 0.083 ● ● (Ionic radii: Ba2+ = 0.136 nm; Ti4+ = 0.061 nm; O2− = 0.126 nm)
discharge-rate capability. LIBs comprise of cells using positive and negative materials
capable of intercalating Li ions. As the battery is cycled, Li ions exchange between
the positive and negative electrodes. Lithium metal has several unique properties
including it is light and it has a large negative electrode potential (−3.04 V versus
standard hydrogen electrode), which gives the LIB a high energy density and working
voltage compared to, for example, a nickel-metal hydride battery. In LIBs, lithium
electrolyte to the cathode during battery discharge and vice versa as the battery is
recharged. The working principle of LIB is based on the intercalation of Li ion in the
active materials as shown in Fig. 2-14.51 In the LIB, the cathode generally contains
lithium metal oxides (e.g., LiCoO2, LiNiO2 or LiMnO2) and normally serves as the Li
sources. During the first charge process, Li ions de-intercalated from the cathode were
again intercalated into the carbonaceous anode and the process is reversed as in the
discharge process. Therefore, Li ions are shifted between two electrodes during the
charge-discharge process. The battery, as prepared, is in a discharged state, where Li
ions are contained within the cathode active materials. During the charge cycle, an
external current is applied to the battery that leads the Li ions move through the
separator (with the aid of an electrolyte which is a conductor of lithium ions) to the
anode side, where contains graphite particles capable of intercalating lithium ions and
remains ready for the discharge cycle when an external load is connected to the
battery. The charge/discharge total reactions and the anode reaction based on Li+
intercalation and deintercalation are show as below:
Figure 2-15. Schematic illustration of LIBs.
2-4. CNT-based Anode in LIBs
CNT has a relatively high mechanical strength and electrical conductivity. CNTs
are graphitized carbon fibers and have high length/diameter ration, so they have high
conductivity and tend to form special network-like morphology by nature.52,53 CNTs
have been characterized in terms of the highly preferred orientation of their graphitic
basal planes parallel to the fiber axis, with an annular ring texture in the cross section.
This structure gives rise to excellent mechanical properties, very high electrical and
and adhesion of the composite cathode during bending, CNT was added to form a
network-like composite electrode. The interconnected structure not only provides high
conductivity but also binds all other compositions together. Electrochemical
performances of the thin and flexible batteries with carbon-nanofiber composite
cathodes were investigated in terms of life-cycle stability, high-current discharge
behavior, and lowtemperature discharge performance.
2.5. Motivations
2.5.1. Nano BTO-relating Ceramics
Recent development of thinner multilayer ceramic capacitors (MLCC) demands
the usage of smaller-sized raw ceramic powders. When the thickness of an individual
layer in MLCC is scaled down to 2 µm, nano-meter scale ceramic powders are
required in order to produce the defect-free layers. From our previous studies, to
achieve a high packing density and uniform microstructure in green tape, slurry with
fine dispersion is essential. However, dispersion of ceramic powders in nanometer
scale is a difficult issue in comparison with the powders in micrometer scale since the
nano-scale powders exhibit a larger SSA and van der Waals attractive force.
So far, the dispersive research about nano ceramic is still unclear. In our study, we
Waals attraction resulted from large SSA of nano-sized particles before using.
Furthermore, the effects of grain size on the dielectric properties of electroceramics is
also one of important research topics in electronic ceramics. This work studied the
dispersion and sintering behaviors of nanometer-scale BTO, BST and BST material
doping with La2O3 powders at nanometer scale in order to obtain the desired dielectric
properties. The densification process at different sintering temperatures and time
spans as well as the relationships between grain sizes, crystallization behaviors,
microstructure changes and dielectric properties of BTO-relating capacitors based on
such nano-scale ceramic powders were investigated.
2.5.2. Dispersion of CNTs in LiCoO2 electrode of LIBs
In 1990, the LIBs were commercialized by Sony Energytech. Owing to the need
of small power source with high energy density and long cycle life for portable
devices, the lithium-ion batteries have been used popularly for 3C products. The
lithium metal oxides LiMO2 (M = Co, Ni and NiCo) have been used as cathode
materials for lithium-ion batteries. However, the powder conductivities are poor for
the pure lithium metal oxides. Various conductive materials such as carbon black,
graphite, carbon fiber and CNT are used to improve the conductivity of positive
CNT is an alternative of conductive agent in LIB electrode due to its relatively
high mechanical strength and electrical conductivity as well as the nature of forming a
network-like morphology. However, in most cases, the CNTs aggregates seriously
like tied hair and its aggregates do not break up during the ball mixing process. Up to
now, study relating to dispersion of CNT is still missing. This work demonstrates the
dispersion method of CNTs and its applicability to the performance improvement of
CHAPTER 3
Experimental Methods
3.1. Dispersion and Preparation of Nano-ceramic Powders 3.1.1. Raw Materials
(1) BTO samples: High purity, amorphous BTO powder (Seedchem, Australia, Purity
≈ 99.95) with Ba/Ti = 0.915, average size = 100 nm, and specific area = 9.18 m2/g
was utilized as the raw material of experiment.
(2) BST samples: The BTO (Ba0.7Sr0.3TiO3) specimens were synthesized based on the
commercial BTOand SrTiO3 (STO) powders supplied by Ferro Corp., Penn Yan,
NY, USA, and fabricated via the solid-state reaction process.54 According to the
supplier’s data, the purities and average sizes of BTO and STO were both 99.9%
and about 100 nm. The crystal structures of BTO and STO are both cubic. The
chemical dispersant for nano-ceramic powders, PDAAE, was prepared from
acrylamide and (α-N, N-dimethyl-N-acryloyloxyethyl) ammonium ethanate
(DAAE) via the free-radical polymerization and the detailed preparation
procedures of PDAAE could be found elsewhere.55 Powder slurries were prepared
by mixing the BTO and STO powders at fixed molar ratio of 7:3 and then
appropriate time spans.
Figure 3-1. The structure of MiniZeta 03 laboratory mill.
(3) La-doped BST samples: Commercially available BTO, STO (Ferro Co., Penn
Yan, NY, USA) and La2O3 (99.99%, Genesis Nanotech Co., Taiwan) powders
the BTO and STO powders at fixed molar ratio of 7:3 and then grinding with 5
wt.% of PDAAE chemical dispersant in the MiniZeta 03 laboratory mill at the speed of 1800 rpm for 30 min. Afterward, 0.5, 1.0 and 1.5 mol.% (0.74, 1.48 or
2.22 wt.%) of La2O3 was added in to the BTO/STO mixture with PMAA chemical
dispersant further grounded in the laboratory mill at 2400 rpm for 20 min to form
the slurry containing the ceramic powders of average size = 70 nm. Hereafter, the
capacitor samples fabricated based on such a powder sulrry are termed as xLBST
in which x denotes the dopant concentration in mol.% as cited above.
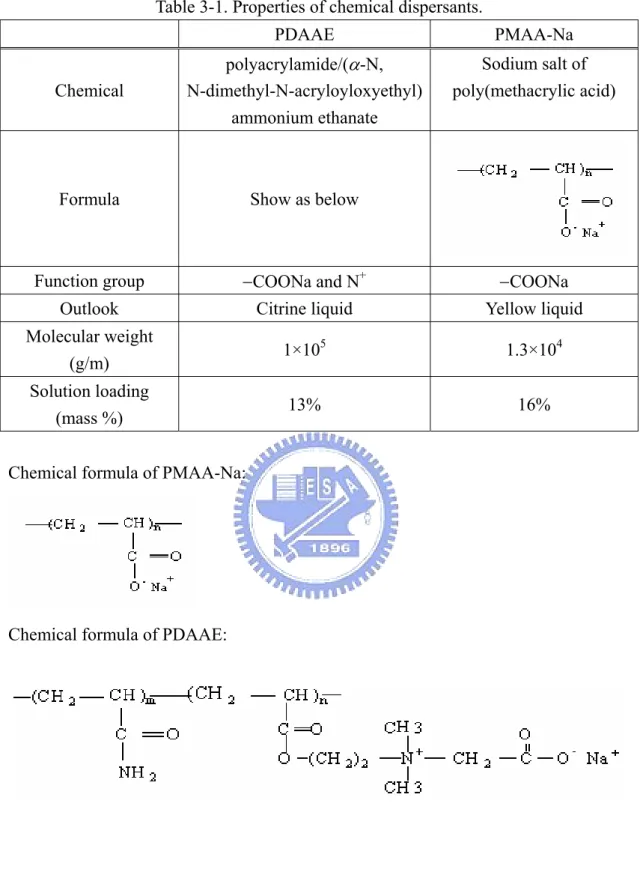
3.1.2. Chemical Dispersants
(1) PMAA-Na: PMAA-Na is a kind of anionic dispersant used to disperse ceramic
powders. The anionic function group is COO−. The detail data of PMAA-Na is
listed in Table 3-1.
(2) PDAAE: An amphibious dispersant was adapted. There are two kinds of function
groups. The anionic function group is COO−, same as PMAA-Na. The cationic
Table 3-1. Properties of chemical dispersants. PDAAE PMAA-Na Chemical polyacrylamide/(α-N, N-dimethyl-N-acryloyloxyethyl) ammonium ethanate Sodium salt of poly(methacrylic acid)
Formula Show as below
Function group −COONa and N+ −COONa Outlook Citrine liquid Yellow liquid Molecular weight
(g/m) 1×10
5 1.3×10⁴
Solution loading
(mass %) 13% 16%
Chemical formula of PMAA-Na:
Chemical formula of PDAAE:
3.1.3. The Experimental Flow
The experimental flows for this study are shown in Figs. 3-2 to 3.4. The
Figure 3-2. Experimental flow of BTO specimens. Dispersants BTO Laboratory mill 30 min/3600 rpm Slurry
Dry, sieving and die pressing
Sintering
1100 ~ 1300°C/1 ~ 12 hrs
Microstructure
observation identificatio Phase
n Density measuremen t Electric measuremen t Particle size distribution Viscosity Adsorption of dispersant Zeta potential
Figure 3-3. Experimental flow of BST specimens.
BTO STO Dispersants
Laboratory mill 30 min/3600 rpm
Slurry
Dry, sieving and die pressing
Sintering 800 ~1400°C/1 ~ 12 hrs
Microstructure
observation identificatio Phase
n Density measuremen t Electric measuremen t Particle size distribution Viscosity
BTO STO Dispersant Laboratory mill 30 min/3600 rpm Slurry La2O3 Dispersant Laboratory mill 20 min/3600 rpm Slurry
Dry, sieving and die pressing
Sintering
1000 ~1400°C/1 ~ 12 hrs
Microstructure
observation identificatio Phase
n Density measuremen t Electric measuremen t Particle size distribution Viscosity
3.2. Characterizations of Aqueous Slurries
3.2.1. Particle Size Distribution
Different amounts of PMAA-Na and PDAAE dispersants based on the weight of
ceramic powder were added into deionized water and the pH value of solutions were
adjusted to 9.5 by adding appropriate amounts of NH4OH(aq). The purpose of this
procedure is to ensure the complete dissociation of chemical dispersants.55 The nano
BTO powder, BST or xLBST mixtures was added. After mechanical grinding/mixing
by the MiniZeta 03 laboratory mill, a small amount of slurry was taken out and sent to
a particle size analyzer (Malvern Mastersizer 2000, UK) for the examination of the
size distribution of powders in the slurry.
3.2.2. Zeta potential
After mechanical milling, a small amount of supernatant was removed from
slurries by centrifugation, and zeta potential of the remaining powders in the
supernatant was then measured by using a zeta meter (PEN KEN Inc. 501, France).
3.2.3. Viscosity
The viscosity of 60 wt.% ceramics suspensions with or without chemical
evaluated by a viscometer (Brookfield DV-II, USA) at a rotation speed of 0- 60 rpm.
3.2.4. Adsorption of Dispersant
BTO aqueous suspensions of 30 wt.% with different concentrations of either
PDAAE or PMAA-Na were prepared at pH=9.5. These suspensions were
deagglomerated by a laboratory mill. After laboratory milled, the suspensions were
centrifuged at a speed of 6 ×10³ rpm for 30 min to obtain supernatants. The residual
dispersant concentration in the supernatants was analyzed and determined by a
titration procedure mentioned above. The amount of dispersant adsorbed on ceramics
was calculated from the difference in dispersant concentration before and after
adsorption.
3.3. Characterizations of Sintered Samples
3.3.1. Density Measurement
The density of the samples was measured by the Archimedes method. At first,
the samples were bake at 150°C for 1 hr. The dry-weight W1 of it is weighted out with
an electronic balance. Sample was then immersed in de-ionized water and heated at
100°C for 30 min with a hot plate. The samples were taken off and laid on a dry tissue
obtained. Then, the samples was hung with a small net and put in a glass of DI water
in order to measure the floating weight W2. The density D of the sample is obtained
by 2 3 1 W W W D D − ′ = (3-1)
where D′ is the density of the de-ionized water.
3.3.2. Microstructure
Grain sizes, morphology and element distribution of sintered bodies were
examined by scanning electron microscopy (SEM, Hitachi 4700) and transmission
electron microscope (TEM, Philips, Tecnai 20, G-2) attached with energy dispersive
spectroscopy (EDS, STUW 3.3). The average grain size was obtained by SEM and the
intercept method.43
3.3.3. The Phase Identification of Materials
X-ray diffraction (XRD) was performed by using a diffractometer (Siemens D5000) within Cu-Kα radiation (λ = 0.1542 nm) at the scanning rate of 1°/min in
3.3.4. Dielectrical Properties
The indium-contained silver paste was adopted as the electrode material to
provide Ohmic contact. The dielectric properties of sintered body were measured by a
HP 4194A impedance analyzer at 1 kHz. Before the measurement was carried out,
calibration must be done. With the capacitance of the sample measured, the real part
of the relative dielectric constantεr was calculated as follows:
A ε Cd ε o r = (3-2)
where C is the capacitance, d is the thickness, A is the area and ε0 = 8.8542×10⁻¹²
F/m.
3.4. Dispersion of CNTs
3.4.1. Synthesize of PEI
(1) Materials: NMP (Aldrich, 99.99%) and N,N-dimethyl -formamide (DMF)
(Aldrich, 99.99%) were distilled over CaH2 (Aldrich, 99.95%) under reduced
pressure. Pyridine (Aldrich, 99.99%) was dried by distillation after being refluxed
with KOH (Aldrich, 99.99%). 4-[Di(4-aminophenyl)-methyl]phenol (Lancaster,
(TPP) (Aldrich, 99.99%) was purified by distillation under reduced pressure. All
other reagents and solvents were used as received from venders unless otherwise
stated.
(2) 4-{4-[Di(-aminophenyl)methyl]phenoxy}phthalonitrile (1): A mixture of
4-[Di(4-aminophenyl)-methyl]phenol (5 g, 26.96 mmol), 4-nitrophthalonitrile (4.65 g,
26.9 mmol), K2CO3 (5 g, 36.2 mmol) (Aldrich, 99.99%), and DMF (20 ml) was
heated at 130°C for 4 hrs. After the heating period, the reaction mixture was cooled
and poured into by filtration, dried under vacuum and purified via recrystallization
from ethyl acetate to yield compound 1 (8.2 g, yield ratio ≈ 85 %).
(1)
(3) 4-{4-[Di(-aminophenyl)methyl]phenoxy}phthalic acid (2): Solution of KOH (14
compound 1 (8 g, 28.3 mmol). The mixture was then refluxed for 4 hrs. The resulted
solution was diluted with water (250 ml) and acidified with 6 N HCl(aq) to pH ≈ 1.
The precipitate was filtered, washed thoroughly with water, and dried to give
compound 2 (7 g, yield ratio ≈ 88 %).
(2)
(4) 4-{4-[Di(-aminophenyl)methyl]phenoxy}phthalic Anhydride (3): A mixture of
compound 2 (6 g, 17.3 mmol), acetic anhydride (6 ml), and acetic acid (6 ml) was
stirred under reflux for 6 hrs. After cooling, the precipitate was collected by filtration,
washed with a small amount of glacial acetic acid, and then dried in vacuum at 130°C
(3)
(5) PEI: A solution of compound 3 (3 g, 2.61 mmol), TPP (1 ml, 5.2 mmol), and LiCl
(160 mg, 5.77 mmol) in NMP/pyridine (50 ml, 4:1 v/v) was heated at 120°C in
nitrogen ambient for 4 hrs. After cooling, the resulted polymer was precipitated in
methanol. The polymer was collected, washed with hot water, purified by
reprecipitation from DMF into methanol twice and dried in vacuum to produce PEI
(2.32 g, yield ratio ≈ 70 %). The chemical reaction was showed in Scheme 3-1 and
3-2. The chemical structure of PEI shown in Fig. 3-5 was identified by 1H-NMR
Figure 3-5. Chemical Structure of PEI.
Scheme 3-2
3.4.2. Experimental Flow of LIB Experiment
The experimental flow for this part of study is shown in Fig. 3-6. The LiCoO2
electrode contained 90 wt.% LiCoO2 (LICO, Taiwan), 3 wt.% polyvinylidene fluoride
(PVDF, Kuraha Chemical, Japan) binder and 7 wt.% conducting additives. The
conducting additives were synthetic graphite (Timrex KS6, Timcal, Switzerland) and
CNTs dispersed by various amounts of PEI. The mixture containing above ingredients
were mixed by ball milling for 4 hrs and then coated onto 20-µm thick Al foil, dried at
140°C and pressed to form the LiCoO2 electrode with final thickness of 120 µm. The
coin cell assembly of LIB test cell is showed in Fig. 3-7.
Figure 3-6. Experimental flow for LIB experiment. CNTs Dispersant 3D ball mixing 2 hrs Slurry LiCoO2 PVDF 3D ball mixing 4 hrs Slurry Hot coating on Al laminated film Coin Cell Microstructure Observation Resistiv ity measuremen t Electric measuremen t Viscosity KS6 Optical microscope Adsorption of dispersant
Figure 3-7. The coin cell assembly of LIB test cell.
3.4.3. Optical Microscopy
The CNTs slurry was first prepared with dispersant to confirm that the CNTs was
dispersed. The dispersive effect was determined to Optical Microscope (OM,
3.4.4. Viscosity Measurement
The rheology of CNTs slurry without or with chemical dispersants subjected to
ball mixing was evaluated by a viscometer (ARES-LS1, Germany).
3.4.5. Adsorption of Dispersant
The CNTs suspensions with different concentrations of PEI were prepared. These
suspensions were deagglomerated by a 3D ball mixing. After ball mixing, the
suspensions were centrifuged at a speed of 1.5 ×10⁴ rpm for 2 hrs to obtain
supernatants. The residual dispersant concentration in the supernatants was analyzed
and determined by a UV-Visible (V-600, JASCO/Japan). The amount of dispersant
adsorbed on CNTs was calculated from the difference in dispersant concentration
before and after adsorption.
3.4.6. Microstructure Observation
The morphology and CNTs dispersive effect in LiCoO2 electrode was obtained
by scanning electron microscopy (SEM, Hitachi 4700).
3.4.7. Cyclic Voltammograms
by a cyclic voltammograms (Biologic, Mac Pile II, USA) operating in between 2.9
and 4.2 V. The purpose of cyclic voltammogram test is to explore the oxidation
reduction potential of the test cell and the electrochemistry change in the test cells.
3.4.8. Electrical Characterizations
Electrochemical impedance spectroscopy (EIS, Schlumberger, SI 1286 and SI 1255, England) operating at 3.5 V was adopted to characterize the impedance profile
of half cell containing modified LiCoO2 electrode. The measurement was carried out
at the scanning frequencies ranged from 0.01 Hz to 50 kHz and with the perturbation
amplitude of 10 mV. The cycling performance and charge-discharge capability of LIB
test cells were carried out with the aid of charge-discharge apparatus (Arbin, model
BT2042, USA) which enables a control of 5 cells synchronously at most. A
charge-discharge test consisted of five cycles. The procedure was composed of a
constant-current of 2 mA followed by constant-voltage at 4.2 V until the current
CHAPTER 4
Results and Discussion
4.1. Dispersion and Preparation of Nano-scale BTO materials 4.1.1. Rheological Behaviors
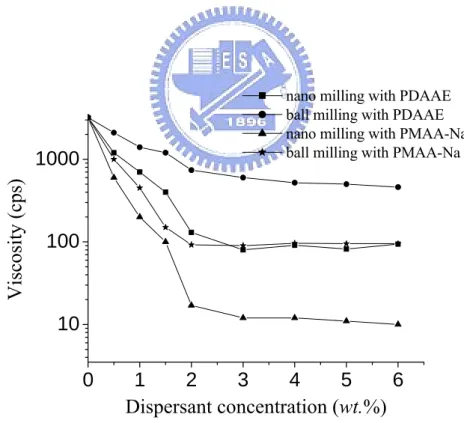
Viscosity measurement is commonly adopted to evaluate the dispersed
extent of concentrated suspensions. Figure 4-1 shows the effect of dispersant
concentration on the viscosity of 60 wt.% BTO suspensions subjected to conventional
ball milling or nano grinding/mixing via MiniZeta mill. The viscosity of suspensions
without dispersion treatment is about 3200 cps. For the suspensions subjected to
different mechanical milling processes, their viscosities decrease when PMAA-Na or
PDAAE is incorporated. The viscosity of suspensions first decreases with the
increase of dispersant concentration then reaches a plateau. At same of dispersants
concentration, the viscosity of suspensions subjected to nano grinding/milling
exhibits a lower value in comparison with that of suspensions subjected to
conventional ball milling. For the suspensions subjected to nano grinding/mixing, the
optimum chemical dispersant concentrations in BTO suspensions are about 2 wt.%
for PMAA-Na and 3 wt.% for PDAAE, which respectively result in the lowest
sharpest descend of viscosity and the amount of PMAA-Na to achieve the lowest
value of viscosity is less in comparison with that of PDAAE. As the PMAA-Na and
PDAAE both have similar molecular weight, the difference in the rheological
behaviors is attributed to the difference of chemical structures. The PMAA-Na is
anionic polyelectrolyte, which causes mainly electrostatic repulsion when adsorbed
on BTO particles. Though PDAAE also causes electrostatic repulsion when adsorbed
on BTO surface, the effect is relatively less because PDAAE is amphibious
polyelectrolyte. 0 1 2 3 4 5 6 10 100 1000
Visc
osity (cps)
Dispersant concentration (wt.%)
nano milling with PDAAE ball milling with PDAAE nano milling with PMAA-Na ball milling with PMAA-Na
Figure 4-1. The effect of dispersant concentration on the viscosity of 60 wt.% BTO