http://sim.sagepub.com/
SIMULATION
http://sim.sagepub.com/content/86/5-6/351
The online version of this article can be found at: DOI: 10.1177/0037549709340733
2010 86: 351 originally published online 11 January 2010 SIMULATION
Chung-Yuan Huang, Yu-Shiuan Tsai and Tzai-Hung Wen
A Network-based Simulation Architecture for Studying Epidemic Dynamics
Published by:
http://www.sagepublications.com On behalf of:
Society for Modeling and Simulation International (SCS)
can be found at:
SIMULATION
Additional services and information for
http://sim.sagepub.com/cgi/alerts Email Alerts: http://sim.sagepub.com/subscriptions Subscriptions: http://www.sagepub.com/journalsReprints.nav Reprints: http://www.sagepub.com/journalsPermissions.nav Permissions: http://sim.sagepub.com/content/86/5-6/351.refs.html Citations: What is This? - Jan 11, 2010
OnlineFirst Version of Record
- Jun 3, 2010
Version of Record
Studying Epidemic Dynamics
Chung-Yuan HuangDepartment of Computer Science and Information Engineering and Research Center for Emerging Viral Infections,
Chang Gung University, 259 Wen Hwa 1st Road, Taoyuan 333, Taiwan Yu-Shiuan Tsai
Department of Computer Science, National Chiao Tung University, 1001 Ta Hsueh Road,
Hsinchu 300, Taiwan Tzai-Hung Wen
Graduate Institute of Epidemiology, College of Public Health,
National Taiwan University, 17 Xu-Zhou Road,
Taipei 10020, Taiwan
Epidemiology instructors are collaborating with computer scientists to construct network-based sim-ulations to recreate infectious disease transmission dynamics and to examine intervention strategy efficacies. Here we propose an architecture based on demographic and geographic properties to support the learning efforts of undergraduate students and novice researchers, and describe our simulations of HIV, SARS, and influenza transmission dynamics in Taiwan. Our findings are offered to support the construction of new network-based epidemic simulations.
Keywords: network-based simulations, epidemic transmission dynamics, SARS, HIV, seasonal influenza
1. Introduction
Computer simulations are now widely used in domains such as sociology [1–4], economics [5], bioinformat-ics [6, 7], ecology [8], and epidemiology [9]. Examples of specific applications include cellular automata con-structed by transportation researchers to evaluate traffic
c
DOI: 10.1177/0037549709340733
Figures 2, 3, 8, 12, 13 appear in color online:
control strategies [10, 11] and network-based simulations developed by economists to observe cash flow and wealth distribution [12]. Epidemiology instructors are collabo-rating with computer scientists to analyze the transmis-sion dynamics of infectious diseases, to determine the efficacies of intervention strategies, and to train novice researchers. Until recently, epidemiologists have used questionnaires and field investigation techniques to study epidemic outbreaks: procedures considered deficient for gaining macro views of epidemic dynamics or assessing intervention strategies. Other problems associated with these tools include the inability to capture movement and interaction patterns among millions of individuals with wide ranges of age, profession, education, and disease re-sistance [13]. As observed in April 2009, epidemic
out-12010 The Society for Modeling and Simulation International
http://sim.sagepub.com
breaks can develop randomly and unexpectedly according to such factors as breadth of initial occurrences, number of randomly imported cases, responses of infected individ-ual, the characteristics of contacts with other susceptible individuals, and intervention strategies executed by health authorities.
Network-based simulations are proving successful for exploring epidemic dynamics and assessing intervention strategies among large and varied populations [14–21]. By approaching computational epidemiology from a so-cial network perspective, static domain information such as age, gender, profession, educational level, and mar-ital status can be represented as node attributes. How-ever, dynamic domain information regarding individual factors such as movement and interaction patterns requires support in the form of demographic and geographic data in addition to well-constructed and situation-specific as-sumptions.
We have used computational modeling and simulation tools to investigate the transmission dynamics of HIV, SARS, and influenza in Taiwan [15, 18–20, 22]. In this pa-per we (a) propose an architecture based on demographic and geographic properties to teach network-based simu-lations to undergraduate students and novice researchers, and (b) describe our experiences simulating HIV, SARS, and influenza transmission dynamics in Taiwan, and use our results to illustrate challenges to building network-based epidemic simulations.
2. Epidemic Simulation Benefits
The use of computer simulations as a pedagogical tool is now common in technology training and the teaching of science concepts [22–24]. Epidemiologists are using computer simulations to support education and training efforts based on constructivist learning principles. In ad-dition to mitigating learner obsession with the minutiae of complex procedures described in epidemiology text-books [25], simulations provide multiple opportunities for ‘learning by doing’ [26]. According to constructivist prin-ciples, learners make use of prior knowledge when form-ing new schema via discovery learnform-ing [27]. Confronted with new stimuli, learners apply their knowledge bases to accommodate new information and to alter their ex-isting schema [28]. Applied to epidemic simulations, stu-dents will have more and higher-quality opportunities for discovering primary and secondary epidemic issues while gaining hands-on experience dealing with real-world in-tervention strategies.
Simulations have two characteristics that make them compatible with problem-based learning theory [29].
1. Engagement. Students frequently request epidemic simulations to help them gain a sense of real-world epidemiology problems. Simulations also support the introduction of related concepts to the learning
process. There is no ‘perfect’ simulation, but as long as scenario limitations are taken into account they can produce meaningful learning experiences [30]. 2. Interaction flexibility. When used with interaction
and feedback techniques, epidemic simulations help illustrate how infectious diseases are spread under different conditions and various circumstances [30]. The complexity of epidemiology problems means that single ‘correct’ answers are rare, meaning that learners must continuously manipulate parameters. With sufficient practice, students or inexperienced researchers eventually learn how to transfer their new knowledge to real-world infectious disease sce-narios.
There are at least three benefits from using simulations to study the spread of epidemic diseases.
1. Operational. Epidemiology problems often require examinations of the effects of intervention strate-gies in specific environments, but real-world exper-iments are impractical. Using network-based simu-lations, epidemiologists can examine the influences of different public health policies in different re-gions, and execute ‘what-if’ experiments to study the emerging behaviors of infections when irrele-vant health policies are temporarily removed. For students, simulations can be optimized for learning and training purposes [31].
2. Observational. Users can adjust the scales and speed of epidemic simulations for observation pur-poses. Speeding up simulated processes is consid-ered especially useful for studying the diffusion of diseases such as HIV that have long incubation peri-ods [20]. This allows novice researchers to practice professional skills without having to invest large amounts of resources or becoming involved in high-risk situations. In addition, post-simulation reports allow teachers to determine which concepts their students have mastered [32–34].
3. Construction. Epidemic simulations can be used to create and explore various environments. Using intervention strategy assessments as an example, learners can predict developments resulting from different intervention strategy and/or policy com-binations, and classroom instructors can exert rel-atively precise control over knowledge construction and accumulation [32].
3. Network-based Simulations
Compared with agent-based simulations, network-based simulations have a stronger focus on relationships be-tween individuals. In social networks, nodes represent in-dividuals and links their various relationship types. For
instance, in HIV simulations links represent sexual rela-tionships and in SARS simulations they represent close physical proximity. Results from mathematical analyses and experimental simulations indicate that the topological features of social networks exert considerable influence on the transmission dynamics and critical thresholds of infectious diseases, thus supporting analyses of subtle de-tails that non-network-based simulations are incapable of performing [14, 18–20, 35–37]. Furthermore, the need to identify efficient and specifically targeted intervention strategies requires precise representations of demographic and geographic properties such as home quarantines and hospital visitation bans.
Network-based computer simulations imitate interac-tion and contact patterns between individuals1 parallel computing technology is employed to track the move-ment of heterogeneous individuals. In geographic infor-mation systems, regular networks are used to exhibit distance relationships between individuals, for example, von Neumann and Moore neighborhood concepts in two-dimensional regular networks respectively consider a sin-gle node’s four or eight adjacent nodes as neighbors. The use of regular networks allows for easy representation and measurement of abstract geographic space and distance concepts. In contrast, random networks support features of casual interactions and contacts among mobile individ-uals, in addition to the low degree of separation commonly observed in social networks.
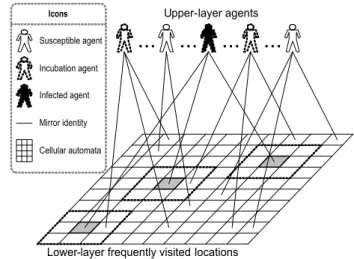
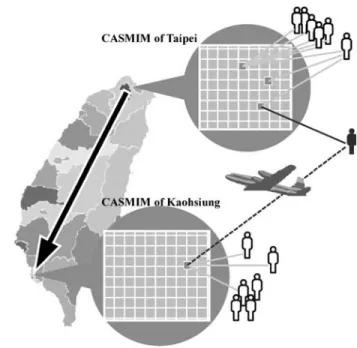
Network-based simulations have been developed to capture the properties of randomness and geographic dis-tance. One small-world approach to building social net-works is the Cellular Automata with Social Mirror Iden-tity Model (CASMIM) (Figure 1) [18, 19]. The social mir-ror identity concept (Figure 2) allows for simulations of individuals who have regular contact locally and intermit-tent contact with others over long distances: representative of daily visits to fixed locations and long-distance travel. For the purposes of validation, local and long-distance in-teractions within a model must correspond to statistical topology features such as a high degree of clustering, low degree of separation, and power-law connectivity distrib-utions.
Different epidemiology issues require different net-work topology structures for building simulation models based on specific interaction and contact types. For ex-ample, HIV diffusion can occur via heterosexual contact, homosexual contact, and illegal drug use, but their net-work topologies are very different. Heterosexual netnet-work models must be scale-free to reflect the statistical power-law distribution of sex partners, but bipartite networks are more likely to accurately reflect the sharing of syringes by injecting drug users (IDUs). Data granularity and detail also affect the topologies of social networks: if a disease control agency can trace all IDU activities, it is possible to build a relatively precise contact network, but if knowl-edge is limited to specific locations where IDUs congre-gate, simulations will only reflect more general
interac-Figure 1. Cellular Automata and Social Mirror Identity Model
(CASMIM)
tions and contact pattern assumptions. This explains why demographic and geographic data on individual interac-tions and contacts are significant challenges for novice researchers learning how to construct network-based epi-demic simulations.
4. Network-based Epidemic Simulation Architecture
Two primary issues associated with network-based simu-lations must be considered when studying epidemic dy-namics: choosing an appropriate network model and in-tegrating specific epidemiology domain knowledge and properties. Table 1 shows the individual characteristics most commonly used in network-based epidemic simula-tions. Several network model types can be adopted, in-cluding (a) daily contact networks that utilize individ-ual activity records [14, 21]1 (b) bipartite networks com-posed of individuals and most frequently visited places such as homes, train stations, school buses, workplaces, and restaurants [37]1 or (c) CASMIM, which depicts long-distance movement and daily visits to fixed locations [15, 18, 19, 22]. Many epidemiology students struggle with domain knowledge and network construction de-tails such as identifying interaction and contact patterns, choosing/adopting existing network models, and develop-ing/validating new network models.
The four properties considered most important for building epidemiological networks are as follows.
1. Time scale. In simulations of HIV diffusion via heterosexual intercourse, sexual behavior frequency distributions over one month or one year will ex-hibit power-law features [16], but this is not true when the time scale is shortened to one day or one
Table 1. Common individual characteristics used in network-based epidemic simulations
Attribute Description
ID Unique serial number identifying each individual.
Mobility Denotes individual activity. Default value is ‘free’, i.e. no restrictions on interacting with neighboring individuals. The Mobility status of individuals placed in home quarantine or hospital isolation changes to Quarantined or
Isolated, meaning they are restricted to homes, hospitals, or dormitories, and all of their activities are
temporar-ily suspended.
Age Young (1 to 20), prime (21 to 60), or old (61 and above).
Super Spreader If yes, set to true1 if no, to false.
Permanent Immunity If yes, set to true1 if no, to false.
Day Number of patient days at current disease status.
Contact Rate Rate of contact with other individuals.
Now State Current epidemiological progress state.
Next State Epidemiological state at next time step.
week. It is also important to remember that differ-ent diseases have differdiffer-ent immunization and incu-bation periods (5 days for SARS versus 6 months to 20 years for HIV).
2. Geographic scale. Whereas CASMIM can be ap-plied to simulate SARS outbreaks in modern cities such as Taipei or Singapore, simulating epidemic dynamics across multiple regions requires addi-tional demographic data. One solution is building one CASMIM for each city and measuring trans-portation flow between paired cities. Since novel forms of influenza tend to be expressed as large-scale epidemics, models for large regions require consideration of cross-border transportation net-works. Furthermore, building social networks for modern cities with established mass transportation systems must assume strong and varied mixes of hu-man movement between cities, between cities and suburbs, and between smaller geographic regions. 3. Data dependency. Data granularity determines the
best method for building network models. Using ho-mosexual HIV diffusion as an example, when data are limited to frequency distributions of sexual con-tact, models must be restricted to abstract neigh-borhood and geographic distance concepts [20]. If movement within high-risk contact populations can be traced, models can be used to predict future de-velopment.
4. Extendibility. Owing to the diversity of epidemio-logical data, simulations of specific infectious dis-eases often require modifications to existing net-work models. CASMIM is suitable for depicting well-mixed interactions and contact locations for randomly distributed individuals, but it cannot sup-port assumptions of well-mixed locations for sex-ual contact or needle sharing. Thus, extendibility is a major concern when applying an existing network model to new epidemic simulations.
In response to the range of geographic and demo-graphic restrictions, we propose the use of a four-layer architecture for network-based epidemic simulation con-struction. The first layer reflects individual-to-individual contact for small-scale social networks. For example, dur-ing the 2003 SARS outbreak, health authorities in Taiwan and Singapore attempted to construct contact histories for all infected individuals in order to quarantine anyone com-ing into contact with a carrier. The second layer consists of passive connections between individuals and locations. For example, saunas and bars frequented by homosexu-als are activity locations bridging susceptible individuhomosexu-als with HIV carriers. Among IDUs, infection locations in-clude syringes and chemicals used for drug dilution. To construct IDU social networks, epidemiologists must de-termine how many times a user shares a syringe with other users during a week/month, and how many users share the same diluting agent in a single session.
The third layer uses abstract geographic properties to reflect individual neighborhood concepts. In the absence of real interaction or contact data, epidemiologists must build well-mixed modern societies based on abstract dis-tances. In previous studies [18, 19] we described a CAS-MIM consisting of two-dimensional cellular automata as an underlying social network for retaining an individ-ual’s geographic mobility. The social mirror identity con-cept preserves the properties of individuals who interact with their neighbors within two-dimensional geographic spaces, and reflects such activities as long-distance move-ment and daily visits to fixed locations. The fourth layer often requires significant support in the form of de-mographic or geographic data. For example, Ferguson’s Southeast Asian influenza simulation [17] uses statistical data for population density, household size, age distribu-tion, school and workplace size, and individual travel in-formation. In contrast, the spread of HIV among homo-sexuals serves as a negative example: movement, location, and means of sexual contact are less obvious, making it more difficult to build four-layer network-based simula-tions [20].
In the following sections we share our modeling expe-riences using three of the four layers to construct network-based epidemic simulations. We applied an event-driven programming concept to build the user interface and in-put/output functions of epidemic simulations. In addition to providing specific statistical reports and charts contain-ing experimental results, the three simulation types allow learners to use browser windows to observe real-time in-fection situations in agent societies. We used Borland C++ Builder to compile executable applications, therefore our epidemic simulations can be run with specific dynamic linked library files on Windows. For related literature and information, see http://groups.google.com/group/canslab. 5. Layer 3: Abstract Geographic SARS
Simulation
We developed the CASMIM small-world epidemic simu-lation model to study SARS transmission dynamics and to assess the efficacies of various intervention strategy com-binations. As a robust and extendable simulation model, CASMIM is suitable for classroom demonstrations of epi-demiological issues associated with short-distance conta-gious diseases.
5.1 Data Collection
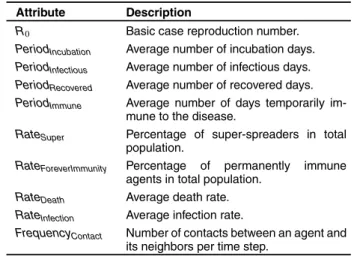
Most of the epidemic parameter data required for es-tablishing SARS simulations are available from na-tional health authorities or the World Health Organiza-tion (WHO). The parameters include R0, PeriodIncubation,
PeriodInfectious, PeriodRecovered, and PeriodImmune(Table 2).
Epidemiologists and sociologists can provide values for
RateForeverImmunity, RateDeath, and average number of social
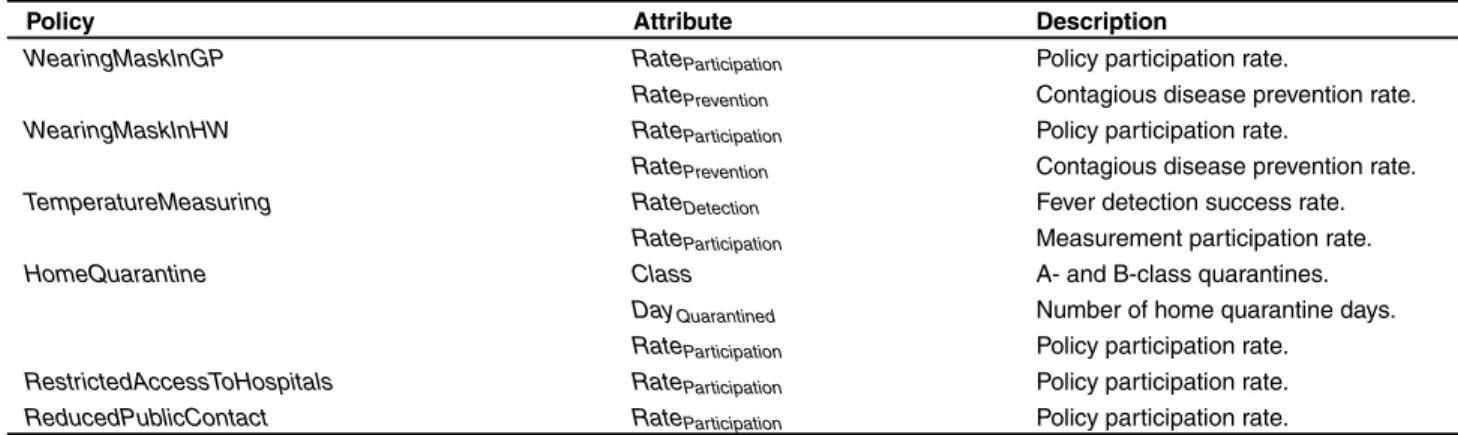
mirror identities. Novice researchers can experiment with the intervention strategy parameters listed in Table 3. Cer-tain parameters such as RateInfection, FrequencyContact can
be derived from
R02 1average number of mirror identity
3 number of neighbors 3 FrequencyContact2
3 RateInfection3 PeriodInfectious3
5.2 Simulation Model
CASMIM [18, 19] is a daily contact network that con-ceptualizes individuals as elements and their most fre-quently visited places (homes, train stations, workplaces, restaurants, etc.) as logically abstracted social mirror iden-tities (Figure 1). CASMIM’s social mirror identity con-cept is used to preserve the properties of elements that
Table 2. SARS epidemic parameters
Attribute Description
R0 Basic case reproduction number.
PeriodIncubation Average number of incubation days.
PeriodInfectious Average number of infectious days.
PeriodRecovered Average number of recovered days.
PeriodImmune Average number of days temporarily
im-mune to the disease.
RateSuper Percentage of super-spreaders in total
population.
RateForeverImmunity Percentage of permanently immune
agents in total population.
RateDeath Average death rate.
RateInfection Average infection rate.
FrequencyContact Number of contacts between an agent and
its neighbors per time step.
interact with their neighbors within two-dimensional ge-ographic spaces, and to reflect activities such as long-distance movement and daily visits to fixed locations (Fig-ure 2).
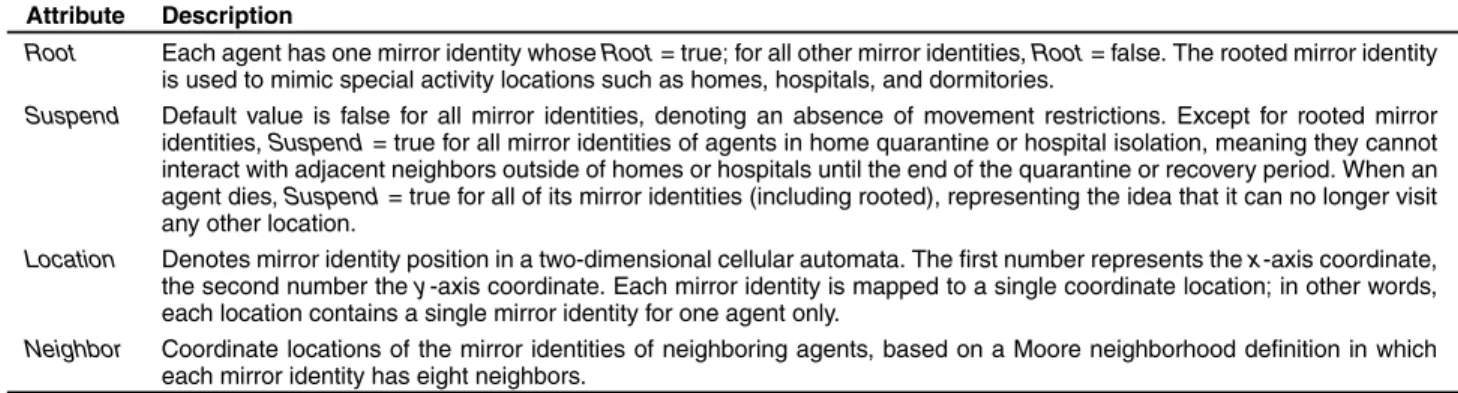
CASMIM consists of an upper layer for simulating heterogeneous cohorts and a lower layer containing two-dimensional cellular automata representing real-world ac-tivity spaces. Social mirror identities connecting the two layers establish CASMIM as a small-world social net-work. Each upper layer individual is depicted as a single agent, and places that an agent visits on a regular basis are defined as its social mirror identities. In a typical cel-lular automata setup, lattices represent abstract agents1 in the case of CASMIM, each lower layer lattice represents a social mirror identity for one individual. It is possible for multiple social mirror identities to be connected to the same agent, with the number exhibiting a normal distrib-ution. Clusters consisting of a social mirror identity and its von Neumann neighbors can represent family mem-bers, coworkers, fellow commuters, healthcare workers, relatives in hospitals, or diners in restaurants, among oth-ers. Each upper-layer agent has a set of attributes repre-senting its epidemiological progress and social mobility status1 these attributes are accessible to all of the agent’s social mirror identities (Table 1). In addition, each social mirror identity has a group of private attributes indicating its current status, locations, and special activity locations (e.g. homes, hospitals, dormitories) (Table 4).
Different epidemic simulations require different time steps. For SARS, we defined one time step as equiva-lent to one day in the real world. Upper-layer agent sta-tuses change simultaneously with their lower-layer social mirror identity statuses during each time step, thereby reflecting their daily interactions. Agent and social mir-ror identity attributes vary according to four factors: the attributes of neighboring agents’ social mirror identities, a set of interaction rules, simulation and epidemic
para-Table 3. Intervention strategy parameters
Policy Attribute Description
WearingMaskInGP RateParticipation Policy participation rate.
RatePrevention Contagious disease prevention rate.
WearingMaskInHW RateParticipation Policy participation rate.
RatePrevention Contagious disease prevention rate.
TemperatureMeasuring RateDetection Fever detection success rate.
RateParticipation Measurement participation rate.
HomeQuarantine Class A- and B-class quarantines.
DayQuarantined Number of home quarantine days.
RateParticipation Policy participation rate.
RestrictedAccessToHospitals RateParticipation Policy participation rate.
ReducedPublicContact RateParticipation Policy participation rate.
Figure 2. An example of the social mirror identity concept. In the example, Andy spends one hour every morning taking his wife Cindy to
her job at a flower shop before driving to his office. Their son Bob takes a school bus to his elementary school. At least once per week, the three of them eat dinner at their favorite restaurant. After dinner, Andy often takes Cindy and Bob home before going with his friends Dick, Eric, and Frank to watch a baseball game. According to our proposed CASMIM, Andy, Bob, Cindy, Dick, Eric, and Frank are upper-layer agents, and the restaurant, stadium, and Andy’s home and office are lower-layer mirror identities. Bob’s mirror identities are his home, school bus, classroom, and the restaurant. Cindy has only three mirror identities: home, the flower shop, and the restaurant. Andy’s car is considered an extension of the family’s home node rather than a separate activity node, since Andy rarely uses it to transport anyone other than Cindy or Bob. Bob’s school bus is considered a social mirror identity because he uses it five days per week and regularly interacts with many of the children who take the same bus. Andy belongs to one group at home with Cindy and Bob, a second group at his office with his coworkers, a third group (also with Cindy and Bob) with other customers at their favorite restaurant, and a fourth group with his baseball friends. Andy’s social mirror identities form a star-shaped topology, with Andy at the center and the mirror identities at the vertices. As shown in Table 4, each individual has one rooted mirror identity. The rooted mirror identity is used to mimic special activity locations, for instance, homes, hospitals, and dormitories.
Table 4. Social mirror identity attributes of individuals
Attribute Description
Root Each agent has one mirror identity whose Root = true1 for all other mirror identities, Root = false. The rooted mirror identity is used to mimic special activity locations such as homes, hospitals, and dormitories.
Suspend Default value is false for all mirror identities, denoting an absence of movement restrictions. Except for rooted mirror identities, Suspend = true for all mirror identities of agents in home quarantine or hospital isolation, meaning they cannot interact with adjacent neighbors outside of homes or hospitals until the end of the quarantine or recovery period. When an agent dies, Suspend = true for all of its mirror identities (including rooted), representing the idea that it can no longer visit any other location.
Location Denotes mirror identity position in a two-dimensional cellular automata. The first number represents the x-axis coordinate, the second number the y -axis coordinate. Each mirror identity is mapped to a single coordinate location1 in other words, each location contains a single mirror identity for one agent only.
Neighbor Coordinate locations of the mirror identities of neighboring agents, based on a Moore neighborhood definition in which each mirror identity has eight neighbors.
Figure 3. CASMIM simulation console
meters, and intervention strategy parameters. At the be-ginning of a simulation, learners initialize CASMIM pa-rameters via the user interface (Figure 3, right-hand side), input imported case data, start the simulation, and advance the date according to the SARS outbreak or simulation timeline. In the last step, learners activate individual in-tervention strategies according to the timeline, and alter
any parameter by activating or disabling it while the sim-ulation is running. Epidemic dynamics and intervention strategy efficacies are immediately affected by parameter modifications.
Figure 4. A comparison of actual and simulated epidemic results for the SARS outbreak in Taipei
5.3 Discussion
After initializing CASMIM and setting its parameters us-ing information distributed by national health authori-ties and the WHO (Tables 1 and 4), learners can simu-late SARS transmission dynamics in different cities. Us-ing Taipei as an example, our simulation included sev-eral intervention strategies enforced by that city’s gov-ernment, including multiple grades of quarantines and a mask-wearing requirement for all public bus and train pas-sengers. As shown in Figure 4, the simulated curve had a close fit with the actual epidemic curve published by Taiwanese health authorities on September 28, 2003. The higher concentration was likely due to late case discov-eries, delays in seeking treatment, illness cover-ups, and the large number of cases imported by travelers returning from Hong Kong.
When faced with a contagious disease outbreak, deci-sion makers must consider various combinations of in-tervention strategies and decide when to activate them. The compound effects of separate combinations can dif-fer greatly due to the scales, efficacies, and targets of in-dividual strategies. We simulated a strategy suite consist-ing of the large-scale takconsist-ing of body temperatures, restric-tions on hospital visits, the mandatory wearing of high-efficiency masks by healthcare workers, an advisory for the general public to wear less-efficient masks, and rec-ommendations to reduce public contact. According to the
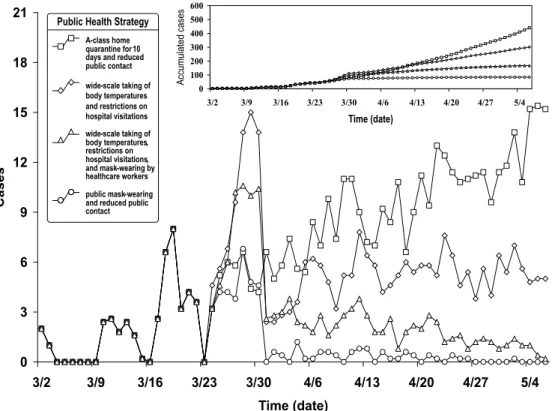
simulation results presented in Figure 5, a combination of mask wearing by the general public and reduced contact in public places was most successful for suppressing the spread of SARS. Note that enforced mask wearing entails some social and financial costs, but limited public contact does not.
Our simulation results also suggest that a combina-tion of temperature measurement, restricted hospital vis-itations, and mask-wearing by healthcare workers should only be considered remedial reactions to any contagious disease outbreak, since they do not affect patients who are in the incubation stage or suffering from minor symp-toms. In addition, this strategy suite requires substantial amounts of labor and material resources. The combina-tion of home quarantine and reduced contact in public places has high social costs, with results dependent upon how well the isolation guidelines are followed. Numerous instances of intra-family infections were reported during the 2003 SARS outbreak: evidence that certain prevention strategies were ineffective.
To simultaneously assess efficacy and costs, epidemi-ology instructors must help their students recognize differ-ences in how governments implement intervention strate-gies, and then encourage discussion of the effects of lim-ited resource allocations. Resources such as vaccines, hos-pital beds, healthcare workers, and high-efficiency pro-tection masks may be extremely limited or non-existent for an unidentified large-scale epidemic outbreak.
Allo-Figure 5. A comparison of various public health policy suites in the third instructional simulation experiment. We used the eight imported
cases reported in Singapore to trigger the simulation. Policy suites went into effect on day 24 of our 66-day simulation. Suite 1: A-class home quarantine for 10 days and reduced public contact. Suite 2: wide-scale taking of body temperatures and a restriction on hospital visitations. Suite 3: wide-scale taking of body temperatures, a restriction on hospital visitations, and mask wearing by healthcare workers. Suite 4: public mask wearing and reduced public contact.
cating limited resources should be a central learning ob-jective for students working with large-scale epidemic simulations.
6. Layer 2: Bipartite Network HIV Epidemic Simulation Involving IDUs
According to annual statistics presented by Taiwanese health authorities [38], the number of HIV-1-infected pa-tients increased nationally from 861 in 2003 to 1,519 in 2004 to 3,386 in 2005 (Figure 6). The proportion of IDUs in this population increased from 8.6% in 2003 to 35.8% in 2004 to 71% in 2005 (see [20]). In light of these sharp increases, government agencies initiated several projects aimed at identifying at-risk populations and controlling the rate of new infections. Owing to our success simu-lating the 2003 SARS outbreak [18, 19], we were asked by the Taiwan Centers for Disease Control (CDC) to col-laborate with Professor Yi-Ming A. Chen of the AIDS Prevention and Research Center of National Yang-Ming University to build a network-based epidemic simulation capable of predicting HIV-1 infections among Taiwanese IDUs.
6.1 Data Collection
We used data on HIV-positive Taiwanese gathered be-tween 1984 and 2008. Bebe-tween November 2004 and De-cember 2006 we collected HIV-1-seropositive blood sam-ples and conducted questionnaire interviews with 518 inmates living in four detention centers and two pris-ons across Taiwan. Of these, 3% were teenagers, 73% adults, and 24% adults 60 years of age or older (mean age 32.647.7 years). A large majority (505, or 97.4%) de-scribed themselves as IDUs. The women in our sample were three times more likely than their male counterparts to have had sex partners who were also IDUs (65.8% ver-sus 19.4%). On average, each IDU shared a drug dilution chemical with two or three other IDUs between two and three times per month1 86.9% stated that they had shared heroin diluent, and 98% said they had shared either diluent or syringes. Results from a logistic regression produced 17.2, 34.0, and 46.7 odds ratios for sharing heroin diluent, sharing syringes, or sharing both diluent and syringes, re-spectively. In summary, the most important HIV-1 infec-tion factors for the IDUs in our sample were heroin dilu-tion sharing, syringe sharing, number of IDUs using the same syringe, and education level.
Figure 6. Number of HIV-1 infections in Taiwan from January 1984 to December 2008
6.2 Simulation Model
Since our data were limited to the average number of sy-ringe and diluent-sharing events per month and average number of persons sharing them per occasion, we treated users as abstract neighbors when developing a bipartite network model based on our social mirror identity cept (Figure 7). The model consisted of two layers con-nected by social mirror identities: an upper layer repre-senting real-world high-risk locations, and a lower layer for simulating IDUs. The ‘P’ individual in Figure 7 vis-ited more high-risk places than other IDUs1 ‘L’ marks a frequently visited gathering place.
The time unit used in this simulation was equivalent to one month in the real world. Results and epidemic curves are reported for each year. We used the average number of syringe and diluent-sharing events per month to repre-sent the number of social mirror identities belonging to a lower layer IDU. For the upper layer we used the aver-age number of persons sharing either syringes or a chem-ical diluent during each occasion to represent the number of IDUs gathered at a high-risk location. Real-world IDU gathering places are located throughout the country and in multiple locations in individual cities, meaning that the spread of HIV among different high-risk locations has no effect on local spreading. In contrast, note that the CAS-MIM for our SARS simulation incorporated the effect of local spreading, meaning that SARS could still spread to any other location via transmission between local neigh-bors in the absence of social mirror identities or shortcuts. Since these high-risk locations are not adjacent, the same
Figure 7. Bipartite relations among injecting drug users (IDUs)
and their meeting locations.
CASMIM is inappropriate for simulating HIV transmis-sion among IDUs.
While we were able to obtain data on the statistical distribution of shared syringe and diluent events, we had no data on the statistical distribution of IDUs at each lo-cation. According to the most common topological fea-tures of social networks, we assumed that this reflects a power-law connectivity distribution. However, we had in-sufficient empirical data for model validation, especially since the reported number of infected individuals may not have contained concealed cases. This situation shows how difficult it is to build a HIV epidemic simulation with-out sufficient support in the form of demographic data for building detailed syringe and diluent-sharing rules for IDUs.
Figure 8. A comparison of actual and predicted HIV epidemic curves from 2003 to 2010 in Taiwan. In this prediction simulation, we averaged
1,000 independent experiments to obtain the mean value of error in the epidemic parameter space, then chose parameters and designated those with minimum mean error as optimal parameters. As shown in the figure, our prediction results correspond to the best among 30 simulations according to the optimal parameters. The parameters did not change over time, that is, predictions were only valid for cases with no additional interventions.
6.3 Discussion
In Figure 8, the dark gray (blue) bar represents 19 years (1984–2002) of HIV data used for model training and fitting, and the light gray (pink) bar represents 6 years (2003–2008) of data used for model testing and validation. For each simulation we activated a harm reduction pol-icy in December 2005 (time step 264) and increased the policy participation rate from 30% to 80% in June 2006 (time step 270). Prediction results are presented as the (red) block curve (2003–2010). Pre-2006 results exceeded actual 2003–2008 HIV epidemic curves (e.g. 1,047 cases predicted for 2003 compared with 861 actual), while post-2007 results were less than the actual number (1,782 ver-sus 1,935).
Taiwanese health authorities initiated a HIV harm re-duction policy in December 2005. Despite the low partic-ipation rate (30%), it exerted a strong positive effect in terms of controlling the epidemic by reducing the number of new HIV-positive cases from 3,386 to 2,924 by the end of 2006. This represents the first decrease in the number of new HIV cases in Taiwan since 1986. A stronger harm reduction policy was activated in June 2006, resulting in a further decrease in the number of new HIV-positive cases to 1,935 by the end of 2007. Our 2002–2010 simulation results also indicate a decreasing trend, and suggest that an ongoing harm reduction plan would both lower the num-ber of new HIV-positive individuals and reduce the HIV
R0value from 28 (1984–2006) to 1.1 (2007–2008).
7. Layer 4: Geographic Influenza Simulation Up to two billion people may be susceptible to the next highly pathogenic influenza virus1 the mortality rate could approach 65% (see [39]). According to WHO surveil-lance reports [40], a novel influenza virus is inevitable, yet it is impossible to predict when and in what form the virus will invade individual countries, or how it will specifically threaten the health of individuals. As this pa-per was being written, the first reports of a potential swine flu pandemic were being published in media outlets all over the world. Taiwanese health authorities have already announced three major intervention strategies: vaccines, antiviral drugs, and rapid containment operations. As part of this program, in 2006 we joined a two-year project managed by the Taiwan CDC to work with sociologists to develop a multi-region influenza simulation for the en-tire country. Lacking epidemiological data for prior out-breaks, we simulated the transmission dynamics of sea-sonal influenza and assessed the efficacies of prevention and intervention strategies to determine the optimal appli-cation timing of vaccine and antiviral drug responses.
7.1 Data Collection
We used transportation data to establish a model of daily inter- and intra-regional contact between individu-als: specifically, statistics for the average daily movement of railway passengers between counties and cities (Ta-ble 5). Demographic data from the 2006 Social Indicators
Figure 9. Statistical distribution of numbers of persons in regularly visited locations such as households, workplaces, and classrooms
Report [41] published by the Taiwanese government were used to assign individuals to various locations. These data included statistical distributions of family members per household in each county, numbers of employees in work-places, and numbers of students in classrooms. We com-bined data in an effort to achieve an approximate under-standing of the overall distribution of the number of per-sons in each regularly visited activity location. As shown in Figure 9, most activity locations had fewer than 101 exceptions included movie theaters and classrooms, each with 40 or more.
7.2 Simulation Model
Based on our SARS modeling and simulation experi-ence, we knew that CASMIM is suitable for simulating the transmission dynamics of contagious diseases in well-mixed, but not in poorly well-mixed, modern cities. We there-fore assigned a separate CASMIM to each county, with model scale determined by the number of counties in-cluded in the overall simulation. Each CASMIM model cell represented one real-world activity location (house-hold, classroom, train station, etc.), and the number of in-dividuals in each cell was assigned according to the statis-tical distribution of numbers of observed persons in regu-larly visited locations (Figure 10). Railway transportation data were used to represent inter-county movement, with each instance representing a pair of social mirror identities belonging to the same individual but in different counties. As seen in Figure 10, social mirror identities for the ma-jority of individuals stayed within the same county. Since the incubation period for influenza is only 1–3 days, the
Figure 10. Multiple cellular automata with intra- and inter-city
social mirror identities1 each mirror identity represents inter-city movement
simulation time unit in this simulation was equivalent to one day in the real world.
The epidemiological progress states for influenza shown in Figure 11 are the same as those described by Longini et al. [42] and used in Stroud et al.’s
influ-Figure 11. Epidemiological progress states of epidemic influenza disease manifestations for four age categories with no treatment [42, 43]
enza simulation system [43]. Separate epidemiological progress states were implemented for four demographic categories: preschool (younger than 5), youth (between 5 and 21), adult (between 21 and 65), and senior (older than 65). Base infection rate (infectivity level) was established as 0.21888 per contact per day for adults and symptomatic seniors, and 0.43680 per contact per day for symptomatic preschoolers and youths. The rate of asymptomatic infec-tious individuals was equal to one-half the base infection rate (Figures 5(a) and 11).
One shortcoming of our multi-region influenza sim-ulation model was its lack of network topology proper-ties for an epidemic simulation model consisting of multi-ple poorly mixed cities. Unlike a well-mixed modern city, modelers cannot assume that interaction and contact net-works of individuals distributed among multiple counties have small-world properties. In addition, there is a lack of epidemiological data for recent novel influenza pandemics to use for empirical validation. Some epidemiologists
have constructed simulations of the 1918–1919 influenza pandemic [43], but we believe the network topology struc-ture of modern metropolitan areas is very different from that observed in 1918. Despite these weaknesses, we used our multi-region influenza model to simulate the trans-mission dynamics of seasonal influenza and to assess the efficacies of a vaccine policy and intervention strategies under different conditions and in different regions.
7.3 Discussion
We used two assessment indicators (prevention effect and cost–efficacy) to replace previously employed epidemic curves to help epidemiologists and public health experts assess the efficacies of intervention strategies. The pre-vention effect indicator
Table 6. Parameter settings for various intervention strategy experiments
Intervention Strategy Target Group
Inoculate individuals at random. Entire population.
Locate and inoculate those who have come into contact with infected individuals. Specific population segments.
Encourage hand washing and mask wearing by the general public during flu season. All individuals between the ages of 15 and 64.
Quarantine infected individuals until complete recovery. Home quarantine individuals who have come into contact with them for a minimum of eight days.
Specific population segments.
Give anti-virus medicine in advance for prevention purposes. Entire population.
was used to evaluate specific intervention strategies1 its value was set at more than one to produce better effects, since for values less than one the strategy actually sup-ports the spread of a disease. By comparing different poli-cies at this level, public health experts can identify the best intervention strategy. The cost–efficacy indicator
Cost_Efficacy(Strategy A) 2
1Total infected cases with activating any strategy
5Total infected cases with A activated
2
Total consumed resource costs of A (2)
was used to evaluate the prevention effect per unit cost1 its value was purposefully made positive to produce bet-ter effects, since the policy has no preventive effect when the value is zero. Public health experts can use the same benchmark to make decisions regarding the best timing of intervention strategies in response to a novel influenza.
We used our influenza simulation to compare preven-tion effects and cost-efficacies for five intervenpreven-tion strate-gies, two regional densities (low and high), and three policy application dates (10/1–10/07, 10/22–10/28, and 11/19–11/25). The five intervention strategies and corre-sponding objects were (1) giving the vaccine to randomly chosen individuals, (2) tracking and inoculating individ-uals coming into contact with infected individindivid-uals, (3) strongly encouraging hand washing and mask wearing by the general public during the influenza season, (4) enforc-ing home quarantines for infected individuals until they recover and for individuals who have come into contact with them for a minimum of eight days, and (5) giving anti-virus medicine in advance to all individuals (Table 6). As shown in Figure 12, the two most effective interven-tion strategies were giving vaccines to randomly chosen individuals and using anti-virus medicines. The combi-nation of encouraging hand washing and mask wearing was the third best. All three policies were more effective when activated as early as possible, with little difference in effect between activating the policies in late October and late November. Our main conclusions derived from the simulation results were (a) the combination of hand washing and mask wearing by the general public during the influenza season is the most cost-effective policy, and (b) using anti-virus medicine in advance is more cost-effective than buying and using a mix of vaccines and anti-virus medicines (Figures 12 and 13).
8. Conclusion
In this paper we have proposed a pre-analysis architecture for network-based epidemic simulations for training stu-dents and novice researchers, and have given examples of architecture reductions and extensions in terms of avail-able geographic and demographic data. Epidemiologists can use this information to support such tasks as analyz-ing spreadanalyz-ing situations and outbreak patterns, predictanalyz-ing future transmission dynamics, and assessing the efficacies of intervention strategies for disease prevention and con-trol, vaccine development, and other efforts to fight epi-demics. We have also described three sample applications of network-based epidemic simulations.
Based on our experiences teaching epidemiological modeling and simulations, we have identified three chal-lenges for instructors: the choice of a suitable network model, preparation for instruction-based teaching, and evaluating student understanding. Network-based simula-tions for solving epidemiology issues require more demo-graphic and geodemo-graphic data support and higher levels of initial domain knowledge. In other words, most epidemi-ology issues require collaborations among computer sci-entists, epidemiologists, and policy decision makers.
Developing appropriate prevention and control mea-sures entails making and monitoring the results of mul-tiple rules and decisions made at different points during an epidemic. Conflicts among decision criteria for dif-ferent strategies are inevitable, and our proposed simula-tion architecture based on demographic and geographic properties can help decision makers test and refine differ-ent intervdiffer-ention strategies at differdiffer-ent layers. By analyz-ing multi-scale interactions, decision makers can prepare themselves for making rapid proactive intervention deci-sions in response to identified outbreak transmission path-ways. Furthermore, our social mirror identity concept can provide additional geospatial insight into epidemiological processes underlying control measures. In the future, spa-tial orientation and visualization will be required for mon-strategies. Our plans include incorporating a geographic information system (GIS) into our architecture and sim-ulations in order to capture spatial variation in disease transmission throughout Taiwan. The GIS will support a visual analysis of the spatial impacts of individual control measures. We believe that combining network-based epi-itoring disease progress and generating potential control
Figure 12. Comparisons of prevention effects among five intervention strategies: 1, inoculate individuals at random1 2, locate and inoculate
those who have come into contact with infected individuals1 3, encourage hand washing and mask wearing by the general public during the flu season1 4, quarantine infected individuals until complete recovery, and home quarantine individuals who have come into contact with them for a minimum of eight days1 5, give anti-virus medicine in advance for prevention purposes, activated on three policy activation dates (beginning of October1 end of October1 end of November) and for different population densities (high and low).
demic simulations, spatial visualization, and geographic information will support the efforts of epidemiologists to clarify spatial and temporal characteristics when analyz-ing pandemic preparation and control measures.
9. Acknowledgements
This work was supported in part by the Republic of China (ROC) National Science Council (NSC97-2221-E-182-046 and NSC97-2314-B-002-180), Chang Gung Univer-sity (UERPD270281), and Chang Gung Memorial Hospi-tal (CMRPD260022). Tzai-Hung Wen also acknowledges administrative support from the Infectious Disease Re-search and Education Center, Department of Health, Ex-ecutive Yuan, and National Taiwan University.
10. References
[1] Newman, M.E.J. 2001. Who is the best connected scientist? A study of scientific coauthorship networks. Physics Review, 64(4): 046131–046132.
[2] Axelrod, R. 1997. Advancing the art of simulation in the social sci-ences. Complexity, 3(2): 16–22.
[3] Gilbert, G. N. and K. G. Troitzsch. 1999. Simulation for the Social
Scientist, Open University Press, Philadelphia, PA.
[4] Newman, M.E.J. 2004. Coauthorship networks and patterns of scien-tific collaboration. Proceedings of the National Academy of
Sci-ences of the United States of America, 101: 5200–5205.
[5] Born, R.G. 2003. Teaching discrete event simulation to business stu-dents: the alpha and omega. In Proceedings of the Winter
Simu-lation Conference, Piscataway, NJ, Vol. 2, pp. 1964–1972.
[6] Barabási, A.L. and Z.N. Oltvai. 2004. Network biology: understand-ing the cell’s functional organization. Nature Reviews Genetics, 5(2): 101–113.
[7] Ravasz, E., A.L. Somera, D.A. Mongru, Z.N. Oltvai and A.L. Barabási. 2002. Hierarchical organization of modularity in metabolic networks. Science, 297(5586): 1551–1555.
[8] Grimm, V. 2005. Individual-based Modelling and Ecology, Princeton University Press, Princeton, NJ.
[9] Alfonseca, M., M.T. Martinez-Bravo and J.L. Torrea. 2000. Math-ematical models for the analysis of Hepatitis B and AIDS epi-demics. Simulation, 74(4): 219–226.
[10] Nagel, K. 2004. Multi-agent transportation simulation. Traffic, 2:2. [11] Koelle, H.H. and B. Johenning. 1997. Space transportation
simu-lation model (TRASIM 2.0), Technische Universität Berlin,
Ger-many: ILR Mitt. 319.
[12] Siallagan, M., N. Juhana, S. Novani and U.S. Putro. 2006. Appli-cations of agent-based modelling and simulation of fuel distrib-ution in Indonesia. In Proceedings of World Congress of Social
simulation, Kyoto, Japan.
[13] Boccara, N. and K. Cheong. 1993. Critical-behavior of a probabilistic-automata network SIS model for the spread of an infectious-disease in a population of moving individuals.
Jour-nal of Physics A: Mathematical and General, 26: 3707–3717.
[14] Barrett, C.L., S.G. Eubank and J.P. Smith. 2003. If smallpox strikes Portland. Scientific American, 292(3): 42–49.
[15] Hsieh, J.L., C.Y. Huang, C.T. Sun and Y.M.A. Chen. 2005. Us-ing the CAMIM small-world epidemic model to analyze public health policies. In Proceedings of Western Multiconference on
Health Sciences Simulation, New Orleans, LA, pp. 63–69.
[16] Schneeberger, A., C.H. Mercer, S.A.J. Gregson, N.M. Ferguson, C.A. Nyamukapa, R.M. Anderson, A.M. Johnson and G.P. Gar-nett. 2004. Scale-free networks and sexually transmitted dis-eases: a description of observed patterns of sexual contacts in
Britain and Zimbabwe. Sexually Transmitted Diseases, 31(6): 380–387.
[17] Ferguson, N.M., D.A.T. Cummings, S. Cauchemez, C. Fraser, S. Ri-ley, A. Meeyai, S. Iamsirithaworn and D.S. Burke. 2005. Strate-gies for containing an emerging influenza pandemic in Southeast Asia. Nature, 437(7056): 209–214.
[18] Huang, C.Y., C.T. Sun, J.L. Hsieh and H. Lin. 2004. Simulating SARS: small-world epidemiological modelling and public health policy assessments. Journal of Artificial Societies and Social
Simulation, 7(4): http://jasss.soc.surrey.ac.uk/7/4/2.html.
[19] Huang, C.Y., C.T. Sun, J.L. Hsieh, Y.M.A. Chen and H. Lin. 2005. A novel small-world model: using social mirror identities for epi-demic simulations. Simulation, 81(10): 671–699.
[20] Sumodhee, C., J.L. Hsieh, C.T. Sun, C.Y. Huang and Y.M.A. Chen. 2005. Impact of social behaviors on HIV epidemic: a computer simulation view. In Proceedings of International Conference on
Computational Intelligence for Modelling, Control and Automa-tion, Vol. 2, pp. 550–556.
[21] Stroud, P., S.D. Valle, S. Sydoriak, J. Riese and S. Mniszewski. 2007. Spatial dynamics of pandemic influenza in a massive ar-tificial society. Journal of Arar-tificial Societies and Social
Simula-tion, 10(4): http://jasss.soc.surrey.ac.uk/10/4/9.html.
[22] Hsieh, J.L., C.T. Sun, G.Y.M. Kao and C.Y. Huang. 2006. Teaching through simulation: epidemic dynamics and public health poli-cies. Simulation, 82(11): 731–759.
[23] Colpitts, B.G. 2002. Teaching transmission lines: a project of measurement and simulation. IEEE Transactions on Education, 45(3): 245–252.
[24] Liao, Y.H. and C.T. Sun. 2001. An educational genetic algorithms learning tool. IEEE Transactions on Education, 44(2): 20. [25] Wenglinsky, H. 1998. Does it Compute? The Relationship Between
Educational Technology and Student Achievement in Mathemat-ics, Educational Testing Service, Princeton, NJ.
[26] Oehme, F. 2000. Learn by doing: how to include new requirements of research in engineering education. European Journal of
Engi-neering Education, 25(2): 131–137.
[27] Bruner, J.S. and R.A. Lufburrow. 1963. The process of education.
American Journal of Physics, 31: 468.
[28] Piaget, J. 1978. The Development of Thought: Equilibration of
Cog-nitive Structures, Viking Press, New York.
[29] Savery, J.R. and T.M. Duffy. 1995. Problem based learning: an in-structional model and its constructivist framework. Educational
Technology, 35(5): 31–38.
[30] Aldrich, C. 2004. Simulations and the Future of Learning: An
In-novative (and Perhaps Revolutionary) Approach to E-Learning,
Pfeiffer, San Francisco, CA.
[31] Bertsche, D., C. Crawford and S.E. Macadam. 1996. Is simulation better than experience. The McKinsey Quarterly, 1(1): 50–58. [32] Hargrave, C.P. and J.M. Kenton. 2000. Preinstructional simulations:
implications for science classroom teaching. Journal of
Comput-ers in Mathematics and Science Teaching, 19(1): 47–58.
[33] Levy, M., H. Levy and S. Solomon. 1995. Microscopic simulation of the stock market: the effect of microscopic diversity. Journal
de Physique I, 5: 1087–1107.
[34] Klein, C.A., L.S. Berlin, T.J. Kostolansky and J.R. Del Palacio. 2004. Stock Simulation Engine for an Options Trading Game, Google Patents.
[35] Huang, C.Y., C.T. Sun and H.C. Lin. 2005. Influence of local in-formation on social simulations in small-world network mod-els. Journal of Artificial Societies and Social Simulation, 8(4): http://jasss.soc.surrey.ac.uk/8/4/8.html.
[36] Moore, C. and M.E.J. Newman. 2000. Epidemics and percolation in small-world networks. Physical Review E, 61(5): 5678–5682. [37] Kao, R.R., L. Danon, D.M. Green and I.Z. Kiss. 2006. Demographic
structure and pathogen dynamics on the network of livestock movements in Great Britain. Proceedings of the Royal Society
B: Biological Sciences, 273(1597): 1999–2007.
[38] World Health Organization (WHO). 2003. HIV/AIDS in Asia and
[39] World Health Organization (WHO). 2008. Confirmed
Hu-man Cases of Avian Influenza A (H5N1), WHO, Geneva,
http://www.who.int/csr/disease/avian_influenza/country/cases_ table_2008_09_10/en/index.html.
[40] World Health Organization (WHO). 2007. Ten Things You
Need to Know About Pandemic Influenza, WHO, Geneva,
http://www.who.int/csr/disease/influenza/pandemic10things/en/. [41] Directorate General of Budget, Accounting and Statistics. 2006.
So-cial Indicators, Executive Yuan, Republic of China.
[42] Longini, I.M., Jr, A. Nizam, S. Xu, K. Ungchusak, W. Han-shaoworakul, D.A.T. Cummings and M.E. Halloran. 2005. Con-taining pandemic influenza at the source. Science, 309(5737): 1083–1087.
[43] Stroud, P., S.D. Valle, S. Sydoriak, J. Riese and S. Mniszewski. 2007. Spatial dynamics of pandemic influenza in a massive ar-tificial society. Journal of Arar-tificial Societies and Social
Simula-tion, 10(4): http://jasss.soc.surrey.ac.uk/10/4/9.html.
Chung-Yuan Huang received his M.S. degree in computer
in-formation and science (2000) and his PhD in computer sci-ence (2005), both from the National Chiao Tung University, Tai-wan. He is currently an Assistant Professor in the Department of Computer Science and Information Engineering and a member
of the Research Center for Emerging Viral Infections at Chang Gung University, Taiwan. His research interests include complex adaptive networks and systems, agent-based modeling and sim-ulation for social science research, and computational epidemi-ology.
Yu-Shiuan Tsai received his B.S. and M.S. degrees in
mathemat-ics from the National Taiwan University, Taiwan, in 2002 and 2005, respectively. He is currently a PhD candidate in the De-partment of Computer Science, National Chiao Tung University. His current research interests include complex networks and sys-tems, social simulations, and computational epidemiology.
Tzai-Hung Wen (corresponding author) received his PhD degree
in 2006 and currently is an Assistant Professor in the Graduate Institute of Epidemiology, National Taiwan University, Taiwan. He is also a faculty member of the Infectious Diseases Research and Education Center at National Taiwan University and De-partment of Health, Executive Yuan, Taiwan. His research inter-ests cover applications of geographic information systems (GIS) and geospatial modeling in public health-related issues, espe-cially in infectious disease epidemiology and evaluation of con-trol strategies for epidemics.