Long-term exposure to traf
fic-related air pollution and systemic lupus
erythematosus in Taiwan: A cohort study
Chau-Ren Jung
a,b, Wan-Ting Chung
a, Wei-Ting Chen
c, Re-Yang Lee
d,⁎⁎
, Bing-Fang Hwang
a,e,⁎
aDepartment of Occupational Safety and Health, College of Public Health, China Medical University, Taichung, Taiwan
bJapan Environment and Children's Study Programme Office, Centre for Health and Environmental Risk Research, National Institute for Environmental Studies, Tsukuba, Japan c
Department of Atmospheric Sciences, National Taiwan University, Taipei, Taiwan
d
Department of Land Management, College of Construction and Development, Feng Chia University, Taichung, Taiwan
e
Department of Occupational Therapy, College of Medical and Health Science, Asia University, Taichung, Taiwan
H I G H L I G H T S
• Only a few studies examine the effects of air pollution on SLE.
• A 1-km resolution hybrid satellite-based model and land use regression were used to estimate air pollutants' concen-trations.
• There were positive associations of SLE with long-term exposure to CO, NO2,
and PM2.5.
• In the exposure-response relationships, exposure to CO (N0.6 ppm), NO2
(28–38 ppb), and PM2.5(18–46 μg/m3)
were associated with the increased risk of SLE. G R A P H I C A L A B S T R A C T
a b s t r a c t
a r t i c l e i n f o
Article history: Received 24 October 2018Received in revised form 26 February 2019 Accepted 1 March 2019
Available online 03 March 2019 Editor: Jay Gan
Systemic lupus erythematosus (SLE) is a multi-systemic chronic autoimmune disease, the etiology of SLE is still un-clear. Only a few studies evaluated the associations between air pollution and SLE. We conducted a population-based cohort study in Taiwan to examine the associations of air pollution with SLE. A total of 682,208 individuals aged 18–70 years were retrieved from National Health Insurance Research Database. We applied 1-km resolution land use regression and satellite-based models to estimate air pollutant concentrations during 2001–2010. The mixed ef-fect Cox models with time-dependent variables were performed to estimate the associations between air pollution and SLE, as hazard ratios (HRs) with 95% confidence interval (CI). We identified 1292 newly diagnosed SLE patients with average age of 43.26 ± 13.64 years, most of them were female. There were positive associations of SLE with exposure to a 9.76 ppb increase in nitrogen dioxide (NO2), a 0.20 ppm increase in carbon monoxide (CO), and a
10.2μg/m3increase infine particles (PM
2.5) (HR = 1.21, 95% CI: 1.08–1.36, HR = 1.44, 95% CI: 1.31–1.59, and HR
= 1.12, 95% CI: 1.02–1.23, respectively). Additionally, we observed negative associations with ozone (O3) and sulfur
dioxide (SO2). According to the exposure-response relationships, exposure to NO2between 28 and 38 ppb, exposure
to CO above 0.6 ppm, and exposure to PM2.5between 18 and 46μg/m3were positively associated with SLE. The
re-sults suggested that long-term exposure to traffic-related gaseous air pollutants (NO2and CO) less than current
Na-tional Ambient Air Quality Standards and PM2.5are significantly associated with the risk of SLE.
© 2019 Elsevier B.V. All rights reserved.
Keywords: Air pollution Land use regression Satellite-based models Systemic lupus erythematosus Particulate matter
Traffic-related gaseous air pollutants
⁎ Correspondence to: B.-F. Hwang, Department of Occupational Safety and Health, College of Public Health, China Medical University, No 91 Hsueh-Shih Rd, Taichung 40402, Taiwan. ⁎⁎ Correspondence to: R.-Y. Lee, Department of Land Management, College of Construction and Development, Feng Chia University, No 100 Wenhwa Rd, Taichung, 40724, Taiwan.
E-mail addresses:[email protected](W.-T. Chung),[email protected](W.-T. Chen),[email protected](R.-Y. Lee),[email protected](B.-F. Hwang).
https://doi.org/10.1016/j.scitotenv.2019.03.018
0048-9697/© 2019 Elsevier B.V. All rights reserved.
Contents lists available atScienceDirect
Science of the Total Environment
1. Introduction
Systemic lupus erythematosus (SLE) is a multi-systemic chronic au-toimmune disease, and its etiology is still unclear. Previous studies have indicated that SLE may trigger by environmental factors (Barbhaiya and Costenbader, 2016). Air pollution has been demonstrated to induce sys-temic inflammatory responses (Törnqvist et al., 2007), which is specu-lated as a potential risk factor for development of autoimmune rheumatic disease (Sun et al., 2016).
Only a few epidemiological studies have assessed the associations between air pollution and SLE. Bernatsky and colleagues in Quebec, Canada recruited 237 SLE patients and reported significant positive associations between particulate matter with an aerodynamic diam-eterb2.5 μm (PM2.5) and SLE activity (i.e., antibodies against
double-stranded DNA and renal casts) (Bernatsky et al., 2011). Fernades and coworkers conducted a longitudinal panel study of repeated mea-sures utilizing 409 consecutive medical visits in Sao Paulo, Brazil to evaluate the associations between short-term exposure to air pollu-tion and juvenile-onset SLE. They found the positive significant asso-ciations of juvenile-onset SLE activity with an interquartile range (IQR) change of nitrogen dioxide (NO2) at 13 days after exposure,
an IQR change of carbon monoxide (CO) at 13 days after exposure, and an IQR change of particulate matter with an aerodynamic diam-eterb10 μm (PM10) at 13 and 16 days after exposure, respectively
(Fernandes et al., 2015). Based on the extent of clinicopathology,
au-toimmune diseases are classified into organic-specific and systemic
with multi-organ involvement (Goldblatt and O'Neill, 2013;Kono
and Theofilopoulos, 2013). In systemic autoimmune rheumatic dis-eases (SARDs), the regulation of immune system between invade
pathogen recognition and self-recognition are impaired (
Wahren-Herlenius and Dorner, 2013). SARDs is a group of systemic autoim-mune diseases including SLE, Sjogren's Syndrome, scleroderma, polymyositis, dermatomyositis, or undifferentiated connective
tis-sue disease (Kono and Theofilopoulos, 2013). There were two
an-other studies have investigated the associations between SARDs and air pollution. Bernatsky and colleagues conducted an ecological study during 1993–2007 in Calgary city, Canada using land use re-gression (LUR) models to estimate long-term PM2.5and NO2
concen-trations. They analyzed the SARDs prevalence rates for each Calgary dissemination area (DA). A positive significant association between
PM2.5 and the risk of SARDs (odds ratio (OR) = 1.10, 95% CI
1.01–1.22) was observed when taking into accounts all Calgary sub-jects, but not for NO2(OR = 1.00, 95% CI 0.98–1.02) (Bernatsky et al.,
2015). Additionally, the same study group carried out a population-based cross-sectional study in Alberta and Quebec, Canada using satellite-based remote sensing data to estimate PM2.5concentrations
(2001–2006) for each DA in Alberta and each local social and health service center area (CLSC) in Quebec. They found OR of SARDs was increased with PM2.5levels in Alberta areas, (the OR of exposure to
PM2.5level≥ 8.12 μg/m3was 1.13, 95% CI 1.02–1.25 for non-first
na-tions residents) and in Quebec areas (the OR of exposure to PM2.5
level≥ 11.81 μg/m3was 1.45, 95% CI 1.36–1.56) (Bernatsky et al.,
2016). Overall, increased concentrations of PM2.5may be correlated
with the increased risk of SARDs based on previous studies. To our knowledge, the existed studies have rarely focused on the as-sociations of SLE with long-term exposure to air pollution. Air pollution is a mixture of gases and particles, one of the main emission sources of air pollution in Taiwan is due to traffic. Traffic-related pollutants include gaseous species (carbon dioxide, CO, hydrocarbons, NOx), and PM
emit-ted from motor vehicles (HEI, 2010). In the study, we hypothesized that increased traffic-related gaseous air pollutants (i.e., CO, NO2) and PM2.5
concentrations may positively associate with the risk of SLE, we con-ducted a ten-years prospective cohort study to examine the hypothesis. Land use regression (LUR) models was used to estimate ground-level concentrations for traffic-related gaseous air pollutants (CO and NO2),
ozone (O3), and sulfur dioxide (SO2), and an advance satellite-based
estimation model was applied to precisely estimate ground-level PM2.5in Taiwan.
2. Material and methods 2.1. Study population and design
Taiwan launched its National Health Insurance Program on March 1, 1995. The National Health Insurance Administration appointed the National Heath Research Institutes (NHRI) to publish the National Health Insurance Research Database (NHIRD) for research purpose since 2000. This population-based cohort study was based on a
sub-set of NHIRD—the longitudinal health insurance database 2000
(LHID 2000). The LHID 2000 is afixed cohort of one million individ-uals that were randomly selected from the registry of beneficiaries of the NHIRD in 2000. The LHID2000 is a representative group for the entire population of Taiwan in 2000 (Wang et al., 2018). The
individ-uals in the LHID2000 were anonymous and de-identified to protect
their privacy. The NHRI announced that there are no significant dif-ferences in sex distribution, age distribution, number of neonates every year, and amount of average insured payroll-related amount
between the individuals in the LHID2000 and the NHIRD (NHRI,
2018). This study has been approved by the institute review board of China Medical University Hospital (CMU-REC-101-012), and it complied with the principles outlined in the Helsinki Declaration.
We retrieved participants aged18–70 years at the baseline (January 1, 2001) and followed up to the end of 2010 as study population. Partic-ipants met the following criteria were excluded from the study: individ-uals who received SLE diagnoses during January 1, 1996 to December 31, 2000 (n = 1152), who had missing information on sex (n = 418), missing information on the residential address (n = 43), and whose residential address located outside Taiwan main island and in the mountain area (n = 4004). Finally, this cohort comprises a total of 682,208 individuals.
2.2. Outcome of interest
The LHID2000 provides personal diagnostic information based on the International Classification of Diseases, Ninth Revision, Clinical Modification (ICD-9-CM). To ensure the accuracy of diagnoses, the Na-tional Health Insurance Administration appointed another independent team to examine and review afixed proportion of the cases in the data-base (Lin et al., 2010). In this study, we selected individuals who re-ceived more than two consistent SLE diagnosis codes (ICD-9-CM code: 710.0) in outpatient visits or inpatient visits and defined incident SLE as individuals received thefirst diagnosis of SLE (Chan et al., 2016). 2.3. Exposure assessment
In this study, we leveraged LUR models to estimate ground-level concentrations of CO, NO2, O3, and SO2. The LUR model is a high spatial
resolution and cost-efficient method, which can capture variability of air pollution concentrations on intra-urban scale (Jerrett et al., 2005;Lee et al., 2015;Wu et al., 2017). The LUR models in this study were modi-fied from the European Study of Cohorts for Air Pollution Effects (ES-CAPE) modelling approach to estimate annual average air pollution concentration at 1-km spatial resolution (Beelen et al., 2013). The de-tails of LUR models please refer to the supplementary materials. Addi-tionally, in our previous work, we showed that satellite-based model is a reliable and validated method for estimating PM2.5concentrations
in Taiwan (Jung et al., 2018). We modified the 10-km resolution
model into a 1-km resolution model that incorporating the Multi-Angle Implementation of Atmospheric Correction (MAIAC) aerosol opti-cal depth (AOD), meteorologiopti-cal variables, and land-use variables to es-timate ground level PM2.5concentrations in this study. The details of the
calculated the annual average PM2.5 by averaging the daily PM2.5
estimates.
Then annual average concentrations of air pollutants, namely CO, NO2, O3, PM2.5, and SO2, were assigned to individuals according to
their residential address in post-code level.
2.4. Covariates
The covariates include age, socioeconomic status (SES) and co-morbidities. SES was derived by using the individual monthly in-sured payroll-related amount. We divided age and SES into four levels on the basis of quartiles (i.e.,b25th percentile, 25th to 50th percentile, 50th to 75th percentile, and≥75th percentile). The fol-lowing comorbidities were treated as potential confounders in the relationships between air pollution and SLE: cerebrovascular
dis-ease (ICD-9-CM codes: 430–438), chronic kidney disease (CKD)
(code: 585), coronary artery disease (codes: 410–414), diabetes
mellitus (code: 250), hyperlipidemia (code: 272), hypertension
(codes: 401–405), inflammatory bowel disease (IBD) (codes: 555,
556), and schizophrenia (code: 295) (Katsanos et al., 2012;Shen et al., 2014;Tiosano et al., 2017). Additionally, we used chronic ob-structive pulmonary disease (COPD) diagnosis as surrogate for smoking.
Lupus nephritis is a manifestation of SLE and is a major risk factor for morbidity and mortality in SLE (Almaani et al., 2017). Thus, we retrieved lupus nephritis cases (ICD-9-CM code: 583.81) from our dataset for sen-sitivity analyses.
2.5. Statistical analysis
We used mixed effect Cox models incorporating time-dependent variables for annual mean concentrations of air pollutants and random effects for post-code level to evaluate the associations between annual average air pollutants and SLE (Kleinbaum and Klein, 2012;Therneau, 2018). To analyze time to diagnosis of SLE, each individual's follow-up time was censored at the year when the insurance was terminated, the person died due to another causes, or at the end of the follow-up pe-riod. For pollutants that were positively and significantly associated with SLE, we further employed the distributed lag nonlinear model (dlnm) (dlnm package in the R program) to explore exposure-response relationships between air pollutants and SLE. The functions of curvefitting for exposure-response relationships (b-spline or natural cubic, and degree of freedom from 4 to 9) were chosen based on the minimum Akaike information criterion (AIC). SLE is more frequent among females than among males, which has an overwhelming female to male ratio (Pons-Estel et al., 2010). To explore the potential effect modification in air pollution and SLE by sex, we introduced an interac-tion term between each air pollutant and sex (pollutant × sex) into the mixed effect Cox models to identify significant interactions between each air pollutant and sex. The effects of air pollutants on SLE were re-ported as hazard ratio (HR) with their 95% confidence interval (CI) per IQR (0.20 ppm) increase in CO level, per 9.76 ppb increase in NO2, per
7.02 ppb increase in O3level, per 10.2μg/m3increase in PM2.5, and per
1.96 ppb increase in SO2level.
Air pollution is a complex mixture consisted of particles and gas-eous pollutants. Based on the properties of air pollution, we then considered the associations between pollutants and SLE after adjusting for the second pollutant. Wefirst fitted the single pollutant models, and then considered two pollutants models byfitting two air pollutants simultaneously in the same model. We did not include two pollutants that are highly correlated (if correlation coefficient N 0.8) into the same model to exclude the potential collinearity prob-lem. All statistical analyses were conducted in R program version 3.5.1 (Packages coxme and dlnm).
3. Results
3.1. Basic characteristics for study population
Table 1showed the demographic characteristics of the study popu-lation. The mean age of subjects received thefirst SEL diagnosis was 43.26 ± 13.64years (range from 18.77 to 78.49– years). There were 1292 incident SLE cases within the study population of 682,208 sub-jects, and the incidence rate (IR) was 1.93 per 10,000 person-year (95% CI: 1.83–2.04). The female is more likely to develop SLE than male (HR = 6.34; 95% CI: 5.42–7.42). The low SES group (with monthly insured payroll-related amount below 1249 New Taiwan dollar (NTD)) have higher risk of SLE than other group (using SESb 1249 NTD as refer-ence group, HR = 0.66, 95% CI: 0.56–0.78 for 1249 ≤ SES b 21,000 NTD; HR = 0.77, 95% CI: 0.67–0.90 for 21,000 ≤ SES b 31,800 NTD; HR = 0.75, 95% CI: 0.65–0.88 for SES ≥ 31,800 NTD). Moreover, comorbidities, namely cerebrovascular disease, CKD, COPD, coronary artery disease, hyperlipidemia, hypertension, and lupus nephritis are significantly and positively associated with SLE (Table 1).
3.2. Air pollution
The distributions of the annual average air pollutants' concentra-tions are shown inTable 2. There is a strong positive correlation be-tween NO2and CO concentrations (correlation coefficient (r) = 0.87).
This may reflect that the two pollutants have similar spatial distribution pattern in Taiwan (Fig. S2). The concentrations of NO2were moderately
positively associated with SO2and PM2.5(r = 0.40 and r = 0.54,
respec-tively). PM2.5concentrations were moderately correlated with SO2(r =
0.43). Additionally, the concentrations of O3were negatively correlated
with CO and NO2(r =₋0.47 and r = ₋0.36, respectively) (Table 3). This
revealed that the spatial distribution of O3was distinct from those of CO
and NO2(Fig. S2).
3.3. Air pollutants and systemic lupus erythematosus
According the results of single pollutant models, there were positive and statistical significant associations of SLE with exposure to an IQR in-crease (0.20 ppm) in CO concentrations (HR = 1.46, 95% CI: 1.33–1.61), an IQR increase (9.76 ppb) in NO2(HR = 1.24, 95% CI: 1.10–1.39), and
an IQR increase (10.2μg/m3) in PM
2.5(HR = 1.12, 95% CI: 1.02–1.23)
(Table 4). The trends did not change substantially after adjusting for confounders, including age, sex, SES, cerebrovascular disease, CKD, COPD, coronary artery disease, hyperlipidemia, and hypertension (ad-justed HR = 1.44, 95% CI: 1.31–1.59 for an IQR ppb increase in CO, ad-justed HR = 1.21, 95% CI: 1.08–1.36 for an IQR increase in NO2, and
adjusted HR = 1.12, 95% CI: 1.02–1.23 for an IQR increase in PM2.5,
re-spectively) (Table 4). On the contrary, there were statistical significant
and negative associations of SLE with O3and SO2(adjusted HR =
0.80, 95% CI: 0.73–0.89 for an IQR increase (7.02 ppb) in O3and adjusted
HR = 0.83, 95% CI: 0.76–0.90 for an IQR increase (1.96 ppb) in SO2,
re-spectively) (Table 4). We did not observe any significant interactions between each air pollutant and sex (p-value = 0.75 for the interaction term between CO and sex; p-value = 0.96 for NO2and sex; p-value =
0.96 for O3and sex; p-value = 0.65 for PM2.5and sex; and p-value =
0.33 for SO2and sex). The associations of SLE with air pollution is the
same strength in male and female group.
We further examined the exposure-response relationships of CO, NO2, and PM2.5(Fig. 1). For the dlnm of CO, the best AIC was obtained
with b-spline at the degree of freedom of 4 (minimum AIC = 39,526.95). The exposure-response relationship of CO showed that the HRs of SLE increased gradually between 0.60 and 0.90 ppm (HRs ranged from 1.02 to 2.06), and it reached a plateau at exposure to CO above 0.90 ppm (Fig. 1). For the dlnm of NO2, the best AIC was obtained
with b-spline at the degree of freedom of 5 (minimum AIC = 39,568.79). The exposure-response relationship of NO2is curvilinear,
which showed an inverted J-shape. The HRs of SLE were statistical sig-nificant and positive at exposure to NO2between 28 and 38 ppb, the
maximum HR of SLE occurred at NO2concentration of 36 ppb, and it
continuously decreased and became non-significant at exposure to
NO2above 39 ppb (Fig. 1). The dlnm of PM2.5revealed that the best
AIC was obtained with b-spline at the degree of freedom of 4 (minimum AIC = 39,573.12). The HR of SLE were statistical significant and positive
at exposure to PM2.5between 18 and 46μg/m3, while became
non-significant at PM2.5above 47μg/m3. Overall, we did not observe clear
exposure-response relationships of SLE with NO2and PM2.5.
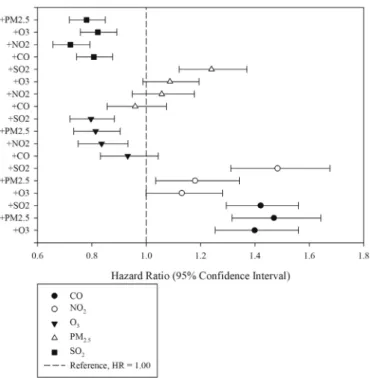
In the two pollutants model, the associations between SLE and CO remained significant positive after controlling for O3, PM2.5, and SO2
(adjusted HR = 1.40, 95% CI: 1.25–1.56 for exposure to CO with O3;
ad-justed HR = 1.47, 95% CI: 1.32–1.64 for exposure to CO with PM2.5; and
adjusted HR = 1.42, 95% CI: 1.30–1.56 for exposure to CO with SO2)
(Fig. 2). Similarly, there were significant positive associations between NO2and SLE after incorporating PM2.5and SO2into the same model
(ad-justed HR = 1.18, 95% CI: 1.04–1.34 for exposure to NO2with PM2.5and
adjusted HR = 1.48, 95% CI: 1.31–1.68 for exposure to NO2with SO2).
However, the associations of SLE with NO2were attenuated to null
after adjusting with O3 (adjusted HR = 1.13, 95% CI: 1.00–1.28)
(Fig. 2). Additionally, the associations of SLE with PM2.5reduced and
be-came non-significant when adjusted for CO, NO2, and O3in the same
Table 1
Descriptive statistics for basic characteristics of study population during 2001–2010. SLE cases
(n = 1292)
Total (N = 682,208)
Person-year at risk IR (95% CI)
(per 10,000 person-years) HRs (95%CI) Sex Male 182 347,108 3,405,833.97 0.53 (0.46–0.61) Reference Female 1110 335,100 3,273,000.44 3.39 (3.19–3.59) 6.34 (5.42–7.42) Age(year) b29 332 169,731 1,641,585.58 2.02 (1.80–2.24) Reference 29≤ age b 38 307 171,357 1,669,174.15 1.84 (1.63–2.04) 0.91 (0.78–1.06) 38≤ age b 48 316 170,606 1,682,280.28 1.88 (1.67–2.09) 0.93 (0.80–1.08) ≥49 337 170,514 1,685,794.40 2.00 (1.79–2.21) 0.99 (0.85–1.15) Socioeconomic status b1249 311 130,161 1,258,018.49 2.47 (2.20–2.75) Reference 1249≤ SES b 21,000 284 179,202 1,732,676.08 1.64 (1.45–1.83) 0.66 (0.56–0.78) 21,000≤ SES b 31,800 383 202,042 2,004,906.00 1.91 (1.72–2.10) 0.77 (0.67–0.90) ≥31,800 314 170,803 1,683,233.85 1.87 (1.66–2.07) 0.75 (0.65–0.88) Cerebrovascular accident No 1156 638,657 6,246,983.57 1.85 (1.74–1.96) Reference Yes 136 43,551 431,850.84 3.15 (2.625–3.68) 1.70 (1.43–2.03) Chromic kidney disease
No 1232 671,017 6,568,006.51 1.88 (1.77–1.98) Reference Yes 60 11,191 110,827.90 5.41 (4.04–6.78) 2.89 (2.23–3.74) Chronic obstructive pulmonary disease
No 874 559,147 5,459,139.01 1.60 (1.49–1.71) Reference Yes 418 123,061 1,219,695.40 3.43 (3.10–3.76) 2.14 (1.91–2.41) Coronary artery disease
No 1098 611,150 5,973,861.87 1.84 (1.73–1.95) Reference Yes 194 71,058 704,972.54 2.75 (2.36–3.14) 1.50 (1.27–1.74) Diabetes No 1113 600,589 5,868,752.18 1.90 (1.79–2.01) Reference Yes 179 81,619 810,082.23 2.21 (1.89–2.53) 1.17 (1.00–1.36) Hyperlipidemia No 991 555,232 5,419,016.70 1.83 (1.71–1.94) Reference Yes 301 126,976 1,259,817.71 2.39 (2.12–2.66) 1.31 (1.15–1.49) Hypertension No 920 525,859 5,127,303.45 1.79 (1.68–1.91) Reference Yes 372 156,349 1,551,530.96 2.40 (2.15–2.64) 1.34 (1.19–1.51) Inflammatory bowel disease
No 1263 668,747 6,545,199.01 1.93 (1.82–2.04) Reference Yes 29 13,461 133,635.40 2.17 (1.38–2.96) 1.13 (0.78–1.63) Schizophrenia No 1279 675,780 6,615,082.63 1.93 (1.83–2.04) Reference Yes 13 6428 63,751.78 2.04 (0.93–3.15) 1.06 (0.61–1.82) Lupus nephritis No 1250 680,871 6,665,879.30 1.88 (1.77–1.98) Reference Yes 42 1337 12,955.11 32.42 (22.61–42.22) 17.31 (12.73–23.54) Notes: CI, confidence interval; HR, hazard ratio; IR, incidence rate.
Table 2
The distribution of air pollution concentrations during 2001–2010.
Pollution (unit) Mean SD Median Min Max Q1 Q3 IQR CO (ppm) 0.59 0.14 0.58 0.28 0.99 0.48 0.68 0.20 NO2(ppb) 21.80 6.61 20.61 6.55 50.42 16.92 26.68 9.76
O3(ppb) 23.82 5.66 23.22 15.36 65.69 19.57 26.59 7.02
PM2.5(μg/m3) 34.4 7.6 34.0 7.1 84.4 29.0 39.2 10.2
SO2(ppb) 5.84 1.96 5.73 1.54 19.95 4.68 6.63 1.96
Notes: CO, carbon monoxide; IQR, interquartile range; NO2, nitrogen dioxide; O3, ozone;
PM2.5, particles with aerodynamic diameterb2.5 μm; SD, standard deviation; SO2, sulfur
dioxide.
Table 3
The Pearson correlation coefficients of yearly average air pollutants in Taiwan. Spearman correlation coefficients
CO NO2 O3 PM2.5 SO2 CO 1 0.87 −0.47 0.39 0.25 NO2 1 −0.36 0.40 0.54 O3 1 −0.08 −0.01 PM2.5 1 0.43 SO2 1
Notes: CO, carbon monoxide; NO2, nitrogen dioxide; O3, ozone; SO2, sulfur dioxide; PM2.5,
particles with aerodynamic diameterb2.5 μm. boldN 0.8.
model. Notably the associations with PM2.5remained significantly
pos-itive when adjusted for SO2(adjusted HR = 1.24, 95% CI: 1.12–1.37).
There were consistently negative associations of SLE with exposure to O3and SO2after adjusted for the second pollutant (Fig. 2). Overall, the
associations of SLE with air pollutants did not change substantially after adjusting for the second pollutant (Fig. 2). For sensitivity analyses, we did notfind the effect modification of lupus nephritis in the
associa-tions between air pollutants and SLE (p for interaction N 0.05)
(Table S1). 4. Discussion
In this study, we applied the 1-km resolution LUR and an advanced satellite-based estimation model to estimate concentrations of air pol-lutants in Taiwan. We used the mixed effect Cox models with time-dependent variables to evaluate the associations between SLE and air pollutants. According to the results of single pollutant models, we
Table 4
Hazard ratios and 95% confidence intervals (CIs) for newly diagnosed systemic lupus ery-thematosus (SLE) during 2001–2010.
Crude HRs (95% CI) Adjusted HRs (95% CI)a
CO (0.20 ppm) 1.46 (1.33–1.61) 1.44 (1.31–1.59) NO2(9.76 ppb) 1.24 (1.10–1.39) 1.21 (1.08–1.36)
O3(7.02 ppb) 0.79 (0.71–0.87) 0.80 (0.73–0.89)
PM2.5(10.2μg/m3) 1.12 (1.02–1.23) 1.12 (1.02–1.23)
SO2(1.96 ppb) 0.82 (0.76–0.89) 0.83 (0.76–0.90)
CO, carbon monoxide; NO2, nitrogen dioxide; O3, ozone; PM2.5, particulate matter with
aerodynamic diameterb2.5 μm; and SO2, sulfur dioxide.
aAdjusted HRs were adjusted for age, sex, socioeconomic status, cerebrovascular
ease, chronic kidney disease, chronic obstructive pulmonary disease, coronary artery dis-ease, hyperlipidemia, and hypertension.
Fig. 1. Exposure-response relationships of carbon monoxide (CO; A), nitrogen dioxide (NO2; B), and particulate matter with an aerodynamic diameterb2.5 μm (PM2.5; C) with systemic
lupus erythematosus (SLE). The results were represented as hazard ratio with 95% confidence interval. The distribution lag non-linear models were adjusted for age, sex, socioeconomic status, cerebrovascular disease, chronic kidney disease, chronic obstructive pulmonary disease, coronary artery disease, hyperlipidemia, and hypertension.
Fig. 2. The associations between air pollutants and systemic lupus erythematous (SLE) from two-pollutant model represented as hazard ratio with a 95% confidence interval. All models were adjusted for age, sex, socioeconomic status, cerebrovascular disease, chronic kidney disease, chronic obstructive pulmonary disease, coronary artery disease, hyperlipidemia, and hypertension. Carbon monoxide (CO; black circle); nitrogen dioxide (NO2; hollow circle); ozone (O3; black inverted triangle); particulate matter with
aerodynamic diameterb2.5 μm (PM2.5; hollow triangle); sulfur dioxide (SO2; black
found that exposure to increased traffic-related air gaseous pollutants (CO and NO2) and PM2.5might be associated with the increased risk of
SLE (Table 4). In contrast, exposure to increased O3and SO2were
nega-tively associated with the increased risk of SLE. The associations of SLE with exposures to CO remained stable after considering with the second pollutant, while the associations of SLE with exposure to NO2were
at-tenuated to null after adjusting with O3. Additionally, the associations
with PM2.5were reduced to null after controlling for CO, NO2, and O3,
but remained significantly positive when adjusted for SO2. According
to the National Ambient Air Quality Standards (NAAQS) from US EPA, there is currently only standards for regulating 1-h and 8-h CO concen-trations, while no standard for regulating annual mean CO (US EPA, 2018). We found that long-term exposure to CO above 0.6 ppm were as-sociated with SLE by the exposure-response relationships of CO.
Addi-tionally, the NAAQS standards for annual mean NO2is 53 ppb (US
EPA, 2018), we observed that even NO2concentrations less than current
NAAQS standards (between 28 and 38 ppb) might still associate with SLE.
The biological mechanisms of the relationship between air pollution and SLE are still unclear. Several hypotheses have been postulated that air pollution may contribute to autoimmune diseases via oxidative stress, nitrosative stress, and systemic inflammation (Gawda et al., 2017;Ritz, 2010). Traffic-related air pollutants may cause oxidative
stress and systemic inflammation (Laumbach and Kipen, 2010). The
combination of CO with hemoglobin (Hb) to form carboxyhemoglobin (COHb) reduces the oxygen carrying capacity of the blood and causes tissue hypoxia (WHO, 2000). Hypoxia deprives usual supply of oxygen, and damage cells of the heart, muscle, brain and nervous system (Prockop and Chichkova, 2007;WHO, 2000). Moreover, chronic expo-sure to CO may induce oxidative stress by decreasing the activity of the antioxidant enzymes superoxide dismutase, catalase, and glutathi-one peroxidase and increasing the end-product of lipid peroxidation by reactive oxygen species (ROS) (Reboul et al., 2012). An in vitro study used normal human bronchial epithelial cells as model showing
that exposure to NO2induced pro-inflammatory responses, and
in-creased the generation of nitrate and interleukin (IL)-8 (Ayyagari et al., 2004). In human exposure chamber studies, exposure to NO2for
four hours might induce neutrophilic inflammation in the bronchi of healthy humans (Blomberg et al., 1997). Repeated exposure of healthy human airways to 2 ppm NO2could trigger an upregulation of T helper
(Th2) cytokines including IL-5, IL-10, IL-13 and intercellular adhesion molecule (ICAM)-1 in the bronchial epithelium (Pathmanathan et al., 2003). Higher cytokines expression (e.g., IL-6, IL-10) were observed in SLE patients, which may play an important role on pathogenesis of SLE (Blair et al., 2010;Gualtierotti et al., 2010). Furthermore, PM may in-duce oxidative stress via the adsorbed heavy metal on its surface, or PM may trigger the release reactive oxygen species (ROS) after phagocyto-sis by macrophage and lead to increase in oxidative stress ( Mazzoli-Rocha et al., 2010). From the animal study, exposure to traffic-related PM pollutant enhanced the expression of inducible nitric oxide synthase (iNOS) (Bai et al., 2011). The overexpressed activity of iNOS may lead to exacerbated tissue damage in SLE (Oates and Gilkeson, 2006).
Getting clues from epidemiological studies that assessed the associ-ations between air pollution and autoimmune rheumatic diseases. Hart and colleagues conducted a perspective cohort study in the U.S.finding that women living within 50 m of a major road had a 31% increased HR of rheumatoid arthritis (RA), while they did not examine associations of RA with specific air pollutants (Hart et al., 2009). Moreover, the same group performed case-control study in Sweden to examine the associa-tions of RA with long-term exposure to air pollution, namely NO2, PM10,
and SO2in the preceding 5 to 20 years before RA diagnosis. They found
significant associations of RA with exposure to NO2in the preceding 5
and 10 years before RA diagnosis (OR = 1.19, 95% CI: 1.01–1.40 and OR = 1.22, 95% CI: 1.07–1.40, respectively) in anti-citrullinated protein antibody (ACPA)-negative phenotype group (Hart et al., 2013). In Taiwan, we have conducted a cohort study with more 0.3 million subjects
and found that exposure to traffic-related air pollutants were signifi-cantly positively associated with RA diagnosis (adjusted HR = 1.17, 95% CI: 1.16–1.18 for a 100 ppb increase in CO and adjusted HR = 1.54, 95% CI: 1.45–1.64 for a 10 ppb increase in NO2) (Jung et al., 2017b).
We observed consistent negative associations between O3and SLE
(Table 4andFig. 2). In addition, it should be noted that the association between NO2and SLE were attenuated to null when controlling for O3.
The inverse relationship between the associations of health outcomes with NO2and O3was well-recognized in previous epidemiological
stud-ies that evaluated the effects of long-term NO2and O3(Atkinson et al.,
2013, 2015;Coogan et al., 2017;Lee et al., 2016). This could be partially explained by inverse associations of O3with other pollutants (r =₋0.47
for CO, r =₋0.36 for NO2, and r =₋0.08 for PM2.5). Based on our LUR
model, the O3concentrations were negatively correlated with the axis
corresponding to traffic-related area (PC1) and positively correlated with the axis corresponding to forest area (PC3) (Table S4). In contrast to O3, the NO2concentrations were highly positively associated with the
axis corresponding to traffic-related area (PC1) (Table S4). The spatial distribution of O3estimates from LUR model represented a distinct
re-gional pattern comparing with NO2estimates (Fig. S2). This differences
in regional pattern is likely to explain the observed inverse relationship between NO2and O3. Furthermore, we could not rule out the possibility
of measurement error form our LUR model for O3, because
leave-one-out cross validation (LOOCV) results showed that the performance of
LUR for O3is not good enough (LOOCV R2= 0.35 with a root mean
squared error (RMSE) of 3.53 ppb). The LUR may not adequately predict the spatial pattern of O3, which is likely to result in the negative
associ-ation between O3and SLE. Moreover, we also found negative
associa-tions between SO2and SLE (Table 4andFig. 2). A large proportion of
sulfur oxides (SOx) in Taiwan was emitted from coal-fired power
plant, steel mill, and chemical materials manufacturing industry (36.43%, 11.82%, and 10.82%, respectively), but only a few from other types of industrial facilities, such as cement plant, textile industry, food manufacturing industry (TEPA, 2019). However, we could not dis-criminate the types of industrial facilities by using the land use variable, the areas of all types of industrial facilities were categorized to the same variable, the industrial area, in the LUR model. This may introduce the potential measurement error in this study. Although the performance of LUR for SO2is higher than the performance of inverse distance
weighting (IDW) for SO2(CV R2= 0.49 with a RMSE of 1.48 ppb for
LUR and CV R2= for 0.35 with a RMSE of 2.41 ppb for IDW) (Jung
et al., 2017a). Still, the performance of LUR model for SO2is not good
enough as the performance for CO and NO2in Taiwan. Overall, our
re-sults related to the association of SLE with O3and SO2 should be
interpreted cautiously. The future study could seek for alternative models for these two pollutants.
This study has several strengths. Firstly, we use a large population-based prospective cohort to assess the relationships between air pollu-tion and incident SLE. This study has strong generalizability and statisti-cal power, and temporal issue could be eliminated. Secondly, LUR and satellite-based estimation model with higher spatial resolution were used to perform exposure assessment, which can take into accounts po-tential impacts offiner spatial variability of air pollutants. According to the cross validation results, the performances of LUR model for CO and NO2, and satellite-based model for PM2.5are high (cross validation
R2= 0.60, 0.72, and 0.78 for CO, NO
2, and PM2.5, respectively, please
refer to supplementary material Table S3). Our exposure assessment approaches can reduce misclassification bias and overestimation of ex-posure. Thirdly, mixed effect Cox models incorporated time-dependent variables were conducted to evaluate the associations of SLE with expo-sure to air pollution. This method considered the change of air pollutant concentrations over time, which allowed us to eliminate the potential bias (Kleinbaum and Klein, 2012).
There are also limitations should be noted. First, since some impor-tant confounders are unavailable from LHID2000 such as family history of SLE, genetic factors, personal behavior or habitat, and occupational
exposure (e.g., silica or solvents), we cannot rule out the possibilities that these confounders may influence our results. Second, we could not exclude the possible misclassification of SLE cases due to diagnosis by physicians. The errors in SLE classification are assumed to be non-differential in lower and higher exposure group. Nevertheless, our na-tionwide population from NHIRD have sufficient numbers of subjects, which could reduce the uncertainty due to random error that is typically presented in smaller sample size studies. Third, the follow-up time for each individual was set-up as censored at the year when insurance is terminated. This may result in misclassification for employees who change their jobs or end their employment. The National Health Insur-ance (NHI) in Taiwan is a single-payer compulsory and universal insur-ance program, and it covered nearly 99% of all residents by 2010 (Wu et al., 2010). Unemployed persons can still participate in the NHI under the district office, and the percentage of premium paid is rela-tively low. Although we could not rule out potential misclassification for these kinds of people, we think this kind of misclassification may not be an issue in the dataset.
5. Conclusions
In conclusion, our study evaluated the relations between exposure to air pollution and newly diagnosed SLE by applying LUR and an ad-vanced satellite-based estimation model. We provide evidence that am-bient air pollution may play an important role of SLE, thefindings suggest that long-term exposure to CO and NO2concentrations less
than existed NAAQS, and PM2.5are associated with an increased risk
of SLE. Further research is needed to confirm these findings and evaluate potential biological mechanisms.
Acknowledgment
The work was supported by China Medical University (CMU107-Z-04), Taichung, TAIWAN, and Ministry of Science and Technology (MOST 104-2119-M-039-002, MOST 105-2119-M-039-002 and MOST 106-2119-M-039-001), Taipei, TAIWAN. We thank the Taiwan Environ-mental Protection Agency (EPA) for providing air pollutant monitoring data and the National Health Insurance Administration for accessing to the data of National Insurance Research Database. We thank the National Science and Technology Center for Disaster Reduction and the Taiwan Climate Change Projection Information and Adaptation
Knowledge Platform Project Office for providing daily temperature
and precipitation data. The Terra and Aqua MODIS Collection 6 Level-2 Aerosol Products were acquired from the Level-1 & Atmosphere Archive and Distribution System (LAADS) Distributed Active Archive Center (DAAC), located in the Goddard Space Flight Center in Greenbelt, Mary-land (https://ladsweb.nascom.nasa.gov/).
Appendix A. Supplementary data
Supplementary data to this article can be found online athttps://doi. org/10.1016/j.scitotenv.2019.03.018.
References
Almaani, S., Meara, A., Rovin, B.H., 2017.Update on lupus nephritis. Clin. J. Soc. Nephrol. 12, 825–835.
Atkinson, R.W., Carey, I.M., Kent, A.J., van Staa, T.P., Anderson, H.R., Cook, D.G., 2013. Long-term exposure to outdoor air pollution and incidence of cardiovascular diseases. Ep-idemiology 24, 44–53.
Atkinson, R.W., Carey, I.M., Kent, A.J., van Staa, T.P., Anderson, H.R., Cook, D.G., 2015. Long-term exposure to outdoor air pollution and the incidence of chronic obstructive pul-monary disease in a national English cohort. Occup. Environ. Med. 72, 42–48.
Ayyagari, V.N., Januszkiewicz, A., Nath, J., 2004.Pro-inflammatory responses of human bronchial epithelial cells to acute nitrogen dioxide exposure. Toxicology 197, 149–164.
Bai, N., Kido, T., Kavanagh, T.J., Kaufman, J.D., Rosenfeld, M.E., van Breemen, C., et al., 2011.
Exposure to diesel exhaust up-regulates iNOS expression in ApoE knockout mice. Toxicol. Appl. Pharmacol. 255, 184–192.
Barbhaiya, M., Costenbader, K.H., 2016.Environmental exposures and the development of systemic lupus erythematosus. Curr. Opin. Rheumatol. 28, 497–505.
Beelen, R., Hoek, G., Vienneau, D., Eeftens, M., Dimakopoulou, K., Pedeli, X., et al., 2013. De-velopment of NO2and NOxland use regression models for estimating air pollution
exposure in 36 study areas in Europe–the ESCAPE project. Atmos. Environ. 72, 10–23.
Bernatsky, S., Fournier, M., Pineau, C.A., Clarke, A.E., Vinet, E., Smargiassi, A., 2011. Associ-ations between ambientfine particulate levels and disease activity in patients with systemic lupus erythematosus (SLE). Environ. Health Perspect. 119, 45–49.
Bernatsky, S., Smargiassi, A., Johnson, M., Kaplan, G.G., Barnabe, C., Svenson, L., et al., 2015.
Fine particulate air pollution, nitrogen dioxide, and systemic autoimmune rheumatic disease in Calgary, Alberta. Environ. Res 140, 474–478.
Bernatsky, S., Smargiassi, A., Barnabe, C., Svenson, L.W., Brand, A., Martin, R.V., et al., 2016.
Fine particulate air pollution and systemic autoimmune rheumatic disease in two Ca-nadian provinces. Environ. Res. 46, 85–91.
Blair, P.A., Noreña, L.Y., Flores-Borja, F., Rawlings, D.J., Isenberg, D.A., Ehrenstein, M.R., et al., 2010.CD19+
CD24hi
CD38hi
B cells exhibit regulatory capacity in healthy individ-uals but are functionally impaired in systemic lupus erythematosus patients. Immu-nity 32, 129–140.
Blomberg, A., Krishna, M.T., Bocchino, V., Biscione, G.L., Shute, J.K., Kelly, F.J., et al., 1997.
The inflammatory effects of 2 ppm NO2on the airways of healthy subjects. Am.
J. Respir. Crit. Care Med. 156, 418–424.
Chan, P.C., Yu, C.H., Yeh, K.W., Horng, J.T., Huang, J.L., 2016.Comorbidities of pediatric sys-temic lupus erythematosus: a 6-year nationwide population-based study. J. Microbiol. Immunol. Infect. 49, 257–263.
Coogan, P.F., White, L.F., Yu, J., Brook, R.D., Burnett, R.T., Marshall, J.D., et al., 2017. Long-term exposure to NO2and ozone and hypertension incidence in the black women's
health study. Am. J. Hypertens. 30, 367–372.
Fernandes, E.C., Silva, C.A., Braga, A.L., Sallum, A.M., Campos, L.M., Farhat, S.C., 2015. Expo-sure to air pollutants and disease activity in juvenile-onset systemic lupus erythema-tosus patients. Arthritis Care Res. 67, 1609–1614.
Gawda, A., Majka, G., Nowak, B., Marcinkiewicz, J., 2017.Air pollution, oxidative stress, and exacerbation of autoimmune diseases. Cent. Eur. J. Immunol. 42, 305–312.
Goldblatt, F., O'Neill, S.G., 2013.Clinical aspects of autoimmune rheumatic diseases. Lan-cet 382, 797–808.
Gualtierotti, R., Biggioggero, M., Penatti, A.E., Meroni, P.L., 2010.Updating on the patho-genesis of systemic lupus erythematosus. Autoimmun. Rev. 10, 3–7.
Hart, J.E., Laden, F., Puett, R.C., Costenbader, K.H., Karlson, E.W., 2009.Exposure to traffic pollution and increased risk of rheumatoid arthritis. Environ. Health Perspect. 117, 1065–1069.
Hart, J.E., Källberg, H., Laden, F., Bellander, T., Costenbader, K.H., Holmqvist, M., et al., 2013.
Ambient air pollution exposures and risk of rheumatoid arthritis: results from the Swedish EIRA case-control study. Ann. Rheum. Dis. 72, 888–894.
HEI (Health Effects Institute), 2010.Traffic-Related Air Pollution: A Critical Review of the Literature on Emissions, Exposure, and Health Effects. HEI Special Report. Health Ef-fects Institute, Boston, p. 17.
Jerrett, M., Arain, A., Kanaroglou, P., Beckerman, B., Potoglou, D., Sahsuvaroglu, T., et al., 2005.A review and evaluation of intraurban air pollution exposure models. J. Expo. Anal. Environ. Epidemiol. 15, 185–204.
Jung, C.R., Chen, W.T., Lin, Y.T., Hwang, B.F., 2017a.Ambient air pollutant exposures and hospitalization for Kawasaki disease in Taiwan: a case-crossover study (2000 −2010). Environ. Health Perspect. 125, 670–676.
Jung, C.R., Hsieh, H.Y., Hwang, B.F., 2017b.Air pollution as a potential determinant of rheumatoid arthritis: a population-based cohort study in Taiwan. Epidemiology 28 (Suppl. 1), S54–S59.
Jung, C.R., Hwang, B.F., Chen, W.T., 2018.Incorporating long-term satellite-based aerosol optical depth, localized land use data, and meteorological variables to estimate ground-level PM2.5concentrations in Taiwan from 2005 to 2015. Environ. Pollut.
237, 1000–1010.
Katsanos, K.H., Voulgari, P.V., Tsianos, E.V., 2012.Inflammatory bowel disease and lupus: a systematic review of the literature. J. Crohns Colitis 6, 735–742.
Kleinbaum, D.G., Klein, M., 2012.Survival Analysis: A Self-Learning Text. 3rd ed. Springer, New York.
Kono, D.H., Theofilopoulos, A.N., 2013.Autoimmunity. In: Firestein, G.S., Budd, R.C., Gabriel, S.E., McInnes, I.B., O'Dell, J.R. (Eds.), Kelly's Textbook of Rheumatology, Ninth edition Elsevier Inc., Philadelphia, pp. 281–298.
Laumbach, R.J., Kipen, H.M., 2010.Acute effects of motor vehicle traffic-related air pollu-tion exposures on measures of oxidative stress in human airways. Ann. N. Y. Acad. Sci. 1203, 107–112.
Lee, J.H., Wu, C.F., Hoek, G., de Hoogh, K., Beelen, R., Brunekreef, B., et al., 2015.LUR models for particulate matters in the Taipei metropolis with high densities of roads and strong activ-ities of industry, commerce and construction. Sci. Total Environ. 514, 178–184.
Lee, P.C., Liu, L.L., Sun, Y., Chen, Y.A., Liu, C.C., Li, C.Y., et al., 2016.Traffic-related air pollu-tion increased the risk of Parkinson's disease in Taiwan: a napollu-tionwide study. Environ. Int. 96, 75–81.
Lin, H.C., Chen, Y.H., Lee, H.C., Lin, H.C., 2010.Increased risk of acute myocardial infarction after acute episode of schizophrenia: 6 year follow-up study. Aust. N. ZJ. Psychiatry 44, 273–279.
Mazzoli-Rocha, F., Fernandes, S., Einicker-Lamas, M., Zin, W.A., 2010.Roles of oxidative stress in signaling and inflammation induced by particulate matter. Cell Biol. Toxicol. 26, 481–498.
NHRI (National Health Research Institute), 2018. Data subsets: LHID2000.https://nhird. nhri.org.tw/en/Data_Subsets.html(accessed 15 June 2018).
Oates, J.C., Gilkeson, G.S., 2006.The biology of nitric oxide and other reactive intermedi-ates in systemic lupus erythematosus. Clin. Immunol. 121, 243–250.
Pathmanathan, S., Krishna, M.T., Blomberg, A., Helleday, R., Kelly, F.J., Sandström, T., et al., 2003.Repeated daily exposure to 2 ppm nitrogen dioxide upregulates the expression
of IL-5, IL-10, IL-13, and ICAM-1 in the bronchial epithelium of healthy human air-ways. Occup. Environ. 60, 892–896.
Pons-Estel, G.J., Alarcón, G.S., Scofield, L., Reinlib, L., Cooper, G.S., 2010.Understanding the epidemiology and progression of systemic lupus erythematosus. Semin. Arthritis Rheum. 39, 257–268.
Prockop, L.D., Chichkova, R.I., 2007.Carbon monoxide intoxication: an updated review. J. Neurol. Sci. 262, 122–130.
Reboul, C., Thireau, J., Meyer, G., André, L., Obert, P., Cazorla, O., et al., 2012.Carbon mon-oxide exposure in the urban environment: an insidious foe for the heart? Respir. Physiol. Neurobiol. 184, 204–212.
Ritz, S.A., 2010.Air pollution as a potential contributor to the 'epidemic' of autoimmune disease. Med. Hypotheses 74, 110–117.
Shen, T.C., Tu, C.Y., Lin, C.L., Wei, C.C., Li, Y.F., 2014.Increased risk of asthma in patients with systemic lupus erythematosus. Am. J. Respir. Crit. Care Med. 189, 496–499.
Sun, G., Hazlewood, G., Bernatsky, S., Kaplan, G.G., Eksteen, B., Barnabe, C., 2016. Associa-tion between air polluAssocia-tion and the development of rheumatic disease: a systematic review. Int. J. Rheumatol. 2016, 5356307.
TEPA (Taiwan Environmental Protection Administration), 2019. Taiwan Emission Data System 9.0, TEDS 9.0 (In Chinese). Available:https://teds.epa.gov.tw/Default.asp
(accessed 17 February 2019).
Therneau, T., 2018. Mixed effects Cox models.https://cran.r-project.org/web/packages/ coxme/vignettes/coxme.pdf(accessed 22 October 2018).
Tiosano, S., Farhi, A., Watad, A., Grysman, N., Stryjer, R., Amital, H., et al., 2017. Schizophre-nia among patients with systemic lupus erythematosus: population-based cross-sectional study. Epidemiol. Psychiatr. Sci. 26, 424–429.
Törnqvist, H., Mills, N.L., Gonzalez, M., Miller, M.R., Robinson, S.D., Megson, I.L., et al., 2007.
Persistent endothelial dysfunction in humans after diesel exhaust inhalation. Am. J. Respir. Crit. Care Med. 176, 395–400.
US EPA (United States Environmental Protection Agency), 2018. NAAQS Table.https:// www.epa.gov/criteria-air-pollutants/naaqs-table(accessed 24 October 2018). Wahren-Herlenius, M., Dorner, T., 2013.Immunopathogenic mechanisms of systemic
au-toimmune disease. Lancet 382, 819–831.
Wang, L.Y., Chiang, J.H., Chen, S.F., Shen, Y.C., 2018.Systemic autoimmune diseases are as-sociated with an increased risk of bipolar disorder: a nationwide population-based cohort study. J. Affect. Disord. 227, 31–37.
WHO (World Health Organization), 2000. WHO air quality guidelines for Europe, 2nd edi-tion, 2000 (CD ROM version). http://www.euro.who.int/en/health-topics/environ- ment-and-health/air-quality/publications/pre2009/who-air-quality-guidelines-for-europe,-2nd-edition,-2000-cd-rom-version (accessed 18 February, 2019). Wu, T.Y., Majeed, A., Kuo, K.N., 2010.An overview of the healthcare system in Taiwan.
London J. Prim. Care. (Abingdon) 3, 115–119.
Wu, C.D., Chen, Y.C., Pan, W.C., Zeng, Y.T., Chen, M.J., Guo, Y.L., et al., 2017.Land-use re-gression with long-term satellite-based greenness index and culture-specific sources to model PM2.5spatial-temporal variability. Environ. Pollut. 224, 148–157.