國
立
交
通
大
學
應用化學系分子科學碩士班
碩
士
論
文
激發態氧原子與一氧化碳同位素交換反應之動
態學研究
The dynamics of O(
1
D) +CO isotope
exchange reaction
研 究 生:黃家彬
指導教授:林志民 教授
激發態氧原子與一氧化碳同位素交換反應之動態學研究
The dynamics of O(
1
D) +CO isotope
exchange reaction
研 究 生:黃家彬 Student:Chia-Pin Huang
指導教授:林志民 Advisor:Jim Jr-Min Lin
國 立 交 通 大 學
應 用 化 學 系 分子科學碩士班
碩 士 論 文
A Thesis
Submitted to M. S. Program in Molecular Science Department of Applied Chemistry
National Chiao Tung University in partial Fulfillment of the Requirements
for the Degree of Master in
M. S. Program in Molecular Science Department of Applied Chemistry
July 2013
Hsinchu, Taiwan, Republic of China
i
摘要
本篇論文利用交叉分子束的方式,來研究激發態氧原子與一氧化碳同位素交 換的反應動態學,其觀察的碰撞能量為 5.56 千卡每莫耳。實驗的結果觀察到兩 個反應途徑:一個是由激發態氧原子放熱到基態氧原子的過程;另外一個則是保 持在激發態氧原子,但能量由動能轉換成振動能量或轉動能量。實驗的結果發現, 兩個反應途徑中,以保持在激發態氧原子的途徑為主,占了全部反應的百分之六 十六;同時,實驗結果也發現產物的角分佈是呈現不對稱的形狀,這樣的角分佈 形狀透露出反應會形成中間產物,而它的半生期跟它的轉動週期比起來相對較短, 才會產生不對稱的角分佈。另一個反應則相反,激發態氧原子藉由放熱到基態氧 原子的過程,為副反應占全部反應的百分之三十四,其結果顯示出產物的角分佈 是對稱的,其對稱的角分佈形狀透露出,反應所形成的中間產物它的半生期與它 的旋轉週期比起來相對較長,才會產生對稱的角分佈,我們稱這樣的中間產物為 長壽的中間產物。ii
Abstract
The dynamics of the 18O(1D) + 28CO oxygen isotope exchange reaction has been studied using a crossed molecular beam apparatus at a collision energy of 5.56 kcal/mol. Two reaction channels are observed: isotope exchange in which quenching to O(3P) occurs and isotope exchange in which the product oxygen atom remains on the singlet surface. Non-quenching channel is the major channel with asymmetry angular distribution under this collision energy, accounting for 66% of all isotope exchange. The other channel occurs quenching which angular distribution is symmetric accounts for 34%. The electronic quenching proceeds via a CO2* complex that is long-lived with respect to its rotational period; however,
non-quenching channel proceeds via CO2* complex with the lifetime is shorter than
its rotational period. The new molecular-level details may help provide a more quantitative understanding of the heavy isotope enrichment in CO observed in the stratosphere.
iii
謝辭
能夠順利完成這一篇論文,我要感謝很多人給我的鼓勵、協助與包容。首先 要感謝我的指導教授林志民老師,讓我能夠來中研院原分所完成我的碩士學位; 要感謝林志民老師時常與我們討論實驗的進度,並提供十分寶貴的意見,讓整個 研究可以更順利;要特別感謝志民老師在這兩年來對我耐心的指導,從老師您身 上學習到不只是做實驗的技巧而已,更重要的是您處理事情要求精確的態度,是 我這兩年研究生活中很重要的學習。同時,也要感謝倪其焜老師與曾建銘老師擔 任我的口試委員,讓我的論文更加完善。感謝與我一起做實驗的學長姐;首先是 金兵學長,您總是二話不說的鼎力相助,真的很感謝您的協助;再來是曼儂學姐, 謝謝您在我有疑惑的時候,解決了我的問題,真的很謝謝您的幫助。做實驗的過 程雖然辛苦,但有你們的協助及鼓勵,讓我可以順利的完成實驗;感謝冠儀這兩 年來的陪伴,真的很感謝。謝謝你們這兩年來的鼓勵與照顧。最後,要感謝我的 父母親,謝謝你們讓我可以無後顧的在台北求學,同時也鼓勵我,謝謝你們。iv
Content
摘要 ... i
Abstract ... ii
謝辭 ... iii
Content ... iv
Figures captions ... vi
Ⅰ. Introduction ... 1
Ⅱ. Experimental Section ... 4
III.
Results ... 7
V.
Discussion ... 12
VI.
Summary ... 14
Appendix ... 16
v
vi
Figures captions
Figure 1. Schematic of the universal detector crossed molecular beam apparatus ... 4 Figure 2. Schematic of the rotatable Q2 source used to reach the collision energies to
5.56 kcal/mol... 5 Figure 3. Time-of-flight (TOF) spectra at mass 30 (C18O) at collision energy of 5.56 kcal/mol for different laboratory angles. The open circles are experimental data; solid lines are the simulated results. (Blue lines are for quenching; red lines are for non-quenching) ... 7 Figure 4. Newton diagram showing the 30CO products for the 18O + CO crossed beam experiment... 8 Figure 5. Product kinetic energy distribution, P(E), of (a) quenching and (b) non-quenching channels which best simulate the TOF experimental data at a collision energy of 5.56 kcal/mol in Figure 3. ... 9 Figure 6. Product angular distributions, P(θ), of (a) quenching and (b) non-quenching channels which best simulate the TOF experimental data at a collision energy of ... 10 Figure 7. Time-of-flight spectra at mass 30 (C18O) at collision energy of 8.2 kcal/mol for ten laboratory angles. The open circles represent the experimental data; solid lines are the simulated results. (Blue lines are for quenching, red lines are for non-quenching.) ... 12 Figure 8. Product kinetic energy distribution, P(E), of (a) non-quenching and (b) quenching channels which best simulate the TOF experimental data at a collision energy of 8.2 kcal/mol in Figure 7. ... 13 Figure 9. Product angular distributions, P(θ), of (a) non-quenching and (b) quenching
vii
channels which best simulate the TOF experimental data at a collision energy of 8.2 kcal/mol in Figure 7. ... 13
1
Ⅰ. Introduction
The interaction of electronically excited oxygen atoms with small molecules such as carbon monoxide (CO) has attracted considerable experimental and theoretical investigations because of its importance in atmospheric environments.1,2 An extensive theoretical and laboratory investigations on the kinetics and energy transfer of O(1D) to CO have been carried out using different detection techniques.3-9 O(1D) + CO O(3P) + CO H = -45.4 kcal/mol (1) Electronic deactivation of O(1D) by CO despite a spin-forbidden process, is not totally inefficient because of the probability of surface change from singlet O(1D)-CO to triplet exit surface O(3P)-CO interaction.10,11 The total quenching rate coefficient is found to be near gas kinetic limit12-14 with values around 4.0x10⁻¹¹ cm3 -1s-1 at 300K with (4.70.9)x10-11exp(63/T) for the temperature dependence from 113-333K by Davidson et. al.15 In the quenching studies by Lin and Shortridge,6,7 the collisionally produced CO (ν=0-7) were probed by infrared absorption methods through a cell following flash photolysis of O3/CO mixture.
Isotope labeling experiments reveal that the product C16O or C18O from 16O(1D) + C18O reaction are formed with equal statistical probability. These experimental results coupled with simple statistical model calculations showed that the quenching reaction takes place via a long-lived CO2 complex before it dissociates to O(3P) and CO. The
efficiency of electronic-vibrational (E-V) energy transfer was measured to be 21 0.5%, a factor of 2 lower than previous reported by Slanger and Black.9 Harding et. al.5 reinvestigated the quenching reaction using O3, N2O, or NO2 as the O(1D) source
with time resolved diode laser absorption spectroscopy as the product probe. They reported the E-V energy transfer efficiency to be 25%. Chen and Lee4 also studied the
2
O(1D) + CO reaction using time-resolved Fourier transform spectroscopy to measure the rotational and vibrational distributions of the nascent CO product upon irradiation of a flowing O3/CO mixture. The rotational CO distribution was found to be bimodal
with temperatures ~ 800 and ~ 500K whose proportion varies with each vibrational level. The efficiency of the E-V energy transfer was determined to be 21
Of the many studies involving the quenching efficiency in the reaction of O(1D) with CO, only Abe and coworkers3 reported two energy transfer processes possible for the reaction. Using vacuum ultraviolet laser-induced fluorescence technique, they studied the product CO (ν= 0-3) and observed both electronic energy transfer and kinetic energy transfer mechanism. The electronic energy transfer process involves nonadiabatic collisions that begin on the singlet surface and end on the lowest triplet surface before dissociating to O(3P) and CO. The kinetic energy transfer pathway, on the other hand, involves adiabatic motion on the singlet surface of the CO2 system.
The electronic energy transfer efficiency to internal energy of CO was calculated to be 29%. Previous measurement of Matsumi et. al.8 with Doppler spectral analysis of the product O(3P) for R1 reported an efficiency of 31 7%.
In addition to the kinetics and dynamics studied of O + CO reactions, there exists a number of bulk photochemistry experiments on this system to trace the isotopic fractionation processes involved during the exchange of isotopically labeled O atoms with CO. One noteworthy investigation is the experiments of Bhattacharya and Thiemens.16 Their results showed a large mass-independent isotopic fractionation in the CO2 product from the O + CO reaction. They ascribed these findings to the
exchange of oxygen atoms with CO and mass-independent recombination of O and CO. Atmospheric carbon monoxide also exhibits anomalous 17O and 18O enrichments,17,18 an unusual mechanism that is also observed in ozone and atmospheric carbon dioxide. While mass-independent fractionation in CO2 is linked to
3
ozone, the mass-independent results in CO are linked to CO + OH reaction, which is the major sink for CO.16
Even with the extensive body of work that exists on O + CO reaction, a detailed mechanistic description of product translational and angular distributions has not been touched on. Moreover, elucidating other possible pathways in addition to quenching, has not been thoroughly studied . Recent cross-beam experiments by Perri et. al.19,20 and theoretical calculations by Mebel21 on O(1D) + CO2 reaction elucidated both
quenching and non-quenching channels that proceed via a CO3* complex that is
long-lived with respect to its rotational period. In this thesis, the dynamics of O(1D) + CO collisions is investigated using crossed atomic and molecular beams. Together with mass spectrometric detection, this technique is sensitive in discriminating competing pathways for complex formation and/or direct reactions.
4
Ⅱ. Experimental Section
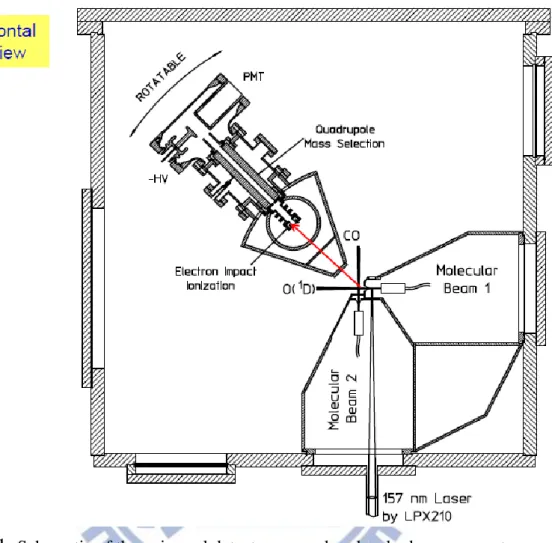
Figure 1.
Schematic of the universal detector crossed molecular beam apparatus A schematic of universal crossed-beam apparatus used in this study, which has been described in detail elsewhere,25 is shown in Figure 1. An atomic beam of 50%18
O(1D) and 50% 18O(3P) was produced by photolysis of 36O2 at 157 nm. By using
isotopically labeled 18O as the atomic beam and detecting 30CO prevented background from the reactant 28CO beam and ensure the products detected had undergone isotopic exchange reaction.
The O2 beam was produced from a tuned pulsed valve ( Even-Lavie valve) with
the pulsed width of 23 μs. The backing pressure was used 70 psia. The photolysis laser ( Lambda Physik LPX 210 F2 laser), with a power of 40 mJ per pulse at 50 Hz
5
repetition rate, was focused by a spherical-cylindrical MgF2 lens to a 3 mm x 4 mm
spot. The O(1D) speed is determined by the original velocity of O2 in the horizontal
direction and the energy released from photolysis. The mean velocity of 18O(1D) is 1900 m/s with a speed ratio of 30 (detail in calibration section) and an angular divergence of 3.55o. To reduce the O2 background in the main chamber, the rotatable
source was perpendicular to the reaction plane ( Figure 2).
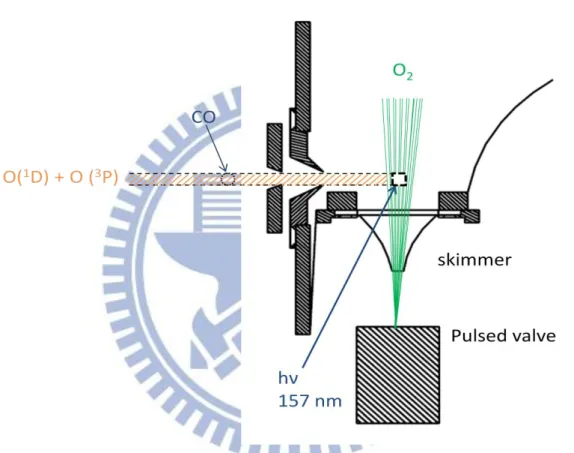
Figure 2.
Schematic of the rotatable Q2 source used to reach the collision energies to5.56 kcal/mol.
To form a molecular beam of CO, we used neat CO gas. The backing pressure was 80 psia. A tuned pulsed valve ( Even-Lavie valve) similar to that for O2 source
was used along with a 2 mm diameter skimmer. The average CO beam speed was 797m/s with the speed ratio 15 (detail in the calibration section) and an angular divergence of 1.59o. With the fixed CO speed and the rotational O(1D) source
6
vertical to the reaction plane, the collision energy was 5.56 kcal/mol.
After both beams emerge from the source chambers, they pass through a copper cold plate cooled to 26K by a closed cycle helium cryocooler. After the CO and O(1D) beams cross, the neutral products travel 242 mm to the detector where they are ionized by electron impact. Product ion coming from isotope exchange (30CO) are mass selected by a quadrupole mass filter and directed to a Daly detector. Time-of-flight spectra are then acquired by a multichannel scaler with 1μs bin size. To determine the angular distribution of this reaction, the detector is attached to the top flange of the main chamber and can be rotated from -35o to 125o, with the O(1D) beam defined as 0o. The full range of the detector was not used in the experiment owing to the high background generated close to the beam direction. The angles studied from -10o to 75o with additional angle 120o which only observed the fast channel.
To extract center-of-mass product speed and angular information as well as the branching ratio between two isotope exchange channels from the raw data, computer simulations were performed. Initial estimations for the center-of-mass product kinetic energy distribution, P(E), and the center-of-mass product angular distribution, P(θ), were input into an interactive forward-convolution computer program. Laboratory-frame time-of-flight spectra were generated on the basis of the input distributions P(E) and P(θ), molecular beam parameters and machine dimensions. The TOF spectra were compared with the experimental data, which were rebinned to 3μs to get better signal-to-noise ratio. The values of P(E) and P(θ) for each channel were then interactively adjusted to achieve a satisfactory fit to the TOF data.
7
III. Results
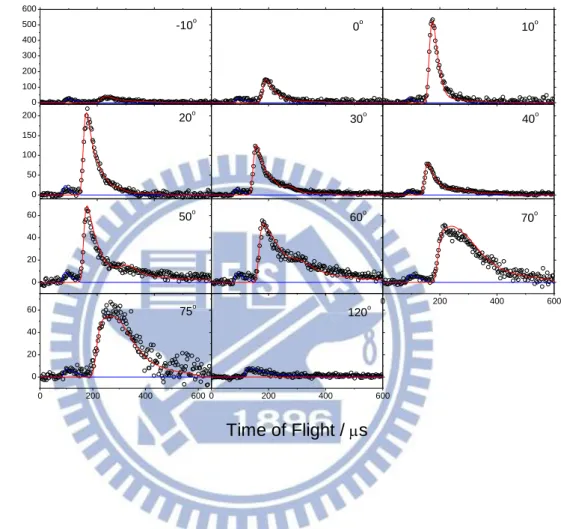
0 100 200 300 400 500 600 0 50 100 150 200 0 20 40 60 0 200 400 600 0 200 400 600 0 20 40 60 0 200 400 600 -10o 0o 10o 20o Rel at iv e In te ns ity ( Cou nt s i n 3 s) 30o 40o 50o 60o 70o 75o 120o Time of Flight / sFigure 3.
Time-of-flight (TOF) spectra at mass 30 (C18O) at collision energy of 5.56 kcal/mol for different laboratory angles. The open circles are experimental data; solid lines are the simulated results. (Blue lines are for quenching; red lines are for non-quenching)8
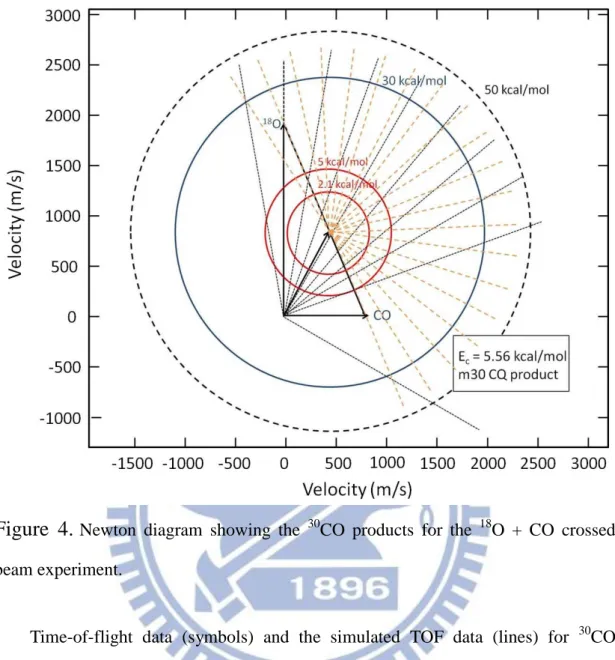
Figure 4.
Newton diagram showing the 30CO products for the 18O + CO crossed beam experiment.Time-of-flight data (symbols) and the simulated TOF data (lines) for 30CO products are shown in Figure 3 for the collision energy 5.56 kcal/mol. There are two distinct peaks, a fast peak with an average flight time of 89 s at a laboratory angle of 40o and a slower peak with an average flight time of 156 s at 40o. The backing pressure dependence of the CO beam has been checked to ensure both fast and slow peaks are from collisions of CO monomers with oxygen atoms. Besides, since the barrier for any possible isotope exchange between O(3P) and CO is predicted to be approximately 20.7 kcal/mol26, both peaks observed presumably correspond to two different channels.
9
has a maximum translational energy release equal to the collision energy. The fast channel has a maximum translational energy release much greater than the collision energy corresponding outer circle of 50 kcal/mol in Figure 4. The product translational energies for both channels are summarized in Table Ⅰ. For the fast channel, a broad P(E) was used with a maximum energy of 56.0 kcal/mol. Since the average product translational energy for the fast channel is 27.3 kcal/mol, ( Figure 5(a)) which is much greater than the collisional energy, it was assigned to the quenching reaction (1). Out of the available energy of 50.96 kcal/mol, this leaves 54% for internal excitation of the product 30CO. The slow channel, with <Et = 3.62
kcal/mol, (figure 5(b)) was also fit with a broad P(E). This channel therefore corresponds to isotope exchange without quenching reaction (2),
18O(1D) + 28CO 16O(1D) + 30CO (2)
This channel is significant, accounting for 66% of all isotope exchange. 0 10 20 30 40 50 60 0.000 0.005 0.010 0.015 0.020 0.025 0.030 0.035 0 1 2 3 4 5 6 7 0.00 0.05 0.10 0.15 0.20 0.25 0.30 0.35 (b) P(E T ) ET (kcal/mol) 0o& 180o
Quenching
(a) P(E T ) ET (kcal/mol) 0o 50o 140o 180o 90oNon-quenching
Figure 5.
Product kinetic energy distribution, P(E), of (a) quenching and (b) non-quenching channels which best simulate the TOF experimental data at a collision10
energy of 5.56 kcal/mol in Figure 3.
TABLE I. Branching ratios and product translational energies at Ec: 5.56 kcal/mol.
Reaction Branching ratio <Et finta 18
O(1D) + 28CO 16O( 3P) + 30CO 34% 27.3 kcal/mol 0.46
18
O(1D) + 28CO 16O( 1D) + 30CO 66% 3.6 kcal/mol 0.35
a
fint = Eint/(Eint+ Etrans).
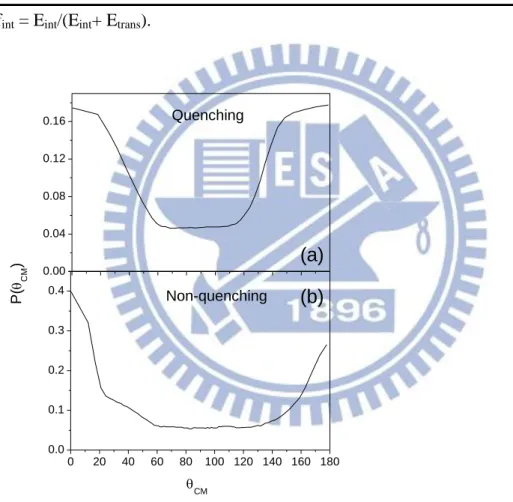
0.00 0.04 0.08 0.12 0.16 0 20 40 60 80 100 120 140 160 180 0.0 0.1 0.2 0.3 0.4 Quenching (b) P( CM ) CM Non-quenching (a)
Figure 6.
Product angular distributions, P(θ), of (a) quenching and (b)non-quenching channels which best simulate the TOF experimental data at a collision
From Figure 6(a), the quenching channel shows forward-backward symmetry which indicates that it involves an intermediate with a lifetime longer than its
11
rotational period. Comparing with quenching channel, the non-quenching one (Figure 6(b)) shows forward-backward asymmetry that means the lifetime of the intermediate is shorter than its rotational period. No evidence for a direct isotope exchange mechanism is observed for either channel.
By the conservation of momentum, we can know the momentum of reactants and the products should be the same. Initially, the momentum of reactants, O(1D) and CO, can be separated into three parts, one is the electronic angular momentum, another is the rotational momentum of CO, the other is the orbital angular momentum of reactant pair. In this work, the rotational momentum of CO can be neglected during the supersonic expansion because of the very low temperature. The electronic angular momentum, comparison with orbital angular momentum, is much smaller so that it also can be ignored. The electronic angular momentum of products is similar to the reactants, is much smaller than the orbital angular momentum of product pair. Besides, the vibrational motion of the product in non-quenching channel can be neglected because the available energy is not enough for the vibration state of CO. Therefore, the rotational momentum of CO and the orbital angular momentum of product pair are the sum for the momentum of products. For the non-quenching channel, a part of available energy (5.56 kcal/mol) is for translational energy and the left energy is for rotational motion only. For the center-of-mass angles, 0o and 180o, the probability of translational energy distribution is higher than 50o, 90o and 140o which indicates the contribution of rotational motion to 0o and 180o is smaller than 50o, 90o and 140o. Therefore, the angular distribution depends on the rotational momentum of CQ and the orbital angular momentum of product pair. For the quenching channel, the orbital momentum of reactant pair is equal to that for product pair, which results in the forward-backward symmetry.
12
V. Discussion
As we mentioned previously, the Q2 source is rotatable. Except the collision
energy at 5.56 kcal/mol, we also studied the higher collision energy at 8.2 kcal/mol. The laboratory angles we detected at 8.2 kcal/mol were almost the same as the 5.56 kcal/mol from 0o to 75o except for -10o.The data for the higher collision energy of 8.2 are shown in Figure 7. Two distinct peaks are also seen, one at 90 s at a laboratory angle of 50o and one at approximately 143 s at 50o.
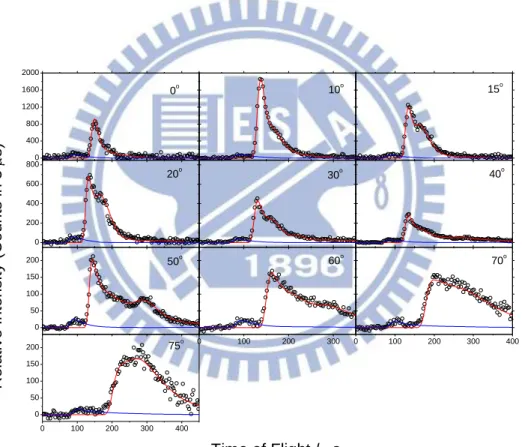
0 400 800 1200 1600 2000 0 200 400 600 800 0 50 100 150 200 0 100 200 300 0 100 200 300 400 0 100 200 300 400 0 50 100 150 200 75o 70o 60o 50o 40o 30o 0o 10o 15o 20o Rel at iv e In te ns ity ( Cou nt s i n 3 s) Time of Flight / s
Figure 7.
Time-of-flight spectra at mass 30 (C18O) at collision energy of 8.2 kcal/mol for ten laboratory angles. The open circles represent the experimental data; solid lines are the simulated results. (Blue lines are for quenching, red lines are for non-quenching.)13
The experimental data are fitted by the program to get the product kinetic energy and center-of-mass angular distribution. The results are shown in Figure 8 and 9.
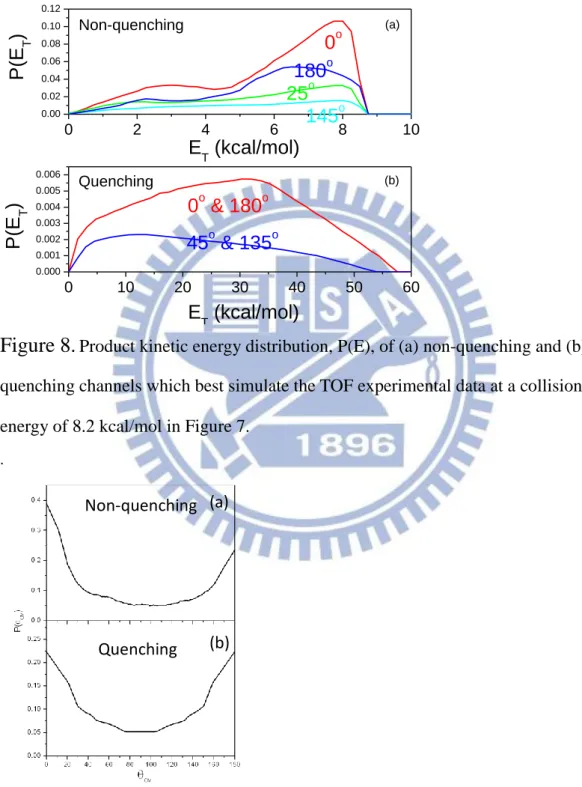
0 2 4 6 8 10 0.00 0.02 0.04 0.06 0.08 0.10 0.12 0 10 20 30 40 50 60 0.000 0.001 0.002 0.003 0.004 0.005 0.006 (a) 145o 25o 180o P (E T ) ET (kcal/mol) 0o Non-quenching (b) 45o & 135o 0o & 180o P (E T ) ET (kcal/mol) Quenching
Figure 8.
Product kinetic energy distribution, P(E), of (a) non-quenching and (b) quenching channels which best simulate the TOF experimental data at a collision energy of 8.2 kcal/mol in Figure 7..
Figure 9.
Product angular distributions, P(θ), of (a) non-quenching and (b) quenching channels which best simulate the TOF experimental data at a collisionNon-quenching
Quenching
(a)
14
energy of 8.2 kcal/mol in Figure 7.
The branching ratio of quenching and non-quenching channels is 28% : 72%. The angular distribution of quenching channel is forward-backward symmetric; however, the non-quenching channel is forward-backward asymmetric. The main difference between the results at the two collision energies is the relative intensity of the the quenching (1) and non-quenching channels (2), which we will refer to as the branching ratio. The difference in branching ratio as a function of collision energy can be clearly seen in Table Ⅱ. At 8.2 kcal/mol, the quenching channel accounts for 28% of the observed isotope exchange. At 5.56 kcal/mol, this percentage has increased to 34%, demonstrating an increased importance of the quenching channel at lower collision energies.
TABLE Ⅱ. Branching ratios and product translational energies for different Ec.
collision energy (kcal/mol) channel Branching ratio <Et afint
5.56 quenching 34% 27.3 kcal/mol 0.46 non-quenching 66% 3.6 kcal/mol 0.35 8.2 quenching 28% 27.8 kcal/mol 0.48 non-quenching 72% 5.5 kcal/mol 0.33
a
fint = Eint/(Eint+ Etrans).
VI. Summary
In summary, the dynamics of isotope exchange between O(1D) and CO has been studied using a crossed-beam apparatus at a collision energy of 5.56 kcal/mol. Two isotope exchange channels are observed. The fast channel corresponding to electronic quenching yielding O(3P) and CO products accounting for 34% of all the isotope
15
exchange, and the slow channel without electronic quenching, yielding O(1D) and CO products accounting for 67%. The symmetric angular distribution of the CO product for quenching channel indicates that the CO2* complex formed is long-lived with
respect to its rotational period. The other, the non-quenching channel, the asymmetry in the CO product angular distribution indicates the lifetime of the CO2* complex is
shorter than its rotational period. For the application in the atmosphere, it’s parallel to O(1D) + CO2 reaction.19 The branching ratio of the two channels should be estimated
at collision energies corresponding to reactions in the stratosphere, approximately 1 to 1.5 kcal/mol.27 It is expected that the branching ratio of non-quenching channel will decrease as the collision energy is lowered, because of the longer CO2* lifetime. A
longer lifetime will allow more opportunities for intersystem crossing to occur, therefore increasing the probability of quenching. If the previously ignored non-quenching channel is still significant at low collision energies, then models of the oxygen isotope anomaly may need to take this isotope exchange into account.
16
Appendix
17
18
Figure 2. The cut view of the chamber.
Figure 3. (a) The side view of the chamber. (b) The back view of the chamber.
Figure 4. The front view of the chamber.
19
Figure 5. (a) The cut view for overall inner part of the chamber. (b) The overall view of the inner part of the chamber.
Figure 6. The top view of the inner part of the chamber.
20
Figure 7. The flange for the chamber. (a) The front view of the flange. (b) The cut view of the flange.
Figure 8. The overall views of the tube on the flange.
21
Figure 9. The overall views of the flange.
22
Figure 11. The assemble of small flange (holding flange and Evan-Lavie valve flange) and quartz tube.
23
Figure 12. (a) The holding flange for quartz tube. (b) The Evan-Lavie valve flange.
24
References
(1) Wiesenfeld, J. R., Acc. Chem. Res. 1982, 15, 110-116.
(2) Harris, R. D.; Adams, G. W., Journal of Geophysical Research-Space
Physics 1983, 88, 4918-4928.
(3) Abe, M.; Inagaki, Y.; Springsteen, L. L.; Matsumi, Y.; Kawasaki, M.; Tachikawa, H., J. Phys. Chem. A 2006, 110, 12641-12645.
(4) Chen, H.-F.; Lee, Y.-P. J. Phys. Chem. A 2006, 110, 12096-12102. (5) Harding, D. R.; Weston, R. E.; Flynn, G. W., J. Chem. Phys. 1988, 88,
3590-3598.
(6) Lin, M. C.; Shortridge, R. G., Chem. Phys. Lett. 1974, 29, 42-49. (7) Shortridge, R. G.; Lin, M. C., J. Chem. Phys. 1976, 64, 4076-4085. (8) Matsumi, Y.; Inagaki, Y.; Morley, G. P.; Kawasaki, M. J., Chem. Phys.
1994, 100, 315-324.
(9) Slanger, T. G.; Black, G. J. Chem. Phys. 1974, 60, 468-477. (10) Tully, J. C. J. Chem. Phys. 1975, 62, 1893-1898.
(11) Kinnersly, S. R.; Husain, D., Mol. Phys. 1979, 38, 1067-1083.
(12) Heidner, R. F.; Husain, D., Nature Physical Science 1973, 241, 10-11. (13) Heidner, R. F.; Husain, D.; Wiesenfeld, J. R., J. Chem. Soc. Faraday
Trans. Ⅱ 1973, 69, 927-938.
(14) Young, R. A.; Black, G.; Slanger, T. G., J. Chem. Phys. 1968, 49, 4758-4768.
(15) Davison, J. A.; Schiff, H. I.; Brown, T. J.; Howard, C. J., J. Chem. Phys.
1978, 69, 1216-1217.
25
Section A-A J. Phys. Sci. 1989, 44a, 435-444.
(17) Rockmann, T.; Brenninkmeijer, C. A. M.; Neeb, P.; Crutzen, P. J.,
J. Geophys. Res.-Atmospheres 1988, 103, 1463-1470.
(18) Rockmann, T.; Brenninkmeijer, C. A. M.; Saueressig, G.; Bergamaschi, P.; Crowley, J. N.; Fisher, H.; Crutzen, P. J., Science 1998, 281, 544-546.
(19) Perri, M. J.; Van Wyngarden, A. L.; Boering, K. A.; Lin, J. J.; Lee, Y. T.,
J. Chem. Phys. 2003, 119, 8213-8216.
(20) Perri, M. J.; Van Wyngarden, A. L.; Lin, J. J.; Lee, Y. T.; Boering, K. A.,
J. Phys. Chem. A 2004, 108, 7995-8001.
(21) Mebel, A. M.; Hayashi, M.; Kislov, V. V.; Lin, S. H., J. Phys. Chem. A
2004, 108, 7983-7994.
(22) Mar, K.A.; Van Wyngarden, A. L.;Liang, C.-W; Lee, Y. T.; Lin, J. J.; Boering, K. A., J. Chem. Phys. 2012, 137, 044302
(23) Van Wyngarden, A. L.; Mar, K.A.; Boering, K. A.; Lin, J. J.; Lee, Y. T.; Lin, S.-Y.; Guo, H.; Lendvay, G., J. Am. Chem. Soc. 2007, 129, 2866-2870.
(24) Lu, Y.-J.; Liang, C.-W.; Lin, J. J., J. Chem. Phys. 2006, 125, 133121. (25) Lin, J. J.; Hwang, D. W.; Harich, S.; Lee, Y. T.; Yang, X. M., Rev. Sci.
Instrum. 1998, 69, 1642.
(26) M. Braunstein; J. W. Duff, J. Chem. Phys. 2000, 112, 2736.
(27) K. Takahashi; N. Taniguchi; Y. Sato; Y. Matsumi, J. Geophys. Res. 2002,


![HPSH [ 氧化數平衡反應式係數 ]](data:image/gif;base64,R0lGODlhAQABAIAAAP///wAAACH5BAEAAAAALAAAAAABAAEAAAICRAEAOw==)