Regular Article
One-year follow up of PTSD and depression in elderly
aboriginal people in Taiwan after Typhoon Morakot
Yi-Lung Chen,
Ms,
1Wen-Yau Hsu,
PhD,
2Chung-Sheng Lai,
MD, PhD,
3Tze-Chun Tang,
MD, PhD,
4Peng-Wei Wang,
MD,
4Yi-Chung Yeh,
MD,
4Mei-Feng Huang,
MD,
4Cheng-Fang Yen,
MD, PhD4and Cheng-Sheng Chen,
MD, PhD4*
1Graduate Institute of Epidemiology and Preventive Medicine, National Taiwan University,2Department of Psychology,
National Chengchi University, Taipei, Departments of3Plastic Surgery and4Psychiatry, Kaohsiung Medical University
Hospital, Kaohsiung Medical University, Kaohsiung, Taiwan
Aim: This paper describes a 1-year follow-up of post-traumatic stress disorder (PTSD) symptomatology and depression in an elderly minority population who experienced Typhoon Morakot in Taiwan.
Methods: The PTSD Symptom Scale – Interview and
the 10-item short form Center for Epidemiological Studies Depression Scale were used to examine PTSD symptomatology and depression in 120 victims at 3–6 months and in 88 victims (73.3% reinterview rate) at 11–12 months after the disaster. Further, we looked for associations between stress, prognosis, and development of PTSD symptomatology and depression.
Results: The prevalence of PTSD symptomatology
decreased from 29.2% (35/120) at 3–6 months to 15.9% (14/88) at 11–12 months. The prevalence of depression, however, increased from 43.3% (52/120) to 46.6% (41/88). No factor was associated with follow-up PTSD symptomatology, and only the level
of education was related to follow-up depression. Generally, the risk factors of age, sex, symptomatol-ogy of PTSD and depression at baseline, and stressor of unemployment predicted new-onset or chronic PTSD symptomatology and depression. Delayed-onset depression 48.0% (24/50) was more common than delayed-onset PTSD symptomatology 11.3% (7/62). Chronic and delayed-onset PTSD symptom-atology were more easily developed with depression.
Conclusion: Although PTSD and depression were
separate consequences of trauma, they emerged and affected mental health together. We documented the courses of PTSD and depression among elderly aboriginal people, and the possible effects of demo-graphic, symptomatology, and adverse life stressors were discussed.
Key words: aged, delayed-onset, depression,
longitu-dinal, post-traumatic stress disorder.
T
YPHOON MORAKOT STRUCK southern Taiwan on 8 August 2009. Around 25 000 residents were forcibly and temporarily relocated, 408 people were lost, 924 people were injured, and 619 people were killed. Most of the damage zones were in the high mountains where the Taiwanese aboriginalpeople live. The indigenous people are the ethnic minority group in Taiwan, and are disadvantaged in terms of poorer education, poorer health, lower income, higher unemployment rate, fewer available resources, and shorter life expectancy. This ethnic minority might be vulnerable to mental morbidity after disasters.1
Ethnic minority is characterized as the sharing of some distinctive traits including race, language or culture, and a low social position over a long period. Current information pertaining to mental morbidity after trauma from the literature mostly comes from longitudinal studies of adult populations. Compared to the adult majority, ethnic minority has been
*Correspondence: Cheng-Sheng Chen, MD, PhD, Department of Psychiatry, Kaohsiung Medical University Hospital, Kaohsiung Medical University, No. 100, Tzyou 1st Road, Kaohsiung City 807, Taiwan. Email: [email protected]
Received 21 February 2014; revised 7 July 2014; accepted 23 July 2014.
reported as not only a risk factor for PTSD after disas-ter,1but also as interfering with recovery over time.2
Financial disadvantage and discrimination against ethnic minority increase the possibility of exposure to traumatic events.3Similarly, for elderly and
aborigi-nal people, these are also ethnic minorities and possess many drawbacks (e.g. physical and financial). Unfortunately, studies on ethnic minorities are rare and inadequate.
Our research group conducted a cross-sectional study investigating the correlates of post-traumatic stress disorder (PTSD) occurring 3–6 months after a disaster. We found that nearly 30% of the study par-ticipants developed significant PTSD syndrome.4The
correlates of PTSD morbidity were female gender, poorer self-perceived health, relocation, family death, and depression. As the attention on victims’ mental health continues, prospective studies of mental mor-bidity could help to increase the understanding of delayed-onset PTSD, and chronicity of illness related to trauma.5
There were two aims of the present follow-up study. The first was to elucidate the course of mental conditions among all study participants. Second, we examined the effects of symptomatology at baseline, and of adverse life stressors involving interpersonal relationships, job, health, finance and living after a disaster on the course of mental conditions in elderly aboriginal people.
METHODS
The study was approved by the institutional review board of Kaohsiung Medical University Hospital. Three major aboriginal areas that had been struck by the typhoon were selected for investigation: Namaxia, Taoyuan, and Maolin in Kaohsiung City.
A total of 120 participants aged ≥55 years from these three aboriginal villages were enrolled in the baseline study within 3–6 months of the flood. Because life expectancy is approximately 10 years shorter among the Taiwanese aboriginal population than among the general population, we lowered the age inclusion criterion to age 55. This follow-up study was conducted 11–12 months after the disaster. The follow-up interviews were carried out at local medical units but, if participants did not attend two visits, a phone interview was conducted. Participants were given informed consent after explanation of the purpose and procedures of the study. For participants who were interviewed via phone call, informed
consent was obtained by sending them a stamped self-addressed envelope containing the informed consent form and asking for their response.
All interviews were conducted by psychiatrists or clinical psychology trainees using a semi-structured interview schedule, including the Chinese version of the PTSD Symptom Scale – Interview (PSS-I) and the Chinese version of the 10-item short form Center for Epidemiological Studies Depression Scale (CES-D). The PSS-I was used for the assessment of PTSD symp-toms; it consists of 17 items with a 4-point scale: 0 (not at all) to 3 (very much) and has shown good internal consistency reliability (Cronbach α = 0.85).6,7 A score ≥15 indicates significant PTSD
symptomatology. The short form CES-D was used for the assessment of depression with a 4-point scale (0–3) and was revised and translated into Mandarin Chinese by Taiwan Department of Health. A cut-off score of 10 yields a specificity of 0.93 and a sensitivity of 0.96 for the diagnosis of major depression,8 and
was used in this study. In addition, we also collected data including (i) demographic characteristics; (ii) traumatic experiences (personal injury, death of a relative, and property damage with a yes or no response); (iii) relocation status (whether the partici-pant was relocated to a temporary shelter); (iv) self-perceived health (compared to others of similar age); and (v) uncertainty of negative future and perceived life stressors (five kinds of adverse life events after the disaster according to subjective experience: 1, health ‘have you been worried about the relapse of your disease or having another disease?’; 2, job ‘have you been worried about losing your job or could not find a job?’; 3, finance ‘have you been worried that you would spend all of your money?’; 4, relationships with others ‘have you been worried about becoming alienated from your family and friends?’; and 5, living ‘have been worried about being homeless, the difficulties from reconstruction of house, or not used to the relocation house’) which was examined using a dichotomous scale (yes/no).
Statistical analysis
To examine the association of baseline characteristics and traumatic experience factors with follow-up PTSD symptomatology and depression status, chi-squared test and Student’s t-test were used separately for categorical and continuous variables. Participants were divided into four groups based on PTSD symp-tomatology and depression: continuous health;
delayed onset; sustained; or remitted. One-way analysis of variance (ANOVA) was used to examine differences between groups in the three PSS-I subscale scores and total score, and the CES-D score at baseline. Further post-hoc least square difference analysis was carried out when significant differences were identified on ANOVA. Differences in median PSS-I and CES-D scores between genders and waves were analyzed using Mann–Whitney U-test and Wilcoxon signed rank test. Student’s t-test was used to examine whether there were age differences between groups, and chi-squared test to determine whether stressors differed across groups.
Factors with statistical significance (P< 0.05) or marginal significance (0.05< P < 0.1) were enrolled in and analyzed on multivariate forward stepwise logistic regression to evaluate possible risk factors for PTSD and depression. To provide more accurate inferences, bootstrap logistic regression analyses was used with 1000 bootstrap samples stratified by group, and the predictors were chosen according to the final model, after being selected from previous multivari-ate logistic regression with forward selection.
RESULTS
A total of 88 study participants (73.3%) completed the follow-up study; among them, 57 were inter-viewed face to face, and 31 were interinter-viewed by phone. The non-responders consisted of nine who could not be contacted by phone, one who declined to participate, and 22 who did not answer the phone, even after repeated calls. On comparison of the drop-outs with those who remained in the follow-up study, there were no statistically significant differ-ences in the total scores of the PSS-I (χ2= 0.23,
P= 0.880) and CES-D (χ2= 0.00, P = 0.956) at
base-line, gender (χ2= 0.86, P = 0.354), or age (t = 1.12,
P= 0.249). Of the 88 participants who completed the follow-up study, 55 (62.5%) were female. The average age of the study participants was 66.8± 8.3 years. A total of 76 (86.3%) of the partici-pants had an educational level of primary school or below. Eleven (12.5%) were injured, and four (4.5%) experienced the death of close family members in the disaster. Twenty-one (23.9%) reported that there had been damage to their house. Fourteen (15.9%) and 41 (46.6%) study participants in the follow-up study met the criteria for PTSD symptomatology and depression, respectively. On univariate analysis only educational level was associated with depression at
follow up, while none of the factors was associated with follow-up PTSD symptomatology (Table 1).
Changes in PTSD symptomatology
and depression
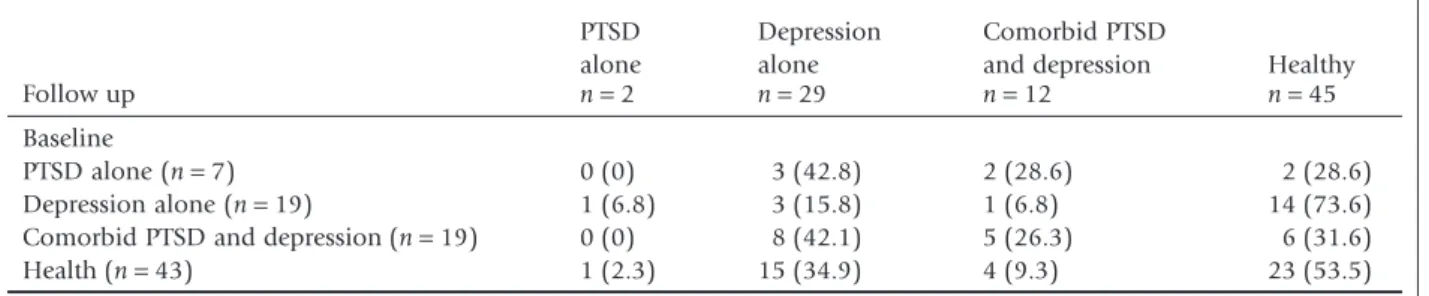
The prevalence of PTSD symptomatology and depres-sion was 15.9% and 43.3% at follow up compared to 29.2% and 46.6 at baseline, respectively. Table 2 lists the changes in morbidity between waves. None with PTSD alone at baseline remained as having PTSD alone; rather, 42.8% transformed into depression alone, 28.6% had depression superimposed on pre-existing PTSD, and 28.6% became well. The majority with depression alone at baseline became well. A total f 31.6% of those with coexisting PTSD and depression returned to normal healthy status, while 26.3% remained as having the two morbid diseases, and 42.1% still had depression alone. The complete remission rate of PTSD at baseline, for both PTSD alone and comorbid with depression, was 30.8%, while that of depression was 52.6%.
According to the changes in morbidity, we divided all participants into four groups based on PTSD: ‘con-tinuously without PTSD’, ‘delayed-onset PTSD’ (no PTSD at baseline, but PTSD at follow up), ‘sustained PTSD’ (PTSD at both baseline and follow up), and ‘remitted PTSD’ (PTSD at baseline, but no PTSD at follow up), and into another four groups similarly based on depression.
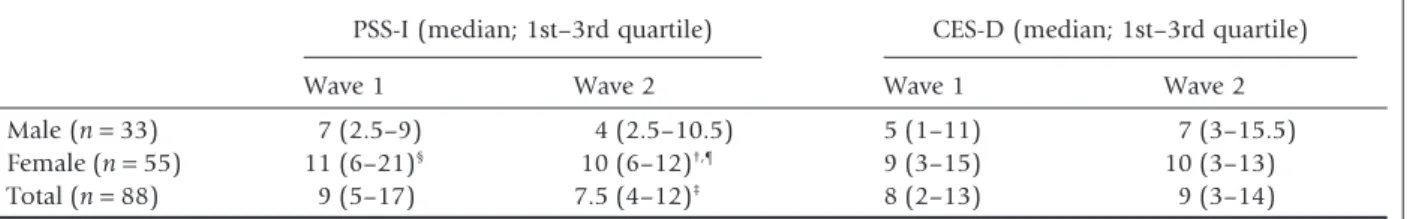
Table 3 lists the numbers of study participants within the groups with morbidity. Only 23 partici-pants (26.1%) were completely well across baseline and follow up. The majority (85.7%) of cases of delayed-onset PTSD were related to depression, and were mostly cases of delayed-onset depression. All participants with sustained PTSD were depressed at follow up. Over half (57.9%) of those with PTSD at baseline and remission at follow up had developed depression at follow up. Table 4 lists the median PPS-I and CES-D scores for the total sample and gender at both waves. For the total sample, there was a significant decrease in median PPS-I score between waves. The median PSS-I score at wave 2 was signifi-cantly lower than at wave 1 and was higher in women than in men at both timepoints.
Effect of prior symptoms of PTSD
and depression
We explored the risk factors of delayed-onset psychi-atric morbidity among those without PTSD or
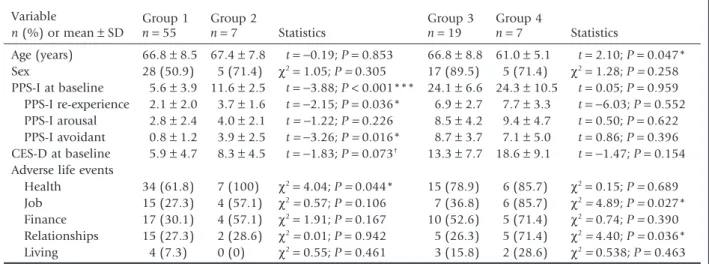
depres-sion at baseline. Similar analyses were conducted for the risk factors of sustained morbidity among those with PTSD or depression at baseline (Table 5). Those with delayed-onset PTSD scored higher in the PSS-I at baseline than those continuously without PTSD. The difference was mainly contributed to by the subscale of avoidance. The delayed-onset PTSD group also had a higher rate of health problems between the waves. To examine the correlates of chronicity of illness related to PTSD, the sustained PTSD group was
com-pared with the remitted PTSD group. The sustained group was younger than the remitted group. There were no significant differences in the symptomatol-ogy of PTSD and depression at baseline between the two groups. There were higher rates of adverse per-ceived life events related to job and relationship problems in the sustained group than in the remitted group. All correlated variables on univariate analysis were entered into logistic regression analysis, and only the total PPS-I score could predict delayed-onset
Table 1. Subject characteristics
n (%) or mean± SD PTSD n= 14 No PTSD n= 74 Statistics Depression n= 41 No depression n= 47 Statistics Sex Female 10 (71.4) 45 (60.8) χ2= 0.57 28 (68.3) 27 (57.4) χ2= 1.01 Male 4 (28.6) 29 (39.2) P= 0.452 13 (31.7) 20 (42.6) P= 0.294 Age (years) 67.5± 8.5 66.8 ± 9 t= 0.38; P = 0.703 68.9 ± 8.5 64.9± 7.9 t= 0.51; P = 0.476 Education ≤Primary school 14 (100) 62 (83.8) χ2= 2.63 39 (95.1) 37 (78.7) χ2= 5.00 >Primary school 0 (0) 12 (16.2) P= 0.201 2 (4.9) 10 (21.3) P= 0.025* Personal injury No injury 12 (85.7) 65 (87.8) χ2= 0.49 34 (82.9) 43 (91.5) χ2= 1.47 Injury 2 (14.3) 9 (12.2) P= 0.555 7 (17.1) 4 (8.5) P= 0.226 Family death No death 13 (92.9) 71 (95.9) χ2= 0.26 39 (95.1) 45 (95.7) χ2= 0.20 Death 1 (7.1) 3 (4.1) P= 0.507 2 (4.9) 2 (4.3) P= 0.889 Property loss Nothing lost 9 (64.3) 58 (78.4) χ2= 1.29 28 (68.3) 39 (83.0) χ2= 2.56 Property lost 5 (35.7) 16 (21.6) P= 0.308 13 (31.7) 8 (17.0) P= 0.107 Self-perceived health Better or unchanged 10 (71.4) 49 (66.2) χ2= 0.145 25 (61.0) 34 (72.3) χ2= 1.28 Worse 4 (28.6) 25 (33.8) P= 0.704 16 (39.0) 13 (27.7) P= 0.258 *P< 0.05. PTSD, post-traumatic stress disorder.
Table 2. Development of PTSD symptomatology and depression
Follow up PTSD alone Depression alone Comorbid PTSD
and depression Healthy
n= 2 n= 29 n= 12 n= 45
Baseline
PTSD alone (n= 7) 0 (0) 3 (42.8) 2 (28.6) 2 (28.6)
Depression alone (n= 19) 1 (6.8) 3 (15.8) 1 (6.8) 14 (73.6)
Comorbid PTSD and depression (n= 19) 0 (0) 8 (42.1) 5 (26.3) 6 (31.6)
Health (n= 43) 1 (2.3) 15 (34.9) 4 (9.3) 23 (53.5)
PTSD among those without PTSD at baseline, and job stress could predict sustained PTSD among those with PTSD at baseline. Significant predictors were enrolled into bootstrap logistic regression analysis, the 95% bias-corrected, accelerated percentile confi-dence interval for these odds ratios did not contain the null value (odds ratio, 1; Table 6).
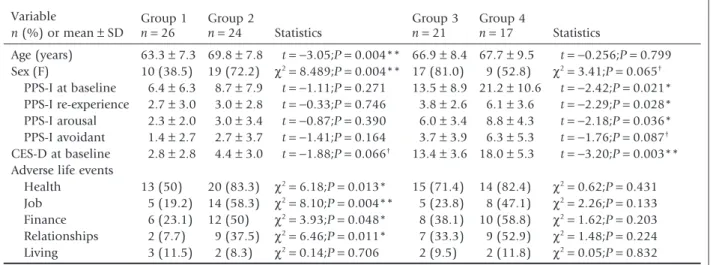
Similar analyses were conducted for depression (Table 7). Those with delayed-onset depression were female, older, and had experienced more adverse events related to health, job, finance, and relation-ship problems than those without depression throughout. The two groups did not differ in tomatology at baseline. There were significant symp-tomatology differences, however, in both the PPS-I, especially the subscales of re-experience and arousal, and the CES-D at baseline between the remitted depression group and the sustained depression group. There were no differences in the occurrence of adverse perceived life events between these two
groups. Controlled and bootstrap logistic regression analyses indicated that aging, female gender and job stress increased the risk of delayed-onset depression among those without depression initially. In con-trast, men were at higher risk of sustained depression than women among those with depression at base-line, and another predictor was higher total CES-D score (Table 8).
DISCUSSION
In this study, the rate of PTSD symptomatology reduced from 29.2% at the subacute stage to 15.9% approximately 1 year after occurrence of a disaster, but depression slightly increased from 43.3% to 46.6% among the elderly aboriginal people enrolled in the study. A total of 8% and 27.3% of the aborigi-nal elders were well at baseline but developed PTSD and depression later on, respectively. A total of 8% and 19.3% continuously presented with PTSD and
Table 3. Cross-table of PTSD and depression
Continuously without depression (n= 26) Delayed-onset depression (n= 24) Sustained depression (n= 17) Remitted depression (n= 21) Continuously without PTSD (n= 55) 23 15 3 14 Delayed-onset PTSD (n= 7) 1 4 1 1 Sustained PTSD (n= 7) 0 2 5 0 Remitted PTSD (n= 19) 2 3 8 6
PTSD, post-traumatic stress disorder.
Table 4. Change in PSS-I and CES-D score vs gender and time
PSS-I (median; 1st–3rd quartile) CES-D (median; 1st–3rd quartile)
Wave 1 Wave 2 Wave 1 Wave 2
Male (n= 33) 7 (2.5–9) 4 (2.5–10.5) 5 (1–11) 7 (3–15.5)
Female (n= 55) 11 (6–21)§ 10 (6–12)†,¶ 9 (3–15) 10 (3–13)
Total (n= 88) 9 (5–17) 7.5 (4–12)‡ 8 (2–13) 9 (3–14)
†Female PPS-I, wave 1> wave 2 (Wilcoxon signed rank test: z = −2.72; P = 0.006).‡Total PPS-I, wave 1> wave 2
(Wilcoxon signed rank test: z= −2.61; P = 0.009).§PPS-I at wave 1, female> male (Mann–Whitney U-test: U = 3.20,
P= 0.001).¶PPS-I at wave 2, female> male (Mann–Whitney U-test: U = 2.82, P = 0.005). CES-D, Chinese version of
Center for Epidemiological Studies Depression Scale; PSS-I, Chinese version of PTSD Symptom Scale – Interview; PTSD, post-traumatic stress disorder; wave 1, 3–6 months after Typhoon Morakot; wave 2, 11–12 months after Typhoon Morakot.
depression at both baseline and follow up, respec-tively. Predictors of delayed-onset PTSD and sus-tained PTSD were previous PTSD symptoms and job stress, respectively, whereas those who were older, female, or were experiencing job stress were at higher risk of delayed-onset depression, and those who were male and had a higher score on the depression scale were likely to have persistent depression.
We found that the transformation of psychiatric morbidity after the natural disaster was pleomorphic among the elderly aboriginal population. The
preva-lence of depression increased, whereas that of PTSD reduced, from which it could be inferred that depres-sion is more refractory than PTSD following a natural disaster. The complete remission rate of PTSD symp-tomatology was 30.8%, which was lower than the 52.6% for depression. This paradoxical observation could be due to the fact that a substantial proportion of PTSD cases transformed into depression, but not into healthy status.
In cases of depression, the majority of remitted depression cases came from the subgroup of
depres-Table 5. Age, symptomatology at baseline, and adverse life events vs PTSD trajectory Variable n (%) or mean± SD Group 1 Group 2 Statistics Group 3 Group 4 Statistics n= 55 n= 7 n= 19 n= 7 Age (years) 66.8± 8.5 67.4 ± 7.8 t= −0.19; P = 0.853 66.8± 8.8 61.0 ± 5.1 t= 2.10; P = 0.047* Sex 28 (50.9) 5 (71.4) χ2= 1.05; P = 0.305 17 (89.5) 5 (71.4) χ2= 1.28; P = 0.258 PPS-I at baseline 5.6± 3.9 11.6 ± 2.5 t= −3.88; P < 0.001*** 24.1 ± 6.6 24.3 ± 10.5 t= 0.05; P = 0.959 PPS-I re-experience 2.1± 2.0 3.7± 1.6 t= −2.15; P = 0.036* 6.9± 2.7 7.7± 3.3 t= −6.03; P = 0.552 PPS-I arousal 2.8± 2.4 4.0± 2.1 t= −1.22; P = 0.226 8.5± 4.2 9.4± 4.7 t= 0.50; P = 0.622 PPS-I avoidant 0.8± 1.2 3.9± 2.5 t= −3.26; P = 0.016* 8.7± 3.7 7.1± 5.0 t= 0.86; P = 0.396 CES-D at baseline 5.9± 4.7 8.3± 4.5 t= −1.83; P = 0.073† 13.3± 7.7 18.6 ± 9.1 t= −1.47; P = 0.154
Adverse life events
Health 34 (61.8) 7 (100) χ2= 4.04; P = 0.044* 15 (78.9) 6 (85.7) χ2= 0.15; P = 0.689
Job 15 (27.3) 4 (57.1) χ2= 0.57; P = 0.106 7 (36.8) 6 (85.7) χ2= 4.89; P = 0.027*
Finance 17 (30.1) 4 (57.1) χ2= 1.91; P = 0.167 10 (52.6) 5 (71.4) χ2= 0.74; P = 0.390
Relationships 15 (27.3) 2 (28.6) χ2= 0.01; P = 0.942 5 (26.3) 5 (71.4) χ2= 4.40; P = 0.036*
Living 4 (7.3) 0 (0) χ2= 0.55; P = 0.461 3 (15.8) 2 (28.6) χ2= 0.538; P = 0.463 †0.1> P > 0.05. *P < 0.05. ***P < 0.001. Group 1, continuously without PTSD; group 2, delayed-onset PTSD; group 3,
remitted PTSD; group 4, sustained PTSD. CES-D, Chinese version of Center for Epidemiological Studies Depression Scale; PSS-I, Chinese version of PTSD Symptom Scale – Interview; PTSD, post-traumatic stress disorder.
Table 6. Significant predictors of PTSD
Group 1 vs. group 2 OR (95%CI) P Bootstrapping model Group 1 vs. group 2 OR (95%CI) P Group 3 vs. group 4 OR (95%CI) P Bootstrapping model Group 3 vs. group 4 OR (95%CI) P Age –‡ –‡ –‡ –† –† –† –†
PPS-I (total score) 1.65 (1.14–2.39) 0.009** 1.73 (1.31–§) 0.001** –‡ –‡ –‡ –‡
CES-D at baseline –† –† –† –† –‡ –‡ –‡ –‡
Health –† –† –† –† –‡ –‡ –‡ –‡
Job –‡ –‡ –‡ –‡ 10.29 (1.02–103.95) 0.048* 8.57 (1.11–§) 0.035*
Relationships –‡ –‡ –‡ –‡ –† –† –† –†
*P< 0.05. **P < 0.01.†Removed from forward stepwise logistic regression model due to lack of statistical significance, so no statistics
were calculated.‡Unrelated factors not included in forward stepwise logistic regression model due to prior analyses.§Boundary is too
high. CES-D, Chinese version of Center for Epidemiological Studies Depression Scale; CI, confidence interval; OR, odds ratio; PSS-I, Chinese version of PTSD Symptom Scale – Interview; PTSD, post-traumatic stress disorder.
sion alone at baseline, but not the subgroup of comorbidity with PTSD. More than two-thirds of individuals with comorbidity at baseline remained morbid at follow up, whereas among 19 subjects with
depression alone, 14 returned to health. A high rate of recovery from depression was found only in cases of depression alone, and the high rate of depression at follow-up was contributed to by new cases of
Table 7. Age, symptomatology at baseline, and adverse life events vs depression trajectory Variable n (%) or mean± SD Group 1 Group 2 Statistics Group 3 Group 4 Statistics n= 26 n= 24 n= 21 n= 17 Age (years) 63.3± 7.3 69.8 ± 7.8 t= −3.05;P = 0.004** 66.9 ± 8.4 67.7 ± 9.5 t= −0.256;P = 0.799 Sex (F) 10 (38.5) 19 (72.2) χ2= 8.489;P = 0.004** 17 (81.0) 9 (52.8) χ2= 3.41;P = 0.065† PPS-I at baseline 6.4± 6.3 8.7± 7.9 t= −1.11;P = 0.271 13.5± 8.9 21.2 ± 10.6 t= −2.42;P = 0.021* PPS-I re-experience 2.7± 3.0 3.0± 2.8 t= −0.33;P = 0.746 3.8± 2.6 6.1± 3.6 t= −2.29;P = 0.028* PPS-I arousal 2.3± 2.0 3.0± 3.4 t= −0.87;P = 0.390 6.0± 3.4 8.8± 4.3 t= −2.18;P = 0.036* PPS-I avoidant 1.4± 2.7 2.7± 3.7 t= −1.41;P = 0.164 3.7± 3.9 6.3± 5.3 t= −1.76;P = 0.087† CES-D at baseline 2.8± 2.8 4.4± 3.0 t= −1.88;P = 0.066† 13.4± 3.6 18.0 ± 5.3 t= −3.20;P = 0.003**
Adverse life events
Health 13 (50) 20 (83.3) χ2= 6.18;P = 0.013* 15 (71.4) 14 (82.4) χ2= 0.62;P = 0.431
Job 5 (19.2) 14 (58.3) χ2= 8.10;P = 0.004** 5 (23.8) 8 (47.1) χ2= 2.26;P = 0.133
Finance 6 (23.1) 12 (50) χ2= 3.93;P = 0.048* 8 (38.1) 10 (58.8) χ2= 1.62;P = 0.203
Relationships 2 (7.7) 9 (37.5) χ2= 6.46;P = 0.011* 7 (33.3) 9 (52.9) χ2= 1.48;P = 0.224
Living 3 (11.5) 2 (8.3) χ2= 0.14;P = 0.706 2 (9.5) 2 (11.8) χ2= 0.05;P = 0.832 †0.1> P > 0.05. *P < 0.05. **P < 0.01. Group 1, continuously without depression; group 2, delayed-onset depression;
group 3, remitted depression; group 4, sustained depression. CES-D, Chinese version of Center for Epidemiological Studies Depression Scale; PSS-I, Chinese version of PTSD Symptom Scale – Interview; PTSD, post-traumatic stress disorder.
Table 8. Significant predictors of depression
Group 1 vs. group 2 OR (95%CI) P Bootstrapping model Group 1 vs. group 2 OR (95%CI) P Group 3 vs. group 4 OR (95%CI) P Bootstrapping model Group 3 vs. group 4 OR (95%CI) P Age 1.22 (1.07–1.38) 0.002** 1.22 (1.06–§) 0.004** –‡ –‡ –‡ –‡ Sex (M) 0.08 (0.01–0.55) 0.010* 0.08 (<0.01–0.18) 0.005** 10.71 (1.46–78.49) 0.020* 10.71 (1.26–§) 0.012* PPS-I (total score) –‡ –‡ –‡ –‡ –† –† –† –† CES-D at baseline –† –† –† –† 1.41 (1.11–1.80) 0.005** 1.41 (1.27–1.85) 0.002** Health –† –† –† –† –‡ –‡ –‡ –‡ Job 17.36 (2.75–109.53) 0.002** 20.00 (12.50–100.00) 0.001** –‡ –‡ –‡ –‡ Finance –† –† –† –† –‡ –‡ –‡ –‡ Relationships –† –† –† –† –‡ –‡ –‡ –‡
*P< 0.05.**P< 0.01.***P< 0.001.†Removed from forward stepwise logistic regression model due to no statistical significance, so no
statistics were calculated.‡Unrelated factors not included in forward stepwise logistic regression model due to prior analyses.§Boundary
is too high. CES-D, Chinese version of Center for Epidemiological Studies Depression Scale; CI, confidence interval; OR, odds ratio; PSS-I, Chinese version of PTSD Symptom Scale – Interview; PTSD, post-traumatic stress disorder.
depression transformed from PTSD alone or from healthy participants, not continuous depression. The different change trajectory between PTSD and depres-sion after a disaster implies that they are separate consequences of trauma, and they have their own course and prognosis. More follow-up studies are needed, however, to examine this speculation.
Moreover, a substantial number of participants with PTSD alone or comorbid with depression at baseline more easily developed or sustained depres-sion, but not vice versa. A 20-year longitudinal study also reported a similar finding, that only PTSD could predict subsequent depression, but depression could not.9Therefore, when PTSD develops after disasters,
people might simultaneously or subsequently have comorbid depression or PTSD may have transformed into depression before full recovery, rather than manifest PTSD alone. It is now considered that depression may be a complication of PTSD, second-ary to prolonged PTSD.
Understanding of the risk factors of mental mor-bidity will facilitate development of preventive approaches. Those without PTSD at baseline but who had developed PTSD at 1 year appeared to have a higher level of subclinical PTSD symptoms at base-line compared to people who were continuously without PTSD. This implies a susceptibility to the development of PTSD in those with subthreshold PTSD symptoms. We suggest that interventions to treat mental problems should be extended to those with subclinical symptoms.
The adverse life event of job stress was associated with non-remission of PTSD. Job issues are often the main difficulty after disasters. Job stress was not only a risk factor of sustained PTSD, but also of newly developed depression at follow up. In addition, those who were older were at higher risk of delayed-onset depression. Owing to the lower socioeconomic status, aboriginal elderly people in Taiwan are usually still responsible for the family income.10Having a job
after a disaster might provide a feeling of purpose. Rodriguez proposed a psychological model for describing the experience of loss of a job related to helplessness and negative self-esteem. According to this model, in older adults the losing of a job would generate a belief of helplessness, which produces three types of negative deficits: cognition, motiva-tion, and emotion. Further, the older job-loser usually has more serious financial commitments and family responsibilities compared to the younger job-loser, thereby causing them to generate more internal
attributional processes, believing that the cause of the job loss was due to internal factors (e.g. incapability of self). An internal attributional process compared to external attributional process (attributing the failure to environment) is specific to depression.11
Therefore, the job effect is relatively important among elderly people, especially in minorities because unemployment is more common among them. Involvement in rehabilitative work may help recovery from PTSD. In particular, in those who expe-rienced great damage after a disaster, having a job can give life meaning.
Age was a risk factor for the development of delayed-onset depression in the aboriginal elders. There are several possible explanations. The first, according to Selye’s general adaptation syndrome (GAS), describes how people react to stress and the subsequent stages of reaction.12There are three stages
of reaction in GAS: alarm; resistance; and exhaustion. Exhaustion indicates that after persistently living in a high-stress environment, people finally exhaust their energy, and some physical reactions emerge, includ-ing hormonal/neurotransmitter dysregulation, which has been found to be related to depression.13Energy
reserves decrease with age, and are comparatively poorer than in younger adults.14Therefore, exhaustion
among older people may be related to delayed-onset morbidity. Second, it was common that people sup-press their negative emotion after disasters. Suppres-sion is considered as a psychopathological factor for development of PTSD and is associated with depres-sion.15This emotion regulation strategy of
suppres-sion increases with age compared to other common strategies (e.g. rumination and reappraisal), which are observed to decrease with age.16It should be noted,
however, that there is a rebound effect linking emotion suppression, which increases in negative affect and sympathetic arousal over time.17This may
explain why a high rate of delayed-onset depression was observed in the present study. The other possible reason may be that, as Haley et al. observed, an elderly ethnic minority, compared to a young majority, reported high rates of depressive symptomatology, which typically related to difficulty in acculturation, or impairments in physical health.18Therefore, changes
in the environment or physical injury after disasters that force them to adapt or even move to a different environment based on governmental policy or per-sonal choice, also caused substantial stress.
The sex differences in depression might be partly explained by coping strategies: it has been reported
that women are more likely to express their feelings and emotions or seek help and, as such, might more easily meet the criteria for symptoms of depression.19
Whereas, men are more likely to suppress and resist acknowledging their emotional distress and exhibit more withdrawal behaviors, or conceal them with the use of alcohol.20It has been observed that the
expres-sion of sadness of depresexpres-sion in women is more common than in men, and that expression, instead of suppression, of sadness may lead to the provision of assistance from others and more social support, which has been suggested to be important to the outcome of depression.21Thus, the effects of coping
behaviors differ in the initiation and course of depression. Finally, it should be noted that the sus-ceptibility to depression in women is more signifi-cant in later life, but not in adolescence.22
More severe depression and PTSD predicted a poorer outcome.9 The present findings, however,
only replicated such a finding in depression, but not in PTSD. It may be that relatively fewer participants had PTSD, and therefore the power was not sufficient to be able to detect an effect.
The novelty of this study was the discovery of several risk factors for continuous and delayed-onset PTSD and depression, especially in an elderly minor-ity; a subject area that has previously received little attention in the literature. Delayed-onset depression is usually studied with regard to traumatic brain harm (e.g. stroke or brain injury). Instead, we studied delayed-onset depression after a disaster, and found that it followed a pattern similar to PTSD. General longitudinal studies usually report changes in preva-lence and incidence rates of PTSD, depression, and comorbidity after disasters, and we extended the present analysis based on previous studies,23,24 to
examine the course of PTSD and depression. We hope further studies in this subject area provide more evidence for distinguishing the different course of PTSD and depression.
Limitations
There were some limitations to this study. First, the two waves of assessment limited the ability to detect changes in psychiatric morbidity during that period; in particular, PTSD symptomatology and depression might fluctuate. Second, given that the present minority group was not large, the sample size was small and type II errors may accordingly have limited certain risk factors of PTSD symptomatology and
depression from being examined. Finally, there was no comparison group with which to compare in order to determine whether there were different tra-jectories for PTSD symptomatology and depression, which may limit the generalization of the findings of this research.
Conclusion
There was a significant decreasing trend for PTSD symptomatology and a slight increasing trend for depression from 3–6 months to 11–12 months after the disaster among an elderly aboriginal population in Taiwan. The comorbidity for PTSD and depression is pleomorphic. The present findings suggest that depression is more refractory and persistent than PTSD after disaster in an elderly minority community in Taiwan, and stress might explain the continuous course of PTSD substantially.
ACKNOWLEDGMENT
The authors declare no conflict of interest.
REFERENCES
1. Brewin CR, Andrews B, Valentine J. Meta-analysis of risk factors for posttraumatic stress disorder in trauma-exposed adults. J. Consult. Clin. Psychol. 2000; 68: 748–766. 2. La Greca AM, Silverman WK, Vernberg EM, Prinstein MJ.
Symptoms of posttraumatic stress in children after Hurri-cane Andrew: A prospective study. J. Consult. Clin. Psychol. 1996; 64: 712–723.
3. Roberts AL, Austin SB, Corliss HL, Vandermorris AK, Koenen KC. Pervasive trauma exposure among US sexual orientation minority adults and risk of posttraumatic stress disorder. Am. J. Public Health 2010; 100: 2433–2441. 4. Chen YL, Lai CS, Chen WT et al. Risk factors for PTSD after Typhoon Morakot among elderly people in Taiwanese aboriginal communities. Int. Psychogeriatr. 2011; 23: 1686–1691.
5. North CS, Smith EM, Spitznagel EL. One-year follow-up of survivors of a mass shooting. Am. J. Psychiatry 1997; 154: 1696.
6. Su Y-J, Chen S-H. A three-month prospective investigation of negative cognitions in predicting posttraumatic stress symptoms: The mediating role of traumatic memory quality. Chin. J. Psychol. 2008; 50: 167–186.
7. Foa EB, Riggs DS, Dancu CV, Rothbaum BO. Reliability and validity of a brief instrument for assessing post-traumatic stress disorder. J. Trauma. Stress 1993; 6: 459– 473.
8. Chang K-F, Weng L-J. Screening for depressive symptoms among older adults in Taiwan: Cutoff of a short form of the Center for Epidemiologic Studies Depression Scale. Health 2013; 5: 588.
9. Ginzburg K, Ein-Dor T, Solomon Z. Comorbidity of post-traumatic stress disorder, anxiety and depression: A 20-year longitudinal study of war veterans. J. Affect. Disord. 2010; 123: 249–257.
10. Patel V, Prince M. Ageing and mental health in a develop-ing country: Who cares? Qualitative studies from Goa, India. Psychol. Med. 2001; 31: 29–38.
11. Rodriguez YG. Learned helplessness or expectancy-value? A psychological model for describing the experiences of different categories of unemployed people. J. Adolesc. 1997; 20: 321–332.
12. Selye H. The evolution of the stress concept: Stress and cardiovascular disease. Am. J. Cardiol. 1970; 26: 289– 299.
13. McEwen BS. Protection and damage from acute and chronic stress: Allostasis and allostatic overload and rel-evance to the pathophysiology of psychiatric disorders. Ann. N. Y. Acad. Sci. 2004; 1032: 1–7.
14. Starling RD. Energy expenditure and aging: Effects of physical activity. Int. J. Sport Nutr. Exerc. Metab. 2001; 11: 208.
15. Kendall-Tackett KA. Physiological correlates of childhood abuse: Chronic hyperarousal in PTSD, depression, and irritable bowel syndrome. Child Abuse Negl. 2000; 24: 799–810.
16. Nolen-Hoeksema S, Aldao A. Gender and age differences in emotion regulation strategies and their relationship to depressive symptoms. Pers. Individ. Dif. 2011; 51: 704– 708.
17. Campbell-Sills L, Barlow DH, Brown TA, Hofmann SG. Effects of suppression and acceptance on emotional responses of individuals with anxiety and mood disorders. Behav. Res. Ther. 2006; 44: 1251–1263.
18. Haley WE, Han B, Henderson JN. Aging and ethnicity: Issues for clinical practice. J. Clin. Psychol. Med. Settings 1998; 5: 393–409.
19. Briscoe M. Sex differences in psychological well-being. Psychol. Med. Monogr. Suppl. 1982; 1: 1–46.
20. Grant BF, Harford TC. Comorbidity between DSM-IV alcohol use disorders and major depression: Results of a national survey. Drug Alcohol Depend. 1995; 39: 197–206. 21. George LK, Blazer DG, Hughes DC, Fowler N. Social support and the outcome of major depression. Br. J. Psy-chiatry 1989; 154: 478–485.
22. Culbertson FM. Depression and gender: An international review. Am. Psychol. 1997; 52: 25.
23. O’Donnell ML, Creamer M, Pattison P. Posttraumatic stress disorder and depression following trauma: Under-standing comorbidity. Am. J. Psychiatry 2004; 161: 1390– 1396.
24. Goenjian AK, Roussos A, Steinberg AM et al. Longitudinal study of PTSD, depression, and quality of life among ado-lescents after the Parnitha earthquake. J. Affect. Disord. 2011; 133: 509–515.