E
lectrokinetic treatment of
Cr(VI) contaminated clay
enhanced
by
zero valent iron
barriers
Chih-Huang Weng1,*, Ching Yuan2, Hao-Wen Tsai3 1
Department of Civil and Ecological Engineering, I-Shou University, Da-Hsu County, Kaohsiung 84008, Taiwan (*author for correspondence, email: [email protected])
2
Department of Civil and Environmental Engineering, National University of Kaohsiung, No. 700, Kaohsiung University Road, Nan-Tzu Dist., Kaohsiung City 811, Taiwan
3
Division of Environmental Protection, Da-Lin Refinery Manufactory of China Petroleum Corporation, Kaohsiung City 812, Taiwan
ABSTRACT
This study investigated the effectiveness of removing Cr(VI) from clay in the electrokinetic (EK) process coupled with zero valent iron (Fe0) barrier. The EK experiments were conducted with a container (length 40 cm, height 30 cm, width 24 cm) containing 24.5 kg of Cr(VI) contaminated kaolinite (850 mg/kg) under a constant electric gradient of 1 V/cm. Thebarrier filled with granular Fe0 and sand (1:2 w/w) was installed in the middle of the container. Results show that Cr removal was characterized by high concentration of Cr(VI) and Cr(III) occurred in anolyte and Cr(III) precipitates in catholyte. The Cr(VI) reduction efficiencies for the process without barrier were 69 and 76%, respectively, for the 14 and 20 d operation. Once the barrier was installed, the corresponding efficiencies increased up to 85 and 93%. Findings indicated that the incorporation of barrier into EK process not only could enhance the reduction of Cr(VI) contamination, but the operation also simultaneously collects the Cr from the electrode reservoirs. The total cost including power consumption, electrode, and Fe0 utilized in this process was 42 USD/m3-soil for the test coupled with barrier. The results of this study could provide useful information for remediation of Cr(VI) contaminated sites.
KEYWORDS
Barrier, Chromium, Cr(VI), Electrokinetic, Soil, Zero Valent Iron
1. INTRODUCTION
Chromium (Cr) contamination has been found in many Superfund sites, residential areas, and industrial areas, such as electroplating facilities and tannery industries (Stepniewska and Bucior 2001). Cr occurs primarily as Cr(III) and Cr(VI) in the soil. Cr(III) is relatively immobile and nontoxic compared to Cr(VI) because Cr(III) can strong adsorbed onto soils and forming insoluble Cr hydroxides. The anionic Cr(VI) ions are of great concern owing to their carcinogenic and metallurgic to living organisms and their significantly mobility in subsurface. Thus, remediation of Cr(VI) contaminated sites is the top priority in many countries for environmental protection. In-situ treatment of Cr contaminated soils includes chemical/organic reduction (He and Traina 2005, James 2001) and bio-reduction (Smith 2001). However, these methods can not effectively remove Cr from a low permeability soil, e.g. clayey soil. One of the emerging in-situ technology, electrokinetic (EK) remediation, has been drawn attention by many governmental official and remediation engineers. The main advantage of this technology is that it can separate the contaminants from low permeability soils by applying a low intensity direct current to the contaminated soil. Th key mechanisms involve in the EK soil remediation: (1) the advection of electroosmotic (EO) flow (forced water movement) driven by electric current, (2) the movement of H+ ions produced from water electrolysis at the anode advancing through soil toward the cathode, and (3) the electromigration of charged ions toward the opposite electrodes (Alshawabkeh et al. 1999).
Development and successful application of EK process to to treat soil contaminated with organic (1992, Ho 1999, Yang and Liu 2001, Weng et al. 2003, Yuan and Weng 2004) and inorganic contaminants (Weng and Yuan 2001, Reddy et al. 2003, Weng and Huang 2004) have been documented. Permeable reactive barrier (PRB) has been practiced in field application for two decades to removal halogenated organics and specific inorganic compounds from groundwater. The function of PRB is attributed to the process that contains an engineered zone of reactive materials in the downstream of ground water, which allows intercepting the contaminant plum within the aquifer. In reactive zone, various materials can be used as a fill. The most common one is zero valent iron (Fe0) due to its readily available, long serve life, relatively inexpensive with little maintenance, a good reducing agent for destruction many recalcitrant contaminants, and producing nontoxic products. When the barrier was filled with selected microorganisms it can act like a biological reactor to degrade the target contaminants. Other materials such as limestone, hydroxyapatite, activated carbon, and zeolite, which act as chemical precipitator or adsorbent to retain the contaminants within the barrier are also applicable. As such, as the contaminated flow passes the barrier, the contaminants are destructed, adsorbed, or degraded by the fillings of the barrier. This process has a good reputation on the removal of certain persistent organic and inorganic contaminants such as dense of nonaqueous phase liquids and Cr(VI) from groundwater (Blowes et al. 2000, Philips et al. 2003, Wilkin et al. 2005, Ebert et al. 2006, Lai and Lo 2008). In view of the advantages of EK (capable of removing contaminants from low permeable media) and PRB (ability of adsorbing/reducing/degradation contaminants within the barrier), this paper describes the effectiveness of the EK process coupled with permeable reactive barrier (EKPRB) in removing Cr(VI) from soil. Experiments were conducted under scale-up lab tests. The electrokinetic phenomena, Cr removal efficiency, and the preliminary economic analysis of this process were presented. The information presented herewith will assist in implementing this integrated electrochemical process at Cr(VI) contaminated sites.
2. MATERIALS AND METHODS 2.1 Soil Samlple
Chromium-free kaolinite was purchased from Associate Kaolin Ind. Co., Malaysia. Some basic properties of this kaolinite sample are summarized as follows: BET specific surface area 22.8 m2/g, average particle size 2.18 μm, cation exchange capacity (CEC) 15 cmol kg-1, organic matter content 0%, specific gravity 2.6 g/cm3, soil pH 3.75, and pHzpc 4.5. The artificially Cr(VI) contaminated soil was prepared by mixing an appropriate amount of dissolved K2Cr2O7 solution and 1:2 kaolinite/sand mixture. The soil mixture was continuously agitated for 1 d to allow the adsorption of Cr(VI) onto kaolinite. At end of mixing, a slurry sample was taken to analyze its Cr(VI) concentration. An average Cr(VI) concentration of 850 mg/kg in the dry soil was spiked. This concentration was applied to test the effectiveness of chromium removal by this scale-up coupled EKPBR process. The use of kaolinite as model matrix is because it has much lower CEC compared with other clay minerals and it does not contain the organic matter to avoid the possible reduction reaction during the EK experiments.
2.2 Design of EKPRB Experiments
To create a reactive zone for Cr(VI) reduction in the EKPRB process, the mixture of Fe0 aggregate and Ottawa sand (1:2 w/w) were used as filling material in the barrier. Commercial Fe0 aggregate (Connelly–GPM Inc. U.S.A.) with a particle size of US screen -8+50 mesh (0.3–2.36 mm) was stuffed in the barrier. This aggregate sample has an density of 240–2560 kg/m3 and consists of 89.82% Fe, 2.85% C, 1.85% Si, 0.132% P, 0.6% Mn, 0.107% S. The sand (Silica, Co., Ottawa, IL) which meets ASTMC778 classification was used. In the design of the barrier in the EKPRB process, the thickness of the barrier and the minimum requirement of Fe0 in the barrier are the two most important factors governing the effectiveness of this process. Enough Fe0 in the barrier will guarantee the Cr(VI) that is completely reduced to Cr(III) as it passes through the barrier. And, the
A3 A2 3 A1 3 B3 3 B2 33 C3 B3 3 B1 33 C2 3B 33 C1 3B 33 D1 C3 B3 3 D2 C3 B3 3 D3 C3 B3 3 6cm C3 B3 3 6cm C3 B3 3 6cm 6cm C3 B3 3 6cm 6cm C3 B3 3 2cm Fe-wall Filter Electrode Electrod e 1cm 6cm 1cm Cathode reservoir Anode reservoir 6cm 6cm 6cm 6cm C3 B3 3 6cm C3 B3 3 6cm C3 B3 3 6cm 6cm C3 B3 3 6cm 6cm 6cm 40cm
thickness of barrier allows sufficient reaction time for Cr(VI) reduction. The amount of Fe0 in the PRB was determined based on Cr(VI) and Fe0 reaction i.e.:
2Feo + Cr2O72- + 14H+ → 2Fe3+ + 2Cr3+ + 7H2O (1)
Feo + CrO42- + 8H+ → Fe3+ + Cr3+ + 4H2O (2)
Feo + HCrO4- + 7H+ → Fe3+ + Cr3+ + 4H2O (3)
Depending upon the Cr(VI) species involved in the reaction, reduction of one molar concentration of Cr(VI) required one or two molars of Fe0. To ensure all chromate species are completely reduced to Cr(III), an excess amount of Fe0 is needed. The minimum Fe0 requirement (WFe in kg) in the barrier can be estimated as follows:
WFe = [Cr(VI)]initial × Wsoil × MCr(VI)/MFe (4)
where [Cr(VI)]initial (mg/kg) is the initial concentration of Cr(VI) in soil, Wsoil (kg) is the mass of soil and MCr(VI)/MFe is the molar ratio of chromates and Fe0. By accounting only 90% of Fe content in the Fe0 aggregate sample with 10% impurities, the minimum requirement of Fe0 in the barrier to treat 25 kg of soil with a Cr(VI) concentration of 850 mg/kg was estimated as follows:
WFe=850mg/kg×25 kg-soil×1/52(mol/g)×56(g/mol)÷1000(g/mg)÷0.9= 25.4 g At least an amount of 25.4 g Fe0 have to be applied to provide enough Fe0 for Cr(VI) reduction. An amount of 70 g Fe0 used in wall should prove sufficient Fe0 for Cr(VI) reduction. Thickness of barrier, Tbarrier, can be calculated as follows:
Tbarrier = Keo × ie × tCr (5)
where Keo (cm2/V-s) is electroosmotic permeability; ie (V/cm) is the applied potential gradient to the soil matrix; tcr (sec) is the reaction time in the barrier for Cr(VI) to be completely reduced to Cr(III) by Fe0. The value of tCr is varied by the source of Fe0 and the experimental conditions conducted. Powell et al. [20] reported that the value of tCr was about 0.5 h for Fe0/sand filing. Weng et al. (2007). have shown that tCr value was 4 h for a 99% reduction at pH 3.5. Using Ke value 1.35×10⁻⁶ –1.73×10⁻⁶ cm2/V-s obtained in this study, the thickness of barrier becomes:
Tbarrier = 1.73×10⁻⁶ cm2/V-s- × 1 V/cm × 8 h × 3600 s/h ≈ 0.05 cm (6) A thickness of 2 cm was adapted for the reactive barrier which is far greater than the above calculated flow path, which would provide a sufficient time for Cr(VI) reduction as Cr(VI) ions pass through the barrier.
(a)
Figure 1: (a) Schematic diagram of pilot-scale electrokinetic test.(b) Schematic top view of divided sample of pilot-scale electrokinetic test
2.3 EKPRB Process Setups
Figure 1 shows a schematic diagram of the acrylic container used in the scale-up EKPRB test. The container has inner dimensions of 40 cm in length, 30 cm in height, and 24 cm in width and consists of three compartments: anode reservoir (6 cm length), soil specimen (28 cm length), and cathode reservoir (6 cm in length). An acrylic frame is placed in each compartment to hold the electrodes in position. The soil specimen was separated into two identical parts (Fig. 1). A 2-cm thickness of Fe-barrier was placed in the middle of the soil specimen. This configuration optimizes the reduction of Cr(VI) in the EK process with installation of Fe-barrier as described in the previous study (Weng et al. 2006). To ensure the soil equally distributed in the container, it was compacted layer by layer during the filling. At each layer, eight 10-kg weights were placed on the top of the soil layer for 3 h compaction. A total of five layers were compacted individually. When compaction of all soil layers was completed, granular Fe0 and sand with 1:1 w/w ratio was filled in the barrier. In the process setup, two rows of graphite rod electrodes (3 cm diameter and 30 cm length) were installed at each side of the compartments. Each row of electrodes consists of four graphite rods. The use of graphite as electrodes is due to they are chemically inert to electrolysis reaction, nontoxic to environment, and to avoid corrosion effects that could result in an additional chemicals introducing into reservoir and complicate the electrochemisty of the process. A direct current power supply capable of operation current 0–10 A and voltage 0–100 V, was used to provide a constant electric potential gradient of 1 V/cm for 14 or 20 d. Electrode compartments were filled with simulated groundwater to a level of 24 cm right on the clay surface level. The total volume of this processing fluid is 3130 mL. The constituents of simulated groundwater in terms of equivalent per liter are as follows: 4.76 Ca2+, 1.84 Mg2+, 1.12 Na+, 2.28 K+, 4.00 Cl-, 3.96 HCO3-, 2.04 NO3- with unit of meq/L, which were based on the data of groundwater-monitoring wells in Kaohsiung County, Taiwan. The pH of on the anode and cathode reservoirs was not controlled throughout the test. A total of four tests were conducted with soil mixture spiked with Cr(VI) concentration of 850 mg/kg. Table 1 lists the experimental conditions for the tests. Tests 1 and 3 were conducted without installation of Fe-barrier and were used for comparison purpose. In Test 2 or Test 4, the testing parameter was the same as Test 1 or Test 3 except that a Fe-barrier was installed at the middle of the soil container. All experiments were operated at an ambient temperature of 27 °C.
Table 1: Processing conditions in pilot-scale tests
Test (process) Initial soil Cr(VI) (mg/kg) Electric gradient (V/cm) Elasped time (day) Barrier Fe0/sand (g/g) 1 (EK) 850 1 14 0:0 2 (EKPRB) 837 1 14 70:140 3 (EK) 854 1 20 0:0 4 (EKPRB) 841 1 20 70:140
2.4 Sampling and Analytical Methods
During the EK operation, current density across the soil container, the amount of electro-osmotic (EO) flow collected in the reservoirs, the amounts of dissolved Fe(II)/Fe(III) and Cr(III)/Cr(VI) in the reservoirs, and reservoir pH values were monitored. At the end of the each test, electric power was terminated and the clay specimen was divided into three horizontal layers, the top layer, middle layer, and bottom layer. The sampling scheme is depicted in Fig. 2. Each layer has 8 cm thickness along the height. Each layer was then sliced into 4 segments of 6 cm length each along the length
and 3 segments of 8 cm each along the width. It comes up with a total of 36 segments of divided soil (Fig. 1b). Each soil segment represents a soil volume of 448 cm3. The same dividing procedure was used in Test 2 except that each segment along the length was 6.5 cm in length. As a result, each segment in Test 2 represents a soil volume of 416 cm3. Final analyses of soil pH, redox potential, residual Cr(III)/Cr(VI) in the soil of each divided segment were conducted.
Cr(VI) in the solution was analyzed by reaction with diphenylcarbohydrazide and then the absorbance of the purple product was measured at a wavelength of 540 nm with a spectrophotometer (HACH DR2010, USA). Cr(III) in the solution was measured by an atomic absorption spectrophotometer (Varian 200). The total Cr concentration in the soil was determined by wet extraction analysis. Soil samples were digested with concentrated HNO3 followed by the addition of concentrated H2SO4, HClO4, and HF at volume ratio of 1:2:5 for 1 h at 60–80°C (Weng et al. 1994). Cr(VI) in the soil was determined by alkaline digestion according to the method described in USEPA method: SW846-3060A. The soil sample was digested with 0.28 M NaCO3/0.5 M NaOH solutions and heated at 90-95°C for 1 h to dissolve the Cr(VI). The quantification of Cr(III) in the soil was determined by the difference between the total Cr and the Cr(VI). Fe(II) was analyzed by the 1,10-phenanthroline method at a wavelength of 510 nm. Total Fe was analyzed using HACH Ferrover iron reagent at 510 nm by the Ferrover method. Fe(III) was determined from the difference between the total Fe and Fe(II). The soil pH was measured in water suspension at a 1:1 soil to solution volume ratio with a pH meter.
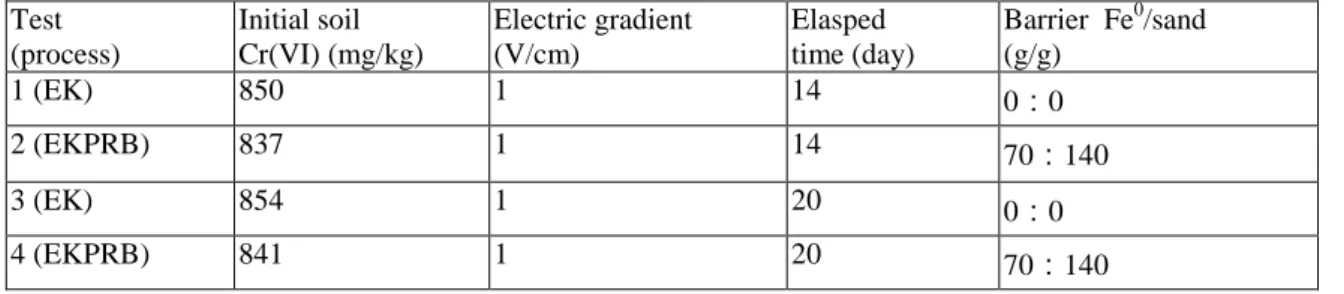
0 0.5 1 1.5 2 2.5 3 3.5 4 0 5 10 15 20 Test 1 (EK) Test 2 (EK/PRB) Test 3 (EK) Test 4 (EK/PRB) C u rr e n t d en si ty ( m A /c m 2)
Elasped time (days)
EK/PRB EK only 0 500 1000 1500 2000 2500 0 5 10 15 20 Test 1 (EK) Test 2 (EK/PRB) Test 3 (EK) Test 4 (EK/PRB) C u m u la ti v e Eo f low ( m L )
Processing time (days)
EK/PRB EK only
(a) (b)
Figure 2: (a)Current density and (b) cumulative Electro-osmostic flow versus processing time. 3. RESULTS AND DISCUSSION
3.1 Electric Current and electroosmotic Flow
In the present system, because the electric voltage was at a constant value of 1 V/cm, the electric current density was allowed to vary in time. Figure 2a shows the current densities of all tests initially increases to a peak value within the 1st d, and then it sharply decreases to a stable value. The initial increase in the current is mainly attributed to the high concentration of ions present in the soil pore fluid. Initially, the electrolysis of water taking place in the anode resulted in an extended low pH condition. When the acidic front moves towards cathode, more ionic species would be dissolved from the soil and present in the pore fluid. The higher the ionic concentration, the higher the current would be passing through the soil container. The sharp decrease of current with time reflects the total electric resistance across the soil cell increased markedly as a result of formation of precipitates at the cathode region. Formation of precipitates, such as Cr(OH)3(s), Fe(OH)3(s), CrxFe1-x(OH)3(s), Ca(OH)3(s), and Mg(OH)3(s) also cause significant increase in the energy
expenditure. Results show that the process with Fe-barrier exhibited a slightly low current density at the initial stage (within 5 d). Nevertheless, the variations generally follow the same trend.
The magnitude of the EO flow flux is generally associated to the ionic mobility of species and their relative concentration with respect to the electrolyte concentration, the applied electric gradient (Acar and Alshawabkeh 1996). Figure 2b shows the cumulative EO volume collected in the cathode reservoir, respectively. Normally as the solution pH is greater than the pHzpc of the soil (3.75), the EO flux induced by the cationic ions would towards anode. The EO flow direction for the Test is all from anode towards cathode. It is noted that a reversed EO flow may develop as long as the high ionic mobility of chromate ions overcome the EO flow (Weng et al., 2007). The same pattern of EO flow variations was observed for all tests. However, the test with barrier (Tests 2 and 4) shows a smaller EO flow than the test without the barrier (Tests 1 and 3). Apparently, installation of Fe-barrier in the EK system could render less EO flow. The EO permeability, Ke (cm2/V-s) can be calculated using the following equation:
Ke = Qe/(ieA) (7)
where Qe is electroosmotic flow (mL/d); ie is electric gradient applied across the soil cell (V/cm), hence ie is 1 V/cm; A is the cross-sectional area perpendicular to the direction of flow (cm2), hence A is 720 cm2. Base on Eq. 7, the average values of Ke for Tests 1 and 3 (EK only) are 2.48×10⁻⁶ and 2.07×10⁻⁶ cm2/V-s, respectively. A slightly low Ke value of 1.73×10⁻⁶ and 1.35×10⁻⁶ cm2/V-s over the entire period were determined for EKPRB process. The obtained Ke values are in agreement with the literature data of 1.010-7 to 410-5 cm2/V-s for relevant EK study using kaolinite as soil matrix (Weng et al. 2003, Acar et al. 1992, Sawada et al. 2004, Acar, and Alshawabkeh 1996, Hamed et al., 1991), and they are much greater than the typical hydraulic-induced flow in soils (Dzenitis 1997).
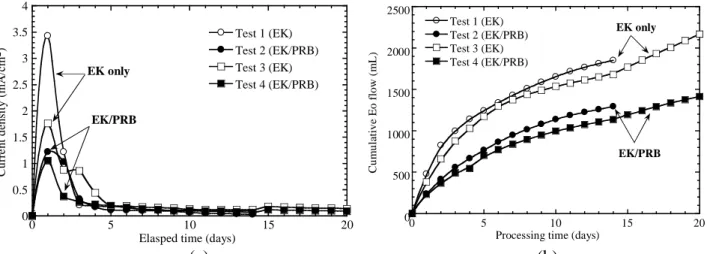
Figure 3: Soil pH contour profile for EKPRB process (Test 4). Dotted red line is the barrier. 3.2 Reservoir pH and Soil pH Profiles
Due to water electrolysis reaction took place in the reservoirs, the pH of anode fluid decreased rapidly from 7.8 to around 1.5-2.0 while the pH of the cathode fluid raised drastically to about 12-13 throughout the operation period for all tests. These marked changes of pH in the reservoir happened within 1 d. Changes in soil pH along the soil profiles after 14 or 21 d of processing
showed that the soil pHs in the vicinity of anode and cathode compartments are around 2.0-2.5 and 11.5-11.7, respectively, for all tests. It must note that the soil pH significantly varied in between the anode and the cathode while it did not change much along the width and the depth of the soil specimen. It was observed that the installation of barrier did not affect much on the changes of soil pH. The soil pH profile along the container is exemplified in Fig. 3 for Test 4. At the anode side of the soil, because of the H+ ion concentration differences between the reservoir and soil, that would lead the pH hardly increase. In addition to that, for the cationic induced EO flow, because the mobility of the H+ ion is higher than the OH- ion, acid-front migration occurred faster than base-front migration (Acar, and Alshawabkeh 1996). As a result of that a low pH was found near the anode region. The high pH occurred near the cathode is mainly attributed OH- ion generated in the cathode that migrated towards anode. Formation of alkaline zone caused a greatly increase in the current drop across the soil specimen. Noted that the alkaline pH condition being build up across the soil cell favors Cr(VI) desorption from soil.
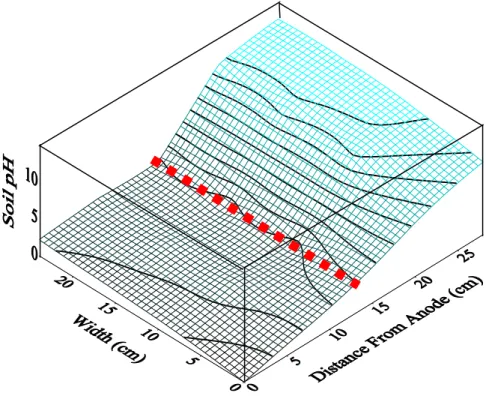
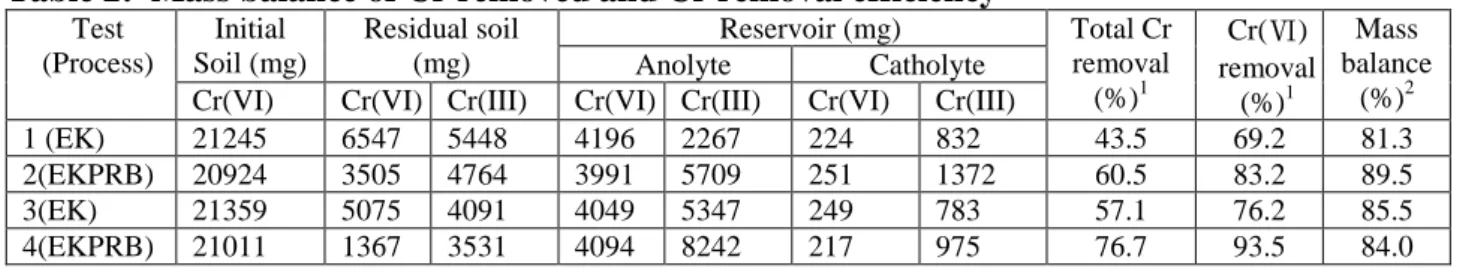
Figure 4: Redox potential contour profile for EKPRB process (Test 4). Dotted red line is the barrier.
3.3 Redox Potential
It is essential to measure the redox potential of the soil because it is a key variable affecting the reduction of Cr(VI). When the water electrolysis reaction takes place, it results in an oxidative environment in the anolyte and a reductive environment developed in the catholyte. Generally, when the potential is greater than 200 mV, the system can be considered as slightly oxidative environment, and when it is above 800 mV, it indicated highly oxidizing. On the other hand, as the redox potential of the system is below 200 mV it can be considered as slightly reductive environment. Upon the potential is below 100 mV, it indicated a highly reducing condition (Sposito 1989). Fig. 4 (Test 4) shows the results of the variations of redox potential the contour profiles along the soil container. It showsa slightly oxidative condition existed near of anode (redox potential at 265 -340 mV) while a highly reducing condition prevailed in the cathode side (negative redox potential) (-240 – -320 mV). A highly reductive environment is definitely beneficial for Cr(VI) reduction. Moreover, the high pH condition near the anode side of the soil will facilitate Cr(VI) desorption and formation of Cr(III) hydroxide precipitation. Redox potential variation for
other tests did not exhibit much differences comparing with Test 4.
3.4 Cr Migration and Removal
Table 2 shows both Cr(III) and Cr(VI) migration into electrode compartments (reservoirs) for all tests. The overall mass balance is below 100% (81.3–89.5%). The 10–20% difference may be attributed to the precipitation of chromium hydroxide in the catholyte which was not accounted in the mass balance calculation. Overall the mass balance in these two tests is high. In anolyte, the amount of Cr(VI) accumulated in in EKPRB process (Tests 2 and 4) is greater than the EK process (Tests 1 and 3), showing that the barrier could enhance the migration of Cr(VI) into anodic reservoir. Results show that a large portion of Cr migrated into anolyte with Cr(VI) of 3991–4196 mg and Cr(III) 2267–8242 mg. In the catholyte, however, the form of Cr was mainly presented as Cr(III) (783–1372 mg) with respect of a small amount of Cr(VI) (217–251 mg) in this region. It was expected that the soluble anionic Cr(VI) would travel towards the anode, while cationic Cr(III) would migrate to the cathode during the EK process. The appearance of Cr(VI) and Cr(III) in the electrode reservoir would also be attributed to the diffusion of soluble Cr caused by the concentration gradient near the reservoirs. The appearance of Cr(VI) in the cathlyte (Table 2) is due in part to the high pH conditions developing near the cathode of the soil specimen that favors for the Cr(VI) desorbed and directly diffused into the cathode reservoir. It appears that ionic migration is one of the important mechanisms involved in the removal of Cr in EK process. Once Cr(VI) resides in anodic reservoir, the slightly oxidative environment (> 300 mV) in the anode reservoir that created by electrolysis reaction would prevents Cr(VI) from reduction to Cr(III). Similar observation (Weng et al. 2004, Reddy and Chinthamreddy 2003, Sanjay et al. 2003) showing the migration of Cr(VI) into anodic reservoir has been documented. In the anolyte of EKPRB process (Test 4), a yellow color was observed and the Cr(VI) concentration was as high as 2.6010-2 mol/L in spite of the existence of Fe(II) (1.3710-2 mol/L) that could possibly provide a good reduction source for Cr(VI). Despite the Fe(II) in the anode reservoir remains high (9.3910-3 mol/L), an amount of 2.5410-2 mol/L Cr(VI) was also found in the EKPRB process of Test 2. Results indicated that the major chromate specie occurring in the anolyte would be Cr2O7
and HCrO4 -while the major specie in the catholyte is CrO42-. After EK treatment, only significant amount of soluble Fe(II) and Fe(III) were found in the reservoirs for Tests 2 and 4. The existence of both Fe(II) and Fe(III) was derived from the barrier filling, i.e., Fe0. A relatively low Fe concentration in the basic catholyte was found as they already precipitated in hydroxide forms. Since Fe(II) is the main electron donors in this process, the continuously Cr(VI) reduction in both anode and cathode reservoir would be likely to happen upon the termination of EK process.
Table 2: Mass balance of Cr removed and Cr removal efficiency
Test (Process) Initial Soil (mg) Residual soil (mg) Reservoir (mg) Total Cr removal (%)1 Cr(Ⅵ) removal (%)1 Mass balance (%)2 Anolyte Catholyte
Cr(VI) Cr(VI) Cr(III) Cr(VI) Cr(III) Cr(VI) Cr(III)
1 (EK) 21245 6547 5448 4196 2267 224 832 43.5 69.2 81.3 2(EKPRB) 20924 3505 4764 3991 5709 251 1372 60.5 83.2 89.5 3(EK) 21359 5075 4091 4049 5347 249 783 57.1 76.2 85.5 4(EKPRB) 21011 1367 3531 4094 8242 217 975 76.7 93.5 84.0 Note: 1. Removal (%) = (Initial soil Cr - Residual Cr in soil) ÷ Initial soil Cr × 100%.
2. Mass balance (%) = Total Cr in reservoir ÷ (Initial Cr in soil - Residual Cr in soil) × 100%.
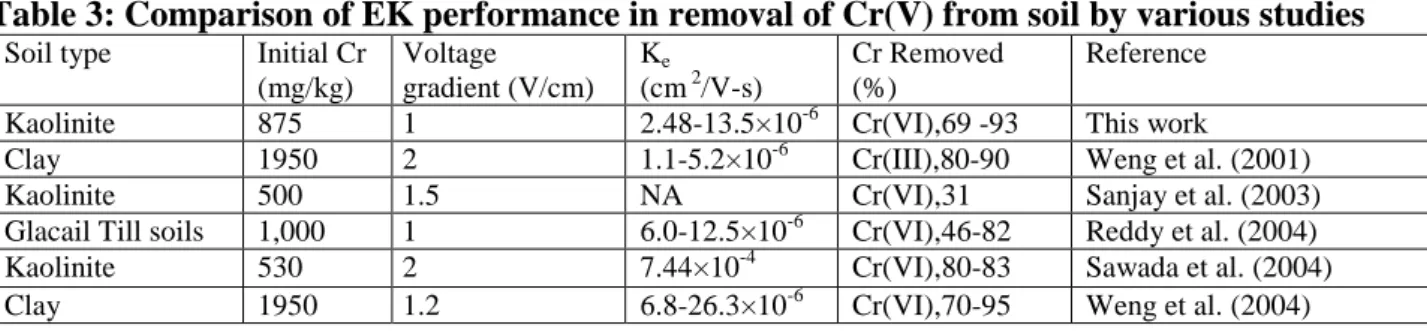
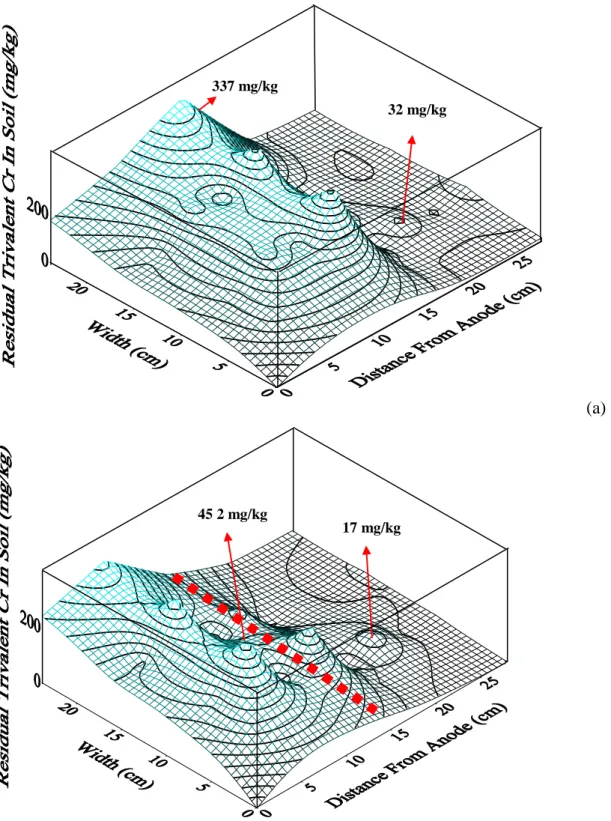
Upon termination of electric power, the soil specimen was removed from the container and separated into 36 segments. Each segment was analyzed its residual Cr(VI) and total Cr concentrations. Residual Cr(III) was determined by subtracting total Cr to Cr(VI). Figures 5 and 6 show the contour diagram across the soil container of residual Cr(VI) and Cr(III) for EK (Test 3) and EKPRB process (Test 4), respectively. Due to the space limit for this manuscript, the contours
of Cr distribution for Tests 1 and 2 are not presented herewith. The results of all the tests performed showed a reduction of Cr(VI) to Cr(III) throughout the entire specimen. As shown, the major form of Cr remaining in soil was Cr(III), and the minor was Cr(VI). Clearly, the original form of Cr(VI) in soil has been converted to less toxic Cr(III) after electrokinetic treatment. Under acidic condition, Cr(VI) can be rapidly reduced to Cr(III) by both Fe(II) and/or organic matter (James 2001, Weng et al. 1996, He et al. 2004). Almost no Cr was found near the cathode side of the soil. The appearance of Cr(III) in both Tests showed the reduction of Cr(VI) to Cr(III) throughout the entire soil specimen. Clearly, the original form of Cr(VI) in soil has been converted to less toxic Cr(III) after electrokinetic treatment. Despite the soil without contained available reductive sources such as Fe(II) and/or organic matter, the occurrence of Cr(VI) reduction was evidenced. Similar results have found in other relevant studies (Sawada et al. 2004, Sanjay et al. 2003). It can be realized that a reducing environment developed along the soil which favored for Cr(VI) reduction. Unlike high Cr(VI) concentration still found in the soil after EK treatment (Fig. 5a), a sharply decreases in residual Cr(VI) concentration was found in the EKPRB process (Fig. 5b). This phenomenon is attributed to the function of Fe-barrier. Under acidic condition, Cr(VI) can be rapidly reduced to Cr(III) by both Fe(0) and Fe(II).
The total Cr and Cr(VI) removal efficiencies after EK and EKPRB treatment are listed in Table 2. Results in Test 1 shows that the EK process could reduced Cr(VI) from 850 to 262 mg/kg after a 14-d of 1 V/cm treatment. As prolonging the EK process to 20-d (Test 3), the residual Cr(VI) in soil decreased further to 203 mg/kg for the same treatment procedure. The corresponding total Cr removal efficiency rose from 43.5 to 57.1%, respectively, for Tests 1 and 3. While an extend of treatment time was able to increase the removal efficiency for both Cr(VI) and total Cr, the results revealed that installation of Fe-barrier in EK process did enhance the total Cr removal. Results in Test 2 shows that the EKPRB process could reduced Cr(VI) from 837 to 140 mg/kg for a 14-d treatment period. Extending the treatment period to 20-d with this EKPRB process, the Cr(VI) in soil was further reduced to only 54 mg/kg. The corresponding Cr(VI) removal efficiencies for process are 60.5% and 93.5%, respectively, after 14-d and 20 d EKPRB treatment. Albeit the total removal efficiency of Cr(VI) for all tests is promissing, residual Cr(III) concentration in the soil between middle and anode side of the container remains high (Fig. 6). As seen in Fig. 6, EKPRB treatment could render soil containing less Cr(III) than that of the treatment by EK only. A comparison of the EK performance in removal of Cr(V) from soil with other relevant bench-scale studies is given in Table 3. The Cr(VI) removal efficiency is slightly higher than those of the same kaolinite and other minerals studies. Based on the findings described above, electromigration and electroosmotic advection are the two dominant transport mechanisms responsible for the removal of Cr from clay. It can be realized that redox and adsorption/desorption reactions were active during the transport of Cr in the EK operation. Installation of barrier in the EK process can drastically enhance Cr(VI) reduction. In Tests 1–4, results indicated that the average total residual Cr in soil decreased to 480, 331, 337, and 195 mg/kg, respectively. In Taiwan, the current soil control standard of cleanup criteria under Soil and Groundwater Remediation Act for total Cr is 250 mg/kg. Results of Test 4 (EKPRB) showed that the average residual total Cr in soil is below this level, indicating the applicability of this coupled EKPRB process.
Table 3: Comparison of EK performance in removal of Cr(V) from soil by various studies
Soil type Initial Cr (mg/kg) Voltage gradient (V/cm) Ke (cm 2/V-s) Cr Removed (%) Reference Kaolinite 875 1 2.48-13.5×10⁻⁶ Cr(VI),69 -93 This work
Clay 1950 2 1.1-5.2×10⁻⁶ Cr(III),80-90 Weng et al. (2001) Kaolinite 500 1.5 NA Cr(VI),31 Sanjay et al. (2003) Glacail Till soils 1,000 1 6.0-12.5×10⁻⁶ Cr(VI),46-82 Reddy et al. (2004) Kaolinite 530 2 7.44×10⁻⁴ Cr(VI),80-83 Sawada et al. (2004) Clay 1950 1.2 6.8-26.3×10⁻⁶ Cr(VI),70-95 Weng et al. (2004)
Sand and clay 890-1464 2.3 1.1×10⁻⁶ Cr(VI),16-60 Wieczorek et al. (2005) Kaolinite 233 1 NA Cr(VI),50-52 Jing et al.(2006) Clay 2,497 2 0.5-1.0 ×10⁻⁵ Cr(VI), 92.5 Weng et al. (2007) Note:NA means not available
(a)
(b)
Figure 5: Residual Cr(VI) contour profile in soil after (a)EK (Test 3) and (b)EKPRB treatment (Test 4). Dotted red line is the barrier.
479 mg/kg
1 mg/kg mg/kg 106 mg/kg
(a)
(b)
Figure 6: Residual Cr(III) contour profile in soil after (a)EK (Test 3) and (b)EKPRB treatment (Test 4). Dotted red line is the barrier.
3.5 Cost Analysis
In the present pilot-scale operation we account only the cumulative energy, graphite electrode, and Fe0 material fees for the total costs. Table 4 shows the economic analysis of this process. Note that this analysis was preliminary. Other cost may involve in the field operation including design of the process, construction of Fe-barrier fees, maintenances, and process operation fees. Energy expenditure per m3 of soil treated, Eu (Wh/ton), was calculated as follows:
337 mg/kg
32 mg/kg
45 2 mg/kg
VIdt V 1 V P E s s u (8)where Eu = energy expenditure (Wh); Vs= soil volume (m3), V= the applied voltage (V), I = the current (A), t = processing time (h). The energy consumption as determined from Eq. 8 is shown in Table 4. The values of energy expenditure were 254, 112, 224, and 155 kWh/ton for Test 1, 2, 3 and 4, respectively, which equivalent to the energy cost of about 10.6–20.3 USD/m based on the current electricity fee in Taiwan. Results indicate that EKPRB process consumed much less electricity than that of EK process under identical experimental condition. Based on the unit price of Fe0 (500 USD/ton) and 140 g of Fe(0) used in the test, the cost of granular Fe0 per cubic meter of soil treated is only about 4.4 USD/m3. As indicated in Table 4, the total cost for the EKPRB process (47.0–48.8 USD/m3), which excludes the installation fee of an iron barrier is a little bit less than the EK process (50.8–52.3 USD/m3). It is concluded that the extra cost for the Fe0 fee is insignificant but the benefit of removing Cr(VI) is prominent.
Table 4: Cr removal efficiency and economic analysis for EK remediation
Test (Process) Energy expenditure (kWh m-3) Energy cost1 (USD m-3) Electrode2 (USD m-3) Fe(0) cost3 (USD m-3) Total cost4 (USD m-3) 1 (EK) 254 20.3 32 0 52.3 2 (EKPRB) 112 10.6 32 4.4 47.0 3 (EK) 224 18.8 32 0 50.8 4 (EKPRB) 155 12.4 32 4.4 48.8
Note: 1.The current electricity fee in Taiwan is approximately 0.08 USD/kWh. 2.Electrode cost = 4 USD/piece × 8 piece = 32 USD/m3.
3.Fe(0) cost = 500 USD/ton × 140 g × 10-6 ton/g ÷ (16128 cm3 × 10-6 m3/cm3) = 4.4 USD
4. CONCLUSIONS
This paper describes the effectiveness of the EK process coupled with permeable reactive barrier to treat Cr(VI) laden soil (850 mg/kg) based on the results of four large lab scale tests. Results showed that installation of Fe-barrier in the EK system rendered less EO flow and caused a slightly lower electro-permeability than the process without Fe-barrier. The removal of Cr from clay was characterized by the high concentration of Cr(VI) and Cr(III) occurred in the anolyte and Cr(III) precipitates in the catholyte. The EK treatment with Fe-barrier has rendered Cr(VI) to less toxic form of Cr(III). Removal of Cr(VI) from soil by EK process was enhanced with installation of Fe-barrier. The Cr(VI) reduction efficiencies for the process without Fe0 barrier were 69.2 and 76.2%, respectively, for the 14 and 20 d operation. Once the barrier was installed, the corresponding reduction efficiencies increased up to 83.2 and 93.5%. When the EKPRB process operated for 20 d with 1 V/cm, result showed that the average residual total Cr in soil was below current Taiwan Soil and Groundwater Remediation Act cleanup criteria (250 mg/kg), indicating the applicability of this coupled EKPRB process. Findings revealed that the electroosmotic advection and electromigration are the dominant transport mechanisms responsible for the removal of Cr from clay. It is suggested that redox and adsorption/desorption reactions were active during the transport of Cr in the EKPRB operation. The total costs for EKPRB accounted only the energy expenditure, electrode, and Fe0 being used are only 47.0–48.8 USD/m3, which is even less than the EK process. It is concluded that the extra cost for the Fe(0) fee is insignificant but the benefit of removing Cr(VI) is prominent. The information presented herewith will assist in implementing this integrated electrochemical process at Cr(VI) contaminated sites.
5. ACKNOWLEDGMENTS
The authors are highly thankful to the National Science Council of Republic of China (Grand No. NSC93-2211-E-214-005) for the financial support. The authors also thank Stephen M. Klein, President of Connelly-GPM, Inc., for providing the Fe0 samples.
6. REFERENCES
Acar Y.B., Li H.Y., Gale R.J. (1992) Phenol removal from kaolinite by electrokinetics. J. Geotech. Eng
118(11), 1837–1852.
Acar Y.B., Alshawabkeh A.N. (1996) Electrokinetic remediation. 1. Pilot-scale tests with lead-spiked kaolinite. J. Geotech. Eng. 122(3), 173–185.
Alshawabkeh A.N., Yeung A.T., Bricka M.R. (1999). Practical aspects of in-situ electrokinetic extraction. J.
Environ. Eng. 125(1), 27–35.
Blowes D.W., Ptacek C.J., Benner S.G., McRae C.W.T., Bennett T.A., Puls R.W. (2000) Treatment of inorganic contaminants using permeable reactive barriers. J. Contaminant Hydrology 45,123–137. Dzenitis J.M. (1997) Soil chemistry effects and flow prediction in electroremediation of soil. Environ. Sci.
Technol. 31(4), 1191–1197.
Ebert M., Kober R., Parbs A., Plagentz V., Schafer D., Dahmke A. (2006) Assessing Degradation rates of chlorinated ethylenes in column experiments with commercial iron materials used in permeable reactive barriers. Environ. Sci. Technol. 40, 2004–2010.
He Y.T., Traina S.J. (2005) Cr(VI) reduction and immobilization by magnetite under alkaline pH conditions: The role of passivation. Environ. Sci. Technol. 39(12) 4499–4504.
He T.Y., Chen C.C., Traina S.J. (2004) Inhibited Cr(VI) reduction by aqueous Fe(II) under hyperalkaline conditions. Environ. Sci. Technol. 38(21), 5535–5539.
James B. (2001) Remediation-by-reduction strategies for chromate contaminated soils. Environ. Geochem.
Health 23(3), 175–179.
James B. (2001) Remediation-by-reduction strategies for chromate contaminated soils. Environ. Geochem. Health 23(3), 175–179.
Lai K.C.K., Lo I.C. (2008) Removal of chromium (VI) by acid-washed zero-valent iron under various groundwater geochemistry Conditions. Environ. Sci. Technol. 42,1238–1244
Phillips D.H., Gu B., Watson D.B., Roh Y., Liang L., Lee S.Y. (2000) Performance evaluation of a zerovalent iron reactive barrier: Mineralogical characteristics. Environ. Sci. Technol. 34, 4169–4176. Reddy K. R., Chinthamreddy S. (2003) Effects of initial form of chromium on electrokinetic remediation in
clays. Adv. Environ. Res. 7, 353–365.
Reddy K.R., Chinthamreddy S. (2004) Enhanced electrochemical remediation of heavy metals in Glacial Till soils using different electrolyte solutions. J. Environ. Eng. 130(4), 442-455.
Sawada A., Mori K., Tanaka S., Fukushima M., Tatsumi K. (2004) Removal of Cr(VI) from contaminated soil by electrokinetic remediation. Waste Manage. 24(5), 483-490.
Sanjay K., Arora A., Shekhar R., Das R.P. (2003) Electroremediation of Cr(VI) contaminated soils: kinetics and energy efficiency. Colloid. Surface. A. 222(1-3), 253-259.
Smith W.L. (2001) Hexavalent chromium reduction and precipitation by sulphate-reducing bacterial biofilms,
Environ. Geochem. Health 23(3), 297–300.
Sposito G. (1989) Chemistry of Soils, Oxford University Press, New York.
Stepniewska Z., Bucior K. (2001) Chromium contamination of soils, waters, and plants in the vicinity of a tannery water lagoon. Environ. Geochem. Health 23(3), 241–245.
Weng C.H., Huang C.P., Allen H.E., Leavins P., Sanders P.F. (1996) Chemical interactions between Cr(VI) and hydrous concrete particles. Environ. Sci. Technol. 30(2), 371–376.
Weng C.H., Yuan C., Tu H.H. (2003) Removal of trichloroethylene from clay soil by a series electrokinetic process. Pract. Period. Hazard. Toxic, Radioact. Waste Manage. 7(1), 25–30.
Weng C.H., Yuan C. (2001) Removal of Cr(III) from clay soils by electrokinetics. Environ. Geochem.
Health 23(3),281–285.
Weng C.H., Huang C.P. (2004) Preliminary study on treatment of soil enriched in COPR by electrokinetics.
Pract. Period. Hazard. Toxic Radioact. Waste Manage. 8(2),67–72.
Wieczorek S., Weigand H., Schmid M., Marb C. (2005) Electrokinetic remediation of an electroplating site: Design and scale-up for an in-situ application in the unsaturated zone. Eng. Geology. 77,203–215.
Wilkin R.T., Su C., Ford R.G., Paul C.J. (2005) Chromium removal processes during groundwater remediation by a zero valent iron permeable reactive barrier. Environ. Sci. Technol. 39(12), 4599–4605. Yang G.C.C., Liu C.Y. (2001) Remediation of TCE contaminated soil by in situ EK-Fenton process. J.
Hazardous Mat. B85, 317–3331.
Yuan C., Weng C.H. (2004) Remediating ethylbene–contaminated clayey soil by a surfactant aided electrokinetic (SAEK) process. Chemosphere 57(3), 225–232.