A dynamic analytic approach to national innovation systems:
The IC industry in Taiwan
夽
Ting-Lin Lee
a,∗∗, Nick von Tunzelmann
b,∗aDepartment of Asia-Pacific Industrial and Business Management, National University of Kaohsiung, Taiwan bSPRU, Sussex University, UK
Received 1 August 2003; accepted 1 January 2005 Available online 19 March 2005
Abstract
The paper attempts to develop a mathematical model of the national innovation system (NIS) of Taiwan, particularly with regard to its integrated circuit (IC) industry. The method utilised is that of system dynamics (SD). Drawing on both questionnaire/in-depth interviews and computer simulation, the paper aims to increase insights into the dynamic processes of the Taiwanese IC industry system of innovation and understand the interdependence and interaction among capital flows, human resource flows, knowledge and technology flows, and product flows in the NIS. The paper concludes with some simulations of policy alternatives confronting the IC industry and the Taiwanese government.
© 2005 Elsevier B.V. All rights reserved.
Keywords: NIS (national innovation system); IC (integrated circuit); SD (system dynamics); Policy simulation
1. Introduction
Over the past 15 years, scholars in the field of in-novation studies have found it most useful to compare innovation in different countries using the concept of
夽An earlier version of this paper has been presented at an
inter-national conference on Applied Modelling and Simulation (AMS), Massachusetts, USA, November 4–6, 2002.
∗Corresponding author. Tel.: +44 1273 678169; fax: +44 1273 685865.
∗∗Co-corresponding author. Tel.: +886 7 5919246; fax: +886 7 5919430.
E-mail addresses: linda [email protected] (T.-L. Lee), [email protected] (N. von Tunzelmann).
innovation systems, especially the ‘national innovation system’ (NIS), though also sectoral and other innova-tion systems (Edquist, 1997; Fagerberg et al., 2004). The focus on the NIS has come about because, al-though the various industrial countries tend to have similar institutions for developing innovations, e.g. cor-porate laboratories, public research institutes, private R&D contract firms, and universities, they differ sub-stantially in how these institutions interact to pursue the innovation process; in other words, in the struc-ture of the underlying ‘system’. Other scholars have drawn attention to the similarity of innovation patterns in particular industries, especially high-tech industries, across countries, and therefore drew the conclusion that
0048-7333/$ – see front matter © 2005 Elsevier B.V. All rights reserved. doi:10.1016/j.respol.2005.01.009
country differences rested (at least in part) on sectoral mixes (Malerba, 2004).
In this paper we shall focus on a particular indus-try, the integrated circuit (IC) indusindus-try, in a particu-lar country, Taiwan, and thus a hybrid of national and sectoral systems. AsMathews (1997)pointed out, the growth and development of Taiwan’s semiconductor industry can be viewed as an institutional framework or dynamic structure. However the sector in question is often seen as emblematic of its country’s catching-up process, so we will draw most inspiration from the NIS approach. Various definitions and models of an NIS have been proposed from different points of view. In some approaches the focus is narrowly on the tech-nology system, in others it extends to the interaction with the industrial system more broadly. Although it is widely agreed that the NIS is ‘systemic’, no scholar to date has attempted to define the quantitative character-istics of such a system, which is our intention here.
One objective of this research is to increase our in-sight into the dynamics of national systems of innova-tion by means of computer modelling and formulating conceptual issues. Our study is exploratory in these dimensions and can be seen as an area for future re-search. A related objective is to create policy scenarios to verify the behaviour of the institutions under investi-gation by simulation, and to assess possible outcomes in those varying scenarios. The research shows that it is indeed feasible and fruitful to apply systems dynam-ics (SD) approaches to analysing national systems of innovation.
The paper also has empirical objectives. By means of questionnaire/in-depth interviews and SD model simulation, and through cross-comparisons between them, this research aims to increase our insight into the dynamic processes of the Taiwanese IC industry’s system of innovation and our understanding of the in-terdependence and interaction among capital flows, hu-man resource flows, knowledge and technology flows and product flows in the NIS. In addition, a compar-ison of innovation commercialization in Taiwan’s IC industry under the different policy tests and scenario tests is undertaken. These simulations show that single policies are relatively ineffective and that innovation performance requires combining a range of policies and capabilities. Although the work could be further developed with enlarged resources and funding, this approach could constitute a basis for policy-making in
science and technology policy that would give Taiwan a head-start in terms of reliable assessments of alterna-tive policy strategies. This is the major new practical contribution of this research.
2. System models of technological and industry performance
The ‘national innovation system’ assumes that the ‘nation’ is the appropriate boundary to draw in describing innovation systems, although other bound-aries have also been suggested (e.g. international or local innovation systems). One reason is the fact that there are various differences in institutional set-ups, investments in R&D (e.g. competencies in production and research, institutions of corporate governance), and performance between various national systems. Another reason is that most public policies (e.g. market incentives and pressures) influencing the innovation system or the economy as a whole are designed and implemented at the national level (McKelvey, 1991).
AsLundvall (1992)emphasised, the NIS represents “. . . a system of innovations constituted by elements and relationships. . . the national system of innovation is a social system. . .. It is also a dynamic system, characterised both by positive feedback and by reproduction. . .. Cumulative causation, and virtuous and vicious circles, are characteristics of systems and sub-systems of innovation”. The very complex pro-cesses involved translate the emergence and diffusion of knowledge into new products, for which production has to be carried out. Moreover, this translation by no means follows a ‘linear’ path; instead, it is charac-terised by complicated feedback mechanisms and in-teractive relations involving science, technology, learn-ing, production, policy, and demand. These relations are often characterised by reciprocity, interactivity, and feedback mechanisms in several loops. They are clearly not characterised by unilateral and linear causal rela-tionships (OECD, 1997; Edquist, 1997; Mowery and
Ziedonis, 1998).
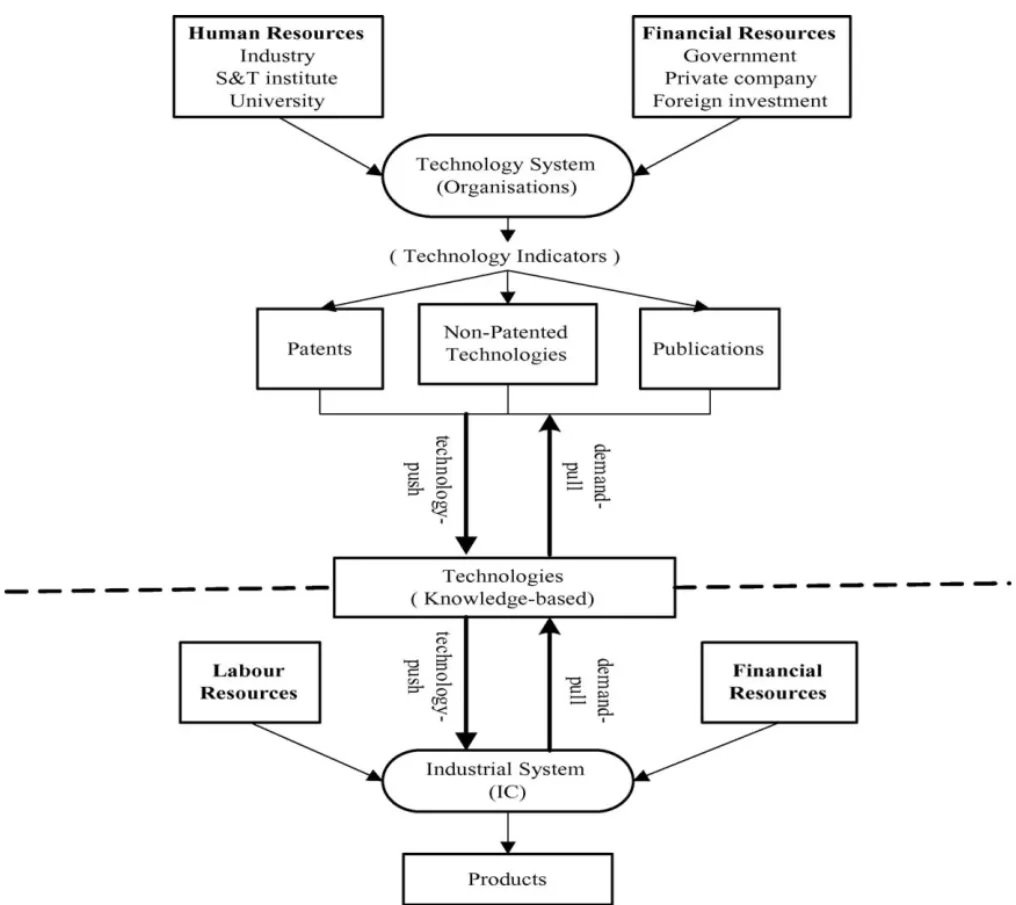
The present approach incorporates two highly inter-active sub-systems, one to be referred to as the ‘nological system’, responsible for producing the tech-nological outputs required for production to be carried out, and the other the ‘industrial system’, responsible for the translation of those technologies into product
Fig. 1. The technology and industry systems.
outputs (seeFig. 1). The national innovation system in the narrow sense involves just the first of these sub-systems, but many studies such as those by Lundvall also deal with the mutual interaction between the tech-nological sub-system and the industrial sub-system. This distinction is somewhat blurred in many of the models of the NIS. It will later be found to be important in understanding the system of innovation in Taiwan.
Very roughly, it can be asserted that the NIS models of Freeman (1987),Lundvall (1992),Nelson (1993),
Patel and Pavitt (1994),Metcalfe (1995)and theOECD (1997) can be regarded as primarily concerned with
the technological sub-system, and thus the upper part ofFig. 1. There are differences of detail among these models in terms of the elements stressed and the in-terlinkages drawn (Lee, 2003), but for the present we adopt a synthetic approach and consider them jointly. More consideration has to be given to the models of the industrial sub-system in the lower part ofFig. 1, because the ways these are linked to the upper part vary substantially, and because they are critical to our empirical analysis of the IC industry.
The central actors inVanichseni’s model (1998)of national innovation systems are firms, while the other
three actors are the government, universities/research organisations and consumers. The ‘firm’ determinant is pivotal and interacts with other three main elements of its environment on the technology side, i.e. govern-ment, research institutions and universities, which also interact with one another, thus forming another ‘dia-mond’ with firms as the common linkage. Government plays a key role relating to all three types of organisa-tion, depending on its policy instruments, funding and procurement. The other two crucial determinants are legal and financial systems and macro-economic pol-icy. Both the legal and financial system and macroeco-nomic policy link the government with firms and mar-kets, and thus build up interactions and relationships between these determinants. As the most comprehen-sive synthesis that can be applied to understanding the NIS, this will be the background against which our own system dynamics model is structured. However, the fac-tors relating to government (such as macro-economic policy and legal and financial systems) are here taken to be exogenous in order not to over-complicate the model, and also to permit policy simulations.
3. Taiwan’s technological and industrial systems
Compared to other industries in Taiwan, the IC in-dustry has a history of only around 30 years since the first semiconductor laboratory was built in National Chiao-Tung University, and a 20-year history since the first firm was spun off from ITRI. From the industry life-cycle aspect, the IC industry in the past decade has still been growing and performing conspicuously well in the world arena. Facing a highly uncertain en-vironment, the IC industry’s growth may well attain an inflection point in the next 10 years: it might continue to grow, stagnate, decline or experience oscillations. For this reason, the paper will draw on statistical and other data to simulate potential future policy impacts.
3.1. Taiwan’s technological system
In terms of S&T indicators, Taiwan is rich in human resources. The number of researchers per head up to 2000 is shown inTable 1.
According to the annual Survey of National Science and Technology Activity, total public and private R&D
Table 1
Numbers of researchers in Taiwan, 1998/2000
1998 1999 2000 Numbers of researchers (persons) 83209 87454 87394 Researchers/R&D manpower (%) 64.4 64.9 63.5
Number of researchers (per-sons) per 10,000 popula-tion
38.0 39.7 39.3
Number of researchers (per-sons) per 10,000 in the labour force
87.1 90.4 88.5
Data source: Indicators of Science and Technology, Republic of China, 2001.
expenditures amounted to NT$28.7 billion, or 1.04% of GNP in 1986, and NT$197.7 billion, or 2.02% of GNP in 2000, a more than six-fold increase in the 15 years. However, the growth rate of R&D expenditures declined sharply in 2000. Recent growth of the gov-ernment’s R&D budget has been very limited, but pri-vate sector R&D expenditures have continued to grow rapidly. Furthermore, the nation’s total R&D spending as a proportion of GDP remained at an average around 1.8% from 1996 to 2000 (Table 2).
The number of academic papers published is a di-rect indicator of basic research. The number of Tai-wanese papers cited in the SCI database has increased every year (seeTable 3). In 2000, there were 9203 ar-ticles cited by Taiwan’s authors in the SCI database, ranking 19th in the world. In terms of number of arti-cles cited, Taiwan has steadily remained 19th in recent years. There were 4878 papers by Taiwan’s authors in the EI database in 2000, ranking 10th in the world.
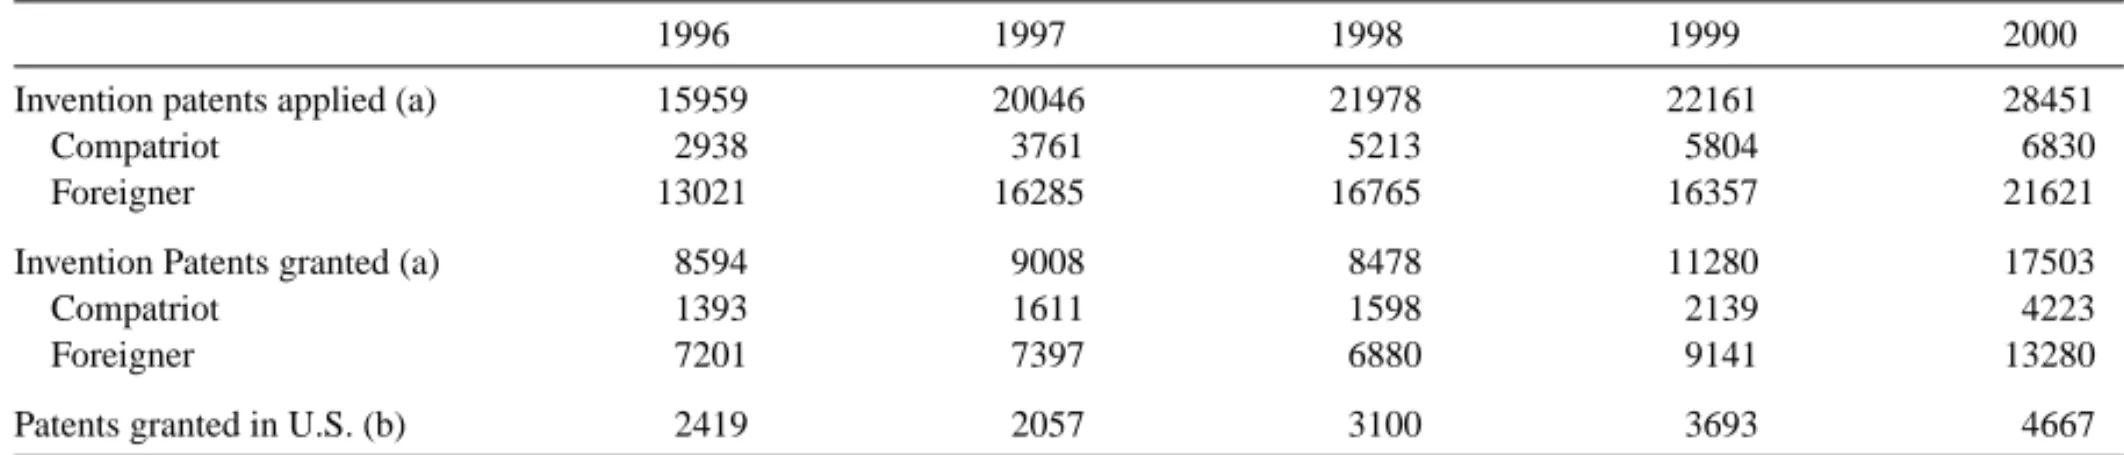
As for patents, there were 28,451 invention patent applications, of which 17,503 were approved (Table 4). It is evident that, whether looking at the invention patents applied for or approved, the number of com-patriot invention patents was very significantly lower than foreign. This presents a limited capability in inven-tion with domestic manpower. The number of patents granted in the US to assignees in Taiwan has however increased rapidly.
3.2. Taiwan’s industrial system
The IC industries in Taiwan have been fortunate be-cause Taiwan’s GDP has experienced dramatic growth
Table 2
Taiwan’s R&D Expenditures, 1996/2000
1996 1997 1998 1999 2000
R&D expenditures (in NT$100 million)a 1380 1563 1765 1905 1976
Growth rate (%) 10.3 13.3 12.9 8.0 3.7
R&D expenditures as percentage of GDPb 1.80 1.88 1.97 2.05 2.05
R&D expenditures as percentage of GNP 1.77 1.86 1.96 2.03 2.02
Government expenditures (NT$100m) 574 628 676 721 742
Percentage 41.6 40.2 38.3 37.9 37.5
Data source: Indicators of Science and Technology, Republic of China, 2001.
a Including humanities and social sciences; national defence S&T excluded; and including government planning and supporting expenditures
on R&D.
b GDP-national income in Taiwan area of Republic of China, Directorate-General of Budget, Accounting and Statistics, Executive Yuan.
Table 3
The number of Taiwan-based papers and rank in SCI and EI
1996 1997 1998 1999 2000
Number Rank Number Rank Number Rank Number Rank Number Rank
Papers in SCI 7490 18 7755 19 8605 19 8944 19 9203 19
Papers in EI 4220 11 4839 11 4026 9 4690 11 4878 10
Data source: National Science Indicators on Diskette, 2001, ISI Col., U.S.A.COMPENDEX, Oct. 2001, E.I. Inc., USA.
for an extended period of time. The electronic indus-try’s share of manufacturing output rose from 15.9% in 1990 to 32.8% in 2000. By 2001, Taiwan had become the fourth largest IC producer and the sec-ond largest IC designer in the world. Taiwan was the first country to set up chip foundry operations, and its share in the world market amounted to 72.9% in 2001.
Taiwan’s semiconductor industry has a unique ver-tically disintegrated structure. This vertical disintegra-tion is undoubtedly advantageous to the development of a dedicated foundry industry since it effectively low-ers the production costs and shortens production cycles. This structure has successfully rooted its core
compe-tence in the semiconductor business with a strong arm in fabrication, and has fostered a prosperous IC design business at the same time. The uniqueness of the struc-ture and its elements justifies taking a national rather than sectoral approach in this paper.
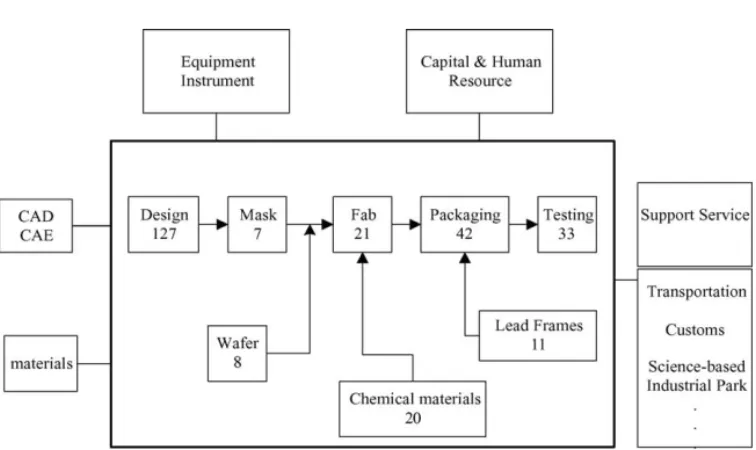
Fig. 2illustrates four major segments, namely de-sign, fabrication, packaging and testing, and supporting industries such as masks, wafers, chemical materials, and lead frames. Statistical data for 2000 show that a total of 241 companies operate in the four major areas of the Taiwan semiconductor industry, among which there are 140 design houses, 16 fabrication compa-nies, 48 packaging vendors, and 37 testing companies (ERSO/ITRI Website, 2001).
Table 4
Patenting 1996–2000
1996 1997 1998 1999 2000
Invention patents applied (a) 15959 20046 21978 22161 28451
Compatriot 2938 3761 5213 5804 6830
Foreigner 13021 16285 16765 16357 21621
Invention Patents granted (a) 8594 9008 8478 11280 17503
Compatriot 1393 1611 1598 2139 4223
Foreigner 7201 7397 6880 9141 13280
Patents granted in U.S. (b) 2419 2057 3100 3693 4667
Fig. 2. Disintegrated structure of IC companies in Taiwan. Note: figures represent numbers of companies ca. 2000 (data incomplete).
In terms of IC products, Taiwan’s semiconductor in-dustry generated NT$2872m product revenue in 2000, representing a growth of 44.5% (seeTable 5). In 1999, 9.3% of the R&D expenditure as a percentage of sales was for design, compared with 5.3% for fabrication, 1.9% for packaging and 2.6% for testing. More detailed data at the industry branch level are provided inTable 6.
4. Brief description of system dynamics
System dynamics originated in the late 1950s and early 1960s and was pioneered by J.W. Forrester of the
Massachusetts Institute of Technology. The system dy-namics philosophy rests on a belief that the behaviour (or time history) of an organization is principally caused by the organization’s structure. A second as-pect of this philosophy is the concept that organizations are viewed most effectively in terms of their common underlying flows instead of in terms of separate func-tions (Roberts, 1978). The four constituents of system dynamics are explained as follows (Forrester, 1976): (a) The closed boundary. This focuses interest on
sys-tems as the cause of dynamic behaviour. Emphasis is on interactions within the system that produce
Table 5
Revenues of the Taiwan IC industry, 1998/2000, by branch, NT$100 million
1998 1999 1999/1998 2000 2000/1999 Industry revenue 2834 4235 49.4% 7144 68.7% IC design 469 742 58.2% 1152 55.3% IC fabrication 1694 2649 56.4% 4686 76.9% Foundry 938 1404 49.7% 2966 110.8% IC packaging 540 659 22.0% 978 48.4%
Domestic owned packaging 420 549 30.7% 838 52.6%
IC Testing 131 185 41.2% 328 77.3%
Product revenue 1225 1987 62.2% 2872 44.5%
% of domestic sales 49.7 54.7 – 53.9 –
IC market revenue 2744 3457 26.0% 5065 46.5%
Note: industry revenue = design + fab + packaging + testing, product revenue = design + fab− foundry, 1999 exchange rate: 1US$ = 31.4 NT$; 2000: 1US$ = 32.99NT$, data source: Yearbook of the Semiconductor Industry, 2000, ITRI/IT IS.
Table 6
Economic indicators of IC branches in Taiwan, 1999/2000
Design Fabrication Packaging Testing
1999 2000 1999 2000 1999 2000 1999 2000
% of exports 38.0 40.8 50.1 59.7 49.6 52.1 38.9 39.6
No. of employees (people) 6000 7600 32000 43600 27000 30000 7389 12800
Engineers 543 632 10233 13072 3034 5067 1525 2228
Production line operators 597 429 13517 20025 17965 16790 4194 6236
Capital expenditure/sales (%) 6.5 6.0 71.4 65.9 52.1 35.1 117.4 87.5
R&D expenditure/sales (%) 8.9 9.3 7.0 5.3 3.0 1.9 3.4 2.6
Productivity per employee 1236 1516 828 1075 203 279 250 256
Capital turnover rate (times) 2.4 3.1 0.8 0.95 1.0 1.27 0.6 1.0
Net income/capital (%) 39.0 42 12.6 35.0 22.7 18.1 10.7 12.3
Gross rate (%) 35.4 38 31.4 43.3 18.2 20.2 22.0 28.3
Operating income rate (%) 19.7 23.2 16.5 37.0 11.1 14.6 16.3 21.8
Net income rate (%) 17.0 21.9 21.1 36.8 24.9 14.3 15.4 17.5
Data source: Yearbook of Semiconductor Industry, 2001, ITRIES/IT IS.
any specified behaviour. It is recognised that there are factors that cross the boundaries, but in this case the point is to define a boundary within which the dynamic behaviour being studied is generated. (b) Feedback loops, which can be negative or posi-tive. The feedback loop is a path that integrates decision, action, condition, and information, with the path returning to the decision point. This de-cision controls action, which changes the system conditions, which influence the decision, and so on. The more complex systems are composed of interconnected feedback loops.
(c) Stocks or flows (levels and rates). Interacting feed-back loops form any system, but each feedfeed-back loop contains a structure consisting of levels and rates. A ‘level’ reflects the state or accumulations of the system at any specific time. The levels change over time. A ‘rate’ is the activity or flow that changes the value of the level.
(d) Observed conditions within the system. There is a discrepancy between observed conditions and goals, and the objective is to identify desired ac-tions that will decrease differences between ob-served goals and conditions.
System dynamics is recognised as an approach to studying the behaviour of complex systems: it aims to demonstrate how policies, decisions, structure, and delays are interrelated and influence growth and stabil-ity. The interrelationships generate a structure, which in turn produces behaviour (indeed, there is an implied
sequence of time, with behaviour being preceded by structure). Forrester defined a ‘complex system’ as “a high-order, multiple-loop, nonlinear feedback structure”; thus it is evident that feedback loops may be understood to be a major source of mysterious be-haviour and policy difficulties. In short,Sterman (2000)
concluded that dynamic complexity arises because sys-tems are dynamic, tightly coupled, governed by feed-back, nonlinear, history-dependent, self-organizing, adaptive, counter-intuitive, policy-resistant, and characterized by trade-offs, etc. Dynamic complexity arises from the interactions among the agents over time.
Through analysing the processes of information feedback inside organizations and by computer simu-lation, system dynamics shows how structure, policies, decisions and time delays within organizations and business systems are interrelated and influence growth and stability. Managerial policies affect dynamic be-haviour, and dynamic behaviour results from the way in which management responds to external variations. System dynamics is also a problem-solving approach that involves models and simulations that examine the varying relationships among the components of any dynamic process (Mandinach and Cline, 1994).
System dynamics does present the process coher-ently; however, it is only as effective as its assumptions. In the field of technology policy research, system dy-namics earned a reputation for inadequacy following the critique of theClub of Rome’s Limits to Growth (1972)byCole et al. (1973). However, the majority of
contributors to the latter critique had no particular ob-jection to the use of the method, and often articulated this point; their main criticisms had to do with the cal-ibration of the model. This affected both the kinds of equations and sub-systems incorporated into the full model, and the specification of each equation itself. The basic point of contention, quite correctly, was “GIGO” (garbage in, garbage out) (ibid., p. 8). The systems have to be properly specified, to avoid the danger of being “blinded by (computer) science”. This is far from easy to do in complex systems of the kind detailed in this paper—only a limited amount of quantitative testing is possible in the case of some of the equations. Veri-fication depends on plausibility and some subjectivity cannot be avoided in certain cases. In the present pa-per we try to concentrate on two kinds of outcomes: those where some assumptions have to be made and the ensuing patterns then confirm or disconfirm those assumptions (in effect taking the rest of the system into account), and those where our explicit or implicit sub-jective views are not so evidently involved.
For example, the paper explores the ‘time for re-sponse’ as the key factor for innovation performance in the policy tests below, but without fully investigating why and how the time for response plays a crucial part in the model of the innovation system. This could be explored further in future studies. Another limitation is that, once the value of a parameter changes, then the behavioural pattern might change as well. Therefore, the process of data collection and model formulation should be carefully cross-referenced.
All these attributes make system dynamics appropri-ate to apply to national innovation systems so long as the method is used with care. This is because NIS issues generate many of the problems which the approach has oriented itself to taking into account. In particular, de-lays in the innovation system can be of especial concern in areas like the IC industry where speed to innovate and market is critical. Such an application, to the best of our knowledge, has not previously been undertaken.
5. Elements of the model
This research centres on an attempt to develop a mathematical model of the national innovation system of Taiwan, particularly with regard to its IC industry. The main aim of this research is to combine related
theories/practices of innovation systems and system dynamics in order to understand both dynamic rela-tions and innovative performance among the structural elements (actors) of Taiwan’s IC industry.
There are two main issues that stand out as prob-lematic. First, what are the institutions, interactions, and driving forces associated with the structure of the Taiwanese national system of innovation and its IC in-dustry? How can these be modelled through systems dynamics? The second issue is what might be the ef-fects of changing the rates or interactions of some key variables, including major S&T policy instruments, in the Taiwanese NIS?
5.1. Sectors of the model
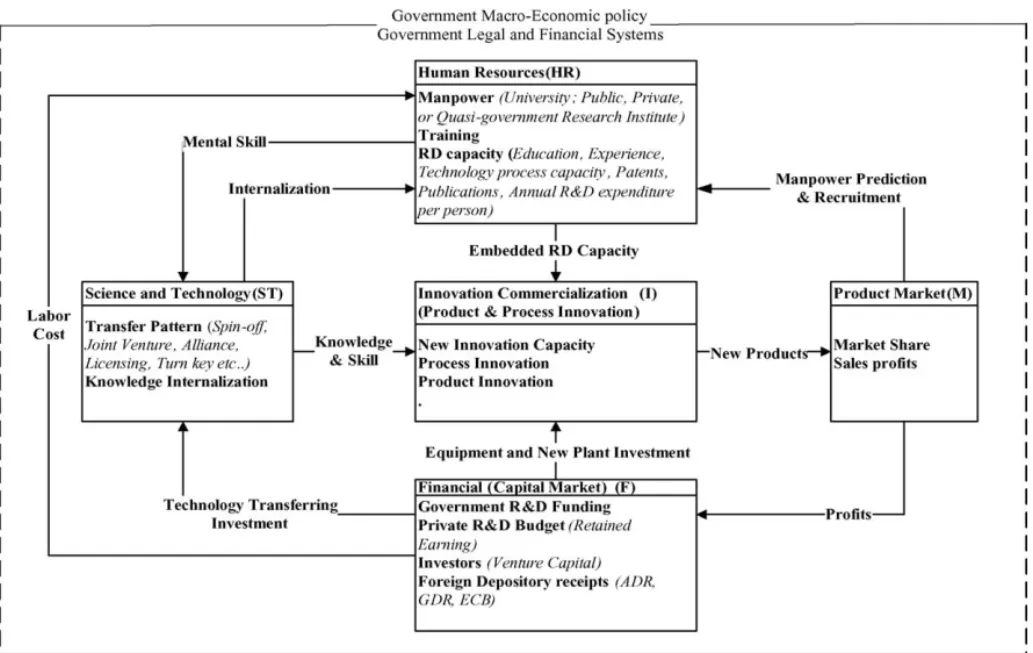
Fig. 3is built up from five sub-systems: financial (capital market), human resources, science and tech-nology, innovation commercialization, and product market. There are five major actors in this model: gov-ernment, industry (firms), research institutes (public and private), foreign companies, and universities. The properties and behaviours of each actor influence all others. The relationships among these actors comprise inter-industry, industry-government, industry-research institutes, industry-foreign companies, and an ambigu-ous relationship between industry-universities. Gov-ernment macroeconomic policy and govGov-ernment legal and financial systems are assumed to lie outside the boundary of the system analysed.
5.1.1. Financial sector
This sector mainly includes private R&D budgets, venture capital, foreign depository receipts and gov-ernment R&D funding as sources of capital. The finan-cial sector supports the essential ‘labour cost’ of the human resources sector while it invests in establishing and renewing essential equipment and new plant for the innovation commercialization sector. Besides, it also provides ‘science capital and technology transfer’ to the science and technology transfer sector. Government funding is scattered over the science and technology transfer sector and the innovation commercialization sector.
5.1.2. Human resources sector
Talented people are the key and crucial factor in the knowledge-based economy. A country possessing
Fig. 3. Structure and boundary developed for the domestic IC Industry in Taiwan’s NIS.
a comparative wealth of talent is likely to have a higher level of competitiveness. Human resources clearly con-tributed to the rapid development of Taiwan’s IC in-dustry. Our goal here will be to describe the Human resources sector providing ‘embedded fruitful knowl-edge and R&D capacity’ to the innovation commer-cialization sector. It also provides the ‘mental skill’ to manage the staff of new organizations which spin off from the research institutes, joint ventures, alliances and turnkey plants.
5.1.3. Science and technology transfer sector
Science and technology transfer comes in two ways: by technology transfer out of universities and insti-tutes (public or semi-public) into commercial use, and from overseas to domestic use. There are several ways to absorb alien technologies (spin-off, joint venture, alliance, licensing, purchase of technology, turnkey, etc.). For an infant industry, it is necessary to purchase new technology in order to catch up developed coun-tries’ technology capacity and achieve any possibility
of ‘leapfrog’. Thus the kind of approach to transfer and the extent to which content is transferred are important.
5.1.4. Innovation commercialization sector
Before the product goes on sale in the market, it is essential to possess new innovation capability. New innovation capability includes embodied and disem-bodied technology know-how. The innovation process comprises process and product innovation. R&D must generate new products and new processes to meet mar-ket requirements.
5.1.5. Market sector
New products are offered to the market, and more sales revenues may then be achieved through commer-cializations processes, then fed back to the financial sector. In this study, the proposed boundary of this sys-tem includes a ‘market sector’ within it, but revealing just the external sources of demand for outputs, i.e. the structure of industry product markets. Similarly, here the ‘government’ does not touch upon the process
of governmental decision-making; the government just supplies the needed financial support and tax incentives policies.
5.2. Calibration of the model
As far as possible, the model was calibrated on the basis of the sort of evidence presented above in Sec-tion3, along with other published data. However, the demands of the model exceed what can be gleaned from statistical sources. Some judgment therefore had to be exercised in supplying the remaining parameters of the system. In doing this, we relied to a considerable de-gree on the results of extensive interviews with indus-try, technology and government experts in Taiwan. This was followed by a lengthy period of simulation to es-tablish that the results made sense, including some of the findings presented in Section6below.
The full set of constituent equations runs to many pages of text. Interested readers can consult the doctoral thesis of Lee (2003) for the entire specification and justification of the model.
5.3. Cause-effect feedback loops
Feedback (interaction) is what makes systems dy-namic; without such feedback, the system is static. Putting it in another way, the greater the interaction among the components of a system, the more dynamic it is. In a system with built-in feedback mechanisms, the behaviour of a structure which is composed of compo-nents, attributes and relationships is constantly chang-ing over time.
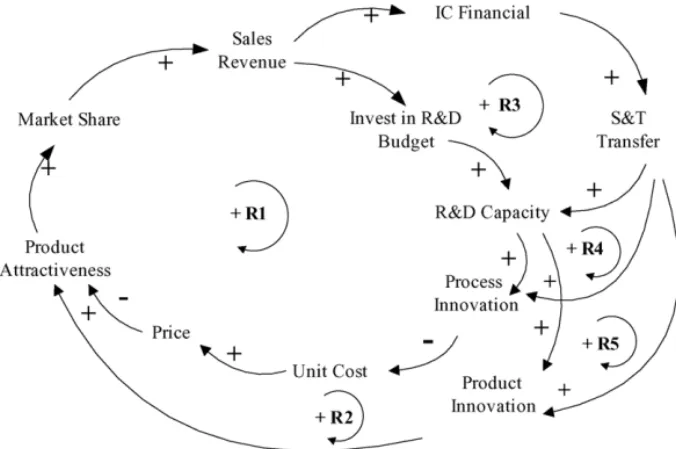
Fig. 4shows five positive loops. As illustrated, the higher the sales revenues, the greater the investment in R&D, leading to process innovations that lower costs. Lower unit costs enable lower prices, which increases product attractiveness, in turn increasing both industry demand and market share, and then boosting sales still more (R1: F-HR-I-M-F loop).1The development of en-tirely new products is a core engine of growth for much of industry. The greater the revenue of an industry, the larger and more effective the new product development effort can be. New products create new demand, boost-ing revenue and increasboost-ing investment in raisboost-ing R&D
1Letters represent each subsystem as inFig. 3.
capacity, and then new product development even more (R2: F-HR-I-M-F loop).
According to this figure, increases in science and technology transfer, leading to R&D capacity promo-tion corresponding to high successful rates of pro-cess innovation, then result in high innovation perfor-mance (product innovation and process innovation), which leads to greater sales and high revenues, then in turn making industry invest much larger R&D Bud-gets, which feed back to S&T transfer. Here the pro-cess innovation can include the use of more highly automated tooling, more reliable machines, and more efficient plant layouts. It can also include training in process improvement techniques such as total quality management, which enhances the ability of workers to detect and correct the sources of defects, thus boosting productivity and lowering costs (R3: F-ST-HR-I-M-F loop; R4 and R5: F-ST-I-M-F loop).
Fig. 5 mainly portrays the interaction and inter-dependence between product innovation and process innovation in the system. Loop R6 describes how more process innovation leads to more pressure for desired product innovation; in turn, the more the product innovation, the more the need for desired process innovation. In Loop R7 (I-M-F-I), the greater the product innovation, the more the product becomes attractive, the higher the market share, hence more sales, more revenues and then more R&D budget reinvested in product innovation. Similarly for product innovation, in the positive (self-reinforcing) Loop R8 (I-M-F-I): the more the process innovation, the higher the production capacity, pushing down prices, then raising product attractiveness; the more the product is attractive, the more the market share, sales, revenues, R&D budgets, and investment in process innovation. Loop R9 (a simplified loop for I-M-F-ST-I, similar to Loop R4 and Loop R5) states that if the R&D budget increases, more will be invested in raising R&D capacity and S&T transfer, simultaneously promoting the innovation rate for process and product.
6. Policy sensitivity tests
6.1. Time policy tests
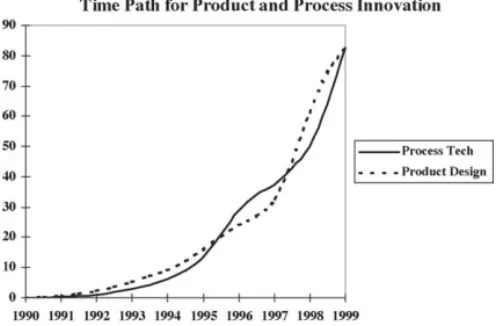
From the simulation of product innovation and process innovation, Fig. 6 shows a relationship of
Fig. 4. Financial, innovation and product causal loop diagram.
Fig. 5. Product and process causal loop diagram.
‘reciprocal causation’.2 A growing sophistication of the product itself causes process innovation. Process innovation in turn may enable or require further inno-vation in products, leading to an increasingly tighter
2 The numbers on the vertical axis come from the simulation data
for process technology, and can be ignored here.
linkage between product change and process change. These results can be compared with those voiced by
Utterback (1979, p. 50).
In the case of Taiwan’s IC industry, the process innovation (it is fair to say, process development) emerged at an early stage, then the design houses sprouted quickly, especially when the manufacturing
Fig. 6. The simulation of product and process innovation.
style of the dedicated semiconductor foundry was introduced by Morris Chang, a Chairman of TSMC, in turn followed by speeded-up product innovation. This is consistent with the ‘reverse product cycle’ of process innovation leading product innovation in East Asia, indicated by Hobday (1995), although implying a higher degree of interactivity.3 In facing the rapid changes of environment and short life cycles of products, the IC industry’s core competence lies not only in its high proportion of R&D in budgets or the high level of its R&D capacity, but very much also on the factor of time-to-market (‘dynamic capability’4). As a unique system of vertical disintegration matures, reducing the time for R&D and the schedule of product time-to-market have become crucial key factors.
Policy makers often seek to adjust the state of the system until it equals a goal or desired state. ‘Desired minus actual over adjustment time’ is the typical neg-ative feedback system. The discrepancy is the gap be-tween the desired state of the system and the actual state, so the adjustment time is the average time re-quired to bridge the gap. From the simulation of the original SD model, it emerges that process technology innovation (PTI) adjusts its innovation speed to match the product design innovation (PDI). Similarly, prod-uct design innovation, in turn, adjusts its innovation speed to match the process technology innovation. The
3For a recent application of this type of model to learning in the
Taiwanese IT industry, see for exampleWang (2003).
4Seevon Tunzelmann and Wang (2003)for a definition of dynamic
capability that emphasises both interactive capability and response in ‘real time’.
adjustment time represents how quickly the IC indus-try tries to respond to the innovation from the other department or the innovation challenge from the com-petitor (in other words, to ‘correct the shortfall’): if the industry seeks to correct the shortfall quickly, the ad-justment time would be small. Of course, in order to succeed, these corrective actions need to be supported by other factors, such as larger R&D budgets, more R&D researchers and engineers, and so on.
The original assumptions for PTI adjustment time and PDI adjustment time are respectively set to 0.5 and 1 year, based on interviews with experts. Below we will assess the changing response time of PTI or PDI for each other, and see if the performance of innovation shows improvement or retrogression. There are six tests that will be conducted, shown inTable 7.
In general, reducing adjustment times makes the system less stable in response to temporary changes, but raises the performance of innovation. Empirical studies reveal that, for example, a 6-month delay in the launch of a new product can reduce overall earnings by up to 33% (Dumaine, 1989).
In sum, the shorter response time reveals the follow-ing:
1) The rate of innovation speeds up (the slope is steep). 2) The volume of innovation increases. When there is a high speed of innovation, then the volume of innovation rises.
3) The reaction of behaviour (such as the inflection point or high peak) comes earlier. The innovation life cycle has condensed, as a result the reaction comes early.
4) The responsiveness of process technology innova-tion is weaker than product design innovainnova-tion. This is because systematic delays in PTI are longer than for PDI. The longer the delay, the longer the time to adjust to the desired goal.
5) When response time is less than two months, the system becomes unstable.
6.2. Science and technology policy tests
Since the critical decision in favour of complemen-tary metal oxide silicon (CMOS) technologies was in-troduced by RCA to Taiwan in 1976, most of the tech-nologies have been transferred from abroad in order to catch up with the advanced countries, and thus far
Table 7
The result of adjustment time policy tests
Original Test 1 Test 2 Test 3 Test 4 Test 5 Test 6
Time for PTI adjustment 0.5 year 1 month 2 month 0.5 year 1 year 0.25 year 1 year Time for PDI adjustment 1 year 1 month 2 month 0.5 year 1 year 0.5 year 2 year
PTI performance 106.83 +62.72 +30.69 +1.71 −22.71 +16.84 −25.37
PDI performance 397.5 +99.87 −6.81 +6.37 −39.07 +8.93 −70.95
Taiwan has become a fast follower in this field. In the early 1990s, a few big firms such as TSMC and UMC insisted on developing their own in-house R&D capac-ity and not depending on importing foreign technolo-gies in order to compete in the world market in the next era, although up to 98% of enterprises are small- and middle-sized in Taiwan. In the first twenty years of de-veloping the IC industry, technology purchases from overseas were necessary and proved to be an efficient way forward. For the next 10 years, if Taiwan reduces or even stops purchasing foreign technology, what will happen to the innovation performance and R&D capac-ity? If this kind of S&T policy is Taiwan’s only way to remain in the international arena in the future, then what kind of policy portfolio is appropriate?
In this section we attempt to choose four policy tests under the principle of no purchase of foreign technol-ogy (Table 8). These four decision-making points can be found in the proposed model: technology purchase from abroad, domestic institute technology spin-out, government grants, and industry’s own R&D budget.
These separately represent the four main actors in the NIS: foreign companies, research institutes, govern-ment, and industry itself.
From Table 9it can be seen that, compared with the assumed cessation of importing foreign technol-ogy, both R&D capacity and innovation performance in test 2 do not reduce as much when institute spin-out is increased, yet the original level cannot be maintained. Doubling government grants, in test 3, has a negligible effect on rescuing the poorer innovation performance. It can be established that, according to this model, rais-ing government grants is not an effective way to pro-mote innovation performance; in other words, this is not a leveraged solution. In test 4 it may be noticed that the PTI still drops, and PDI only slightly increases, al-though the industry R&D budget has been raised by 5%. Only when the R&D budget is raised by 8% can the in-novation performance be maintained. The R&D budget test will be discussed in the next section. On this basis, it can be inferred that raising the R&D budget alone by plausible amounts is also not enough to maintain the
Table 8
Science and technology policy tests
Test 1 Test 2 Test 3 Test 4
Technology purchase from abroad 0 0 0 0
Domestic institutes’ technology spin-out 1 (double) 1 1
Government grants 1 1 (double) 1
Industry’s own R&D budget 1 1 1 (5%)
Note: 0 indicates no technology purchase; 1 indicates “maintaining” the original parameter value; indicates “increasing”. Table 9
The results of science and technology policy tests
R&D capacity (units) Innovation performance PTI (units) PDI (units)
Test 1 No S&T purchase, ceteris paribus −1236.51 −6.74 −34.87
Test 2 No S&T purchase but raising institute spin-out −769.52 −2.57 −13.43 Test 3 No S&T purchase but raising government grants −1236.51 −6.71 −34.06 Test 4 No S&T purchase but raising industry R&D budget by 5% +22977.49 −3.76 +0.96
Table 10
Policy portfolio suggestions
Portfolio 1 Portfolio 2 Portfolio 3 Portfolio 4
+5% Financial policy R&D S&T R&D S&T R&D S&T R&D S&T
1% 4% 2% 3% 3% 2% 4% 1%
Innovation performance +5122 PTI: +8.57 +9284 PTI: +7.97 +14070 PTI: +7.19 +19181 PTI: +6.26
PDI: +53.37 PDI: +55.22 PDI: +55.28 PDI: +53.74
original level of innovativeness when deciding not to purchase foreign technology. As these policy simula-tions thus indicate, Taiwan cannot reach a good innova-tion performance without purchasing foreign technol-ogy or cooperating with foreign companies. The most important conclusion is that no single S&T policy can be emphasised alone, instead it is a matter of arranging the appropriate portfolio policy in terms of the needs of industry.
There is another scenario test here. If there is a 5% increase in IC finance, ceteris paribus, this 5% may be allocated to S&T purchases and R&D budget expan-sion, to see if the R&D capacity and innovation perfor-mance is better than under the previous tests.Table 10
shows four kinds of portfolios. With as neutral an at-titude as is possible, portfolio 3 seems better than the others from the point of view of a ‘win–win’ strategy. As mentioned above, no one S&T policy can be emphasised in isolation and no one S&T policy can be suitable for all companies. There is a great heterogene-ity existing in each company even in the same industry. S&T policy needs to be fitted to the needs of indus-try; besides, the current industry environment (domes-tic and international), competitors, all the suppliers and demanders within the value chain, etc., also need to be taken into consideration.
6.3. R&D budget policy tests
The last policy tests are about industry monetary policy. Compared with the previous two policy tests (the adjustment time test and S&T policy test), mon-etary policy is easier, faster, more available to handle and maybe more efficient. The original SD model cap-tures the structure and policies founded on a gradual rise in R&D capacity accumulated.
In general, there are two fundamentally different types of input disturbances that are used in the
test-ing process: historical time-series of actual inputs, and pure disturbances such as a STEP input. In this sec-tion we try to forecast policy change over a plausi-ble 10-year period under this proposed SD model. The STEP input, a sudden one-shot and permanent change, is very simple and uncomplicated, although it is of-ten informative.Lyneis (1980, p. 94) pointed out that the response of a system to a STEP input reveals (1) any tendency of a system toward instability—a system that exhibits instability for a STEP input will generally do so for more realistic inputs, and (2) the response time or the length of time the system takes to adjust to new conditions—long response times may indicate trouble in adjusting to growth or declines in business. Here we proceed with three budget policy tests un-der the same assumptions as in the proposed model (seeTable 11).
FromTable 11it can be seen that raising the R&D budget alone has a big effect on PDI performance. Following the large-scale rise of R&D capacity, how-ever, process innovation performance does not attain the same scale of increase, but only a small rise. Ac-cording to our intuition, R&D capacity is the most im-portant key success factor affecting innovation perfor-mance, but in fact this is only partly true according to this simulation. The result comes about because of the long delays involved in raising process as opposed to product innovation.
If R&D capacity rising on this large scale still can-not promote a large innovation performance, what is the key success factor that does affect innovation per-formance? It is necessary to turn back and recheck the proposed SD model to find out what are the key factors causing the fluctuations of innovation performance. In this research we have carried out three kinds of policy test: an adjustment time policy test, an S&T policy test (including four actors: government, foreign, research institute, and industry itself), and a monetary test. Then
Table 11
The results of R&D budget policies
R&D budget Original Test 1 Test 2 Test 3
10% 15% 18% 20%
R&D INNO. R&D INNO. R&D INNO. R&D INNO.
Performance 74418 PTI: 106.83 +33% PTI: +3.16 +58% PTI: +4.23 +76.4% PTI: +4.72
PDI: 397.5 PDI: +39.22 PDI: +52.37 PDI: +58.36
we track back to each above decision-making points to analyse what is the key factor(s) causing the fluctua-tions of innovation performance (refer toTable 7). We found that ‘time for PTI adjustment’ and ‘time for PDI adjustment’ (the times for response) are the most sen-sitive factors.
Working with a dynamic model, people discover that in complex systems cause and effect are separated in time and place. Such insight is also counter-intuitive (de Geus, 1988). The use of dynamic models did help us discover other trigger points, separated in time and place from the desired effect.
6.4. Summary remarks
The findings presented above indicate the following: 1. The shorter the adjustment time, the faster the rate of innovation. The longer the delay, the longer the time to adjust to the desired goal (Table 7). 2. The innovation performance cannot be much
im-proved by just raising institute spin-out, government grants, or industry R&D budgets alone and in iso-lation (Table 9).
3. Doubling the R&D budget or R&D capacity alone is unable to guarantee innovation performance on the same scale of increase (Table 11).
7. Conclusions and policy implications
System dynamics is based on the theory of non-linear dynamics and feedback control. By means of computer simulation, it can help to learn about dy-namic complexity and the sources of policy resistance, as well as provide more effective policy suggestions. System dynamics shows how structure, policies, de-cisions and time delays within organizations/systems
are interrelated and interdependent. It also casts light on how managerial policies affect dynamic behaviour, and dynamic behaviour results from the way in which management responds to external variations. System dynamics does present the process coherently; how-ever, it is only as effective as its assumptions. For ex-ample, it explores the ‘time for response’ as the key factor for innovation performance in the policy tests, but without fully investigating why and how the time for response plays a crucial part in the model of the inno-vation system. This could be explored further in future studies.
Often the implementation of new policies in sys-tems leads to unintentional side effects. System dy-namics models of socio-economic systems often ex-hibit ‘counter-intuitive’ behaviour, in which the result of a policy or structural change is different from, or even opposite to, what logic might initially have pre-dicted. Fortunately, system dynamics is able to help in identifying such counter-intuitive behaviour. Although this SD model is unable to include all the components in the real world, it embraces many of the essential parts. Its policy tests and scenario simulations aid in helping policy-makers to develop appropriate policy suggestions and comparisons.
The Taiwan IC industry appears to have displayed many of the characteristics of a ‘virtuous circle’, but of course it is easy in principle to reverse all these positive feedbacks. Deeper thinking, with the aid of the insights from the model structure advanced in this paper, reveals the complex, dynamic and non-linear relationship with the country’s NIS.
Based on the characteristics of innovation manage-ment, S&T policy needs to be fitted to the needs of industry in the current industrial environment (domes-tic and international); competitors and all the suppli-ers and demandsuppli-ers within the value chain need to be taken into consideration as well. AsCoyle (1977, p. 29)
pointed out: “. . . the problem is to select a harmonious collection of economic and social policies which will be robust for the whole economy in the face of exter-nal shocks from the economic controller’s complement and environment.”
As already noted, no one S&T policy can be em-phasised alone. From the results ofTable 9concerning the portfolio of the science and technology policy test, subsidies from government are no longer the key ‘pro-peller’ which pushes forward the improvement of the IC industry. Moreover, according to the results of S&T policy tests inTable 9, foreign S&T transfer is still an essential factor in Taiwan’s IC industry. Improvements in process technology, relative to other state-of-the-art technology, in the IC industry in Taiwan more and more deeply depend on the introduction and transfer of for-eign advanced technology.
In the past, Taiwan invented the production style of the ‘dedicated semiconductor foundry’. ‘Design’ was isolated successfully from ‘manufacture’, and really enjoyed a ‘first mover advantage’. In the future for Tai-wan’s IC industry, whether it can maintain or create another high peak or not depends on tight and effec-tive interaction among government, industry, research institutes, universities, and even foreign companies, and even more importantly the decision-maker’s guid-ance.
References
Club of Rome, 1972. In: Meadows, D.H., Meadows, D.L., Randers, J., Behrens, W.W. (Eds.), The Limits to Growth. Universe Books, New York.
Cole, H.S.D., Freeman, C., Jahoda, M., Pavitt, K.L.R., 1973. Think-ing About the Future: A Critique of The Limits to Growth. Chatto & Windus/Sussex University Press, London.
Coyle, R.G., 1977. Management System Dynamics. John Wiley & Sons, Chichester.
de Geus, A.P., March–April, 1988. Planning as learning. Harvard Business Review, pp. 70–74.
Dumaine, B., 1989. How managers can succeed through speed. For-tune 13 (4), 30–35.
Edquist, C., 1997. Systems of Innovation Approaches: Their Emer-gence and Characteristics. Cassell Academic.
ERSO/ITRI, 2001. Industrial Technology Information Services Pro-gram,http://www.tsia.org.tw/ersoitis/.
Fagerberg, J., Mowery, D., Nelson, R. (Eds.), 2004. Oxford Hand-book of Innovation. Oxford University Press, Oxford. Forrester, J.W., 1976. Principles of Systems. MIT Press, Cambridge
MA.
Freeman, C., 1987. Technology Policy and Economic Performance: Lessons from Japan. Frances Pinter, London.
Hobday, M.G., 1995. Innovation in East Asia: The Challenge to Japan. Edward Elgar, Aldershot.
Lee, Y.-L., 2003. Dynamic analysis of the national innovation sys-tems model: a case study of Taiwan’s integrated circuit industry. Unpublished Ph.D. thesis, PREST, University of Manchester. Lundvall, B. (Ed.), 1992. National Innovation Systems: Towards a
Theory of Innovation and Interactive Learning. Frances Pinter, London.
Lyneis, J.M., 1980. Corporate Planning and Policy Design: A System Dynamics Approach. Pugh-Roberts Associates, Cambridge MA. Malerba, F. (Ed.), 2004. Sectoral Systems of Innovation: Concepts, Issues and Analyses of Six Major Sectors in Europe. Cambridge University Press, Cambridge.
Mandinach, E., Cline, H., 1994. Classroom Dynamics: Implementing a Technology-based Learning Environment. Hillsdale, Erlbaum. Mathews, J.A., 1997. A silicon valley of the East: creating Taiwan’s semiconductor industry. California Management Review 39 (4), 26–54.
McKelvey, M., 1991. How do national systems of innovation dif-fer?: a critical analysis of Porter, Freeman, Lundvall and Nelson. In: Hodgson, G., Screpanti, E. (Eds.), Rethinking Economics: Markets, Technology and Economic Evolution. Edward Elgar, Aldershot, pp. 117–137.
Metcalfe, S., 1995. The economic foundations of technology pol-icy: equilibrium and evolutionary perspectives. In: Stoneman, P. (Ed.), Handbook of the Economics of Innovation and Techno-logical Change. Blackwell, London.
Mowery, D.C., Ziedonis, A.A., 1998. Market failure or market magic?: structural change in the US national innovation system. STI Review 22, 101–136.
Nelson, R. (Ed.), 1993. National Innovation Systems: A Comparative Analysis. Oxford University Press, New York.
OECD, 1997. National Innovation Systems, The NIS Project. OECD, Paris.
Patel, P., Pavitt, K., 1994. The nature and economic importance of national innovation systems. STI Review, 14.
Roberts, E.B., 1978. System dynamics: an introduction. In: Roberts, E.B. (Ed.), Managerial Applications of System Dynamics. MIT Press, Cambridge MA.
Sterman, J.D., 2000. Business Dynamics: Systems Thinking and Modelling for a Complex World. McGraw-Hill, Cambridge MA. Utterback, J.M., 1979. The dynamics of product and process inno-vation in industry. In: Hill, C.T., Utterback, J.M. (Eds.), Tech-nological Innovation for a Dynamic Economy. Pergamon Press, New York.
Vanichseni, S., 1998. A model of national innovation systems and development strategy: a case of catching-up economies. Paper presented at the OECD workshop on National Innovation System in Catching-up Economies, Taipei, Taiwan, April.
von Tunzelmann, N., Wang, Q., 2003. An evolutionary view of dy-namic capabilities. Economie Appliqu´ee 16, 33–64.
Wang, J.-H., 2003. The making of unknown heroes: national system of learning, OEM, and Taiwan’s IT industry, paper for SASE (Society for the Advancement of Socio-Economics), Aix-en-Provence, June.