http://sim.sagepub.com/
SIMULATION
http://sim.sagepub.com/content/82/11/731
The online version of this article can be found at:
DOI: 10.1177/0037549706074487
2006 82: 731
SIMULATION
Ji-Lung Hsieh, Chuen-Tsai Sun, Gloria Yi-Ming Kao and Chung-Yuan Huang
Teaching through Simulation: Epidemic Dynamics and Public Health Policies
Published by:
http://www.sagepublications.com
On behalf of:
Society for Modeling and Simulation International (SCS)
can be found at: SIMULATION
Additional services and information for
http://sim.sagepub.com/cgi/alerts Email Alerts: http://sim.sagepub.com/subscriptions Subscriptions: http://www.sagepub.com/journalsReprints.nav Reprints: http://www.sagepub.com/journalsPermissions.nav Permissions: http://sim.sagepub.com/content/82/11/731.refs.html Citations:
What is This?
- Feb 27, 2007
Version of Record
>>
Teaching through Simulation: Epidemic
Dynamics and Public Health Policies
Ji-Lung HsiehChuen-Tsai Sun Gloria Yi-Ming Kao
Department of Computer and Information Science National Chiao Tung University
1001 Ta Hsueh Road
Hsinchu 300, Taiwan, Republic of China
[email protected] Chung-Yuan Huang
Department of Computer Science and Information Engineering Chang Gung University
259 Wen-Hwa 1st Road
Taoyuan 333, Taiwan, Republic of China
A growing number of epidemiologists are now working to refine computer simulation methods for dis-eases as a strategy for helping public policy decision-makers assess the potential efficacies of tactics in response to newly emerging epidemics. These efforts spiked after the SARS outbreak of 2002– 2003. Here we describe our attempt to help novice researchers understand epidemic dynamics with the help of the cellular automata with social mirror identity model (CASMIM), a small-world epidemi-ological simulation system created by Huang et al. in 2004. Using the SARS scenario as a teaching example, we designed three sets of instructional experiments to test our assumptions regarding (i) simulating epidemic transmission dynamics and associated public health policies, (ii) assisting with understanding the properties and efficacies of various public health policies, (iii) constructing an ef-fective, low-cost (in social and financial terms) and executable suite of epidemic prevention strategies, and (iv) reducing the difficulties and costs associated with learning epidemiological concepts. With the aid of the proposed simulation tool, novice researchers can create various scenarios for dis-covering epidemic dynamics and for exploring applicable combinations of prevention or suppression strategies. Results from an evaluative test indicate a significant improvement in the ability of a group of college students with little experience in epidemiology to understand epidemiological concepts.
Keywords: Learning through simulation, epidemiological model, public health policy, small-world
network
1. Introduction
Complex network science and agent-based social sim-ulation techniques [1–3] have intensified interest in us-ing computer-based social simulations to analyze so-cial phenomena and processes. Motivations for using computer-based social simulations include the following: (i) the shortcomings of traditional social science research
SIMULATION, Vol. 82, Issue 11, November 2006 731-759
© 2007 The Society for Modeling and Simulation International DOI: 10.1177/0037549706074487
methods for investigating the dynamics of social systems, as social phenomena cannot be adequately represented by static relations and simple interaction rules [4]; (ii) the abil-ity to alter computer simulation parameters, which allows researchers with any level of technological skill to create “what-if” experiments for examining factors that might affect social issue outcomes [5]; (iii) computer-based so-cial simulations allow for faster construction of new soso-cial models [6]; (iv) computer-based social simulations make it easier to create reports and to import information from CD-ROMs or the Internet [7].
Epidemiologists favor computer-based social simula-tions for at least four reasons, as follows [3].
1. Observation and visualization: Computer-based so-cial simulations allow for slowing down or speeding up epidemic simulations to observe complete or par-tial spreading within a proper time-scale.
2. Operational training: Computer-based social sim-ulations reduce the dangers and costs associated with gathering and manipulating data on actual epidemics.
3. Modeling: Computer-based social simulations allow new learners to construct epidemic models to explore emerging epidemic factors and to analyze simulation processes and experimental results.
4. Understanding: Computer-based social simulations let learners observe the effects of various transmis-sion routes and modes on epidemic transmistransmis-sion dy-namics and test various combinations of prevention or suppression strategies [8].
Parallel processes, nonlinearity, and actor heterogene-ity are significant challenges for designers of mathemati-cal and other forms of analytimathemati-cal models [2]. Thus, until recently the literature in this area tended toward model simplification rather than attempting to reflect real-world complexities in simulations [9].
Constructed social networks based on interpersonal relationships and simple daily human contact can exert significant impacts on epidemic transmission dynamics [10–16]. For instance, interactions among individuals and contact routes are known to affect outbreaks of short-distance contagious diseases, such as SARS and other en-teroviruses. Because of the potential complexity of human interactions, epidemiologists and public health specialists require computer simulations that can incorporate multi-ple social networks to analyze and control wide ranges of possible transmission behaviors and epidemic characteris-tics. Furthermore, epidemic transmission speed and scope are affected by daily human activities, including the en-trenched habits of modern lifestyles. For instance, the ma-jority of adults in developed countries use identical trans-portation modes for daily short- and long-distance travel. The limited diversity of transportation options to regularly visited sites (e.g., workplaces and schools) creates envi-ronments for rapid disease transmission.
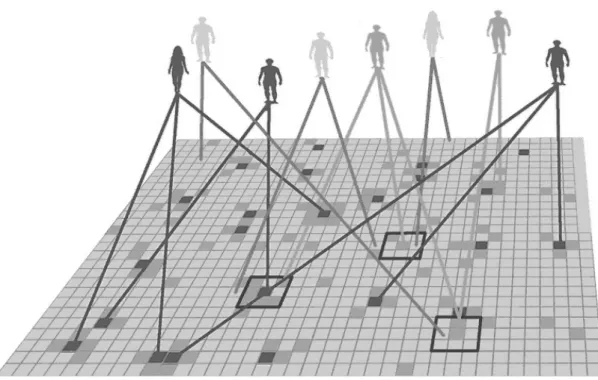
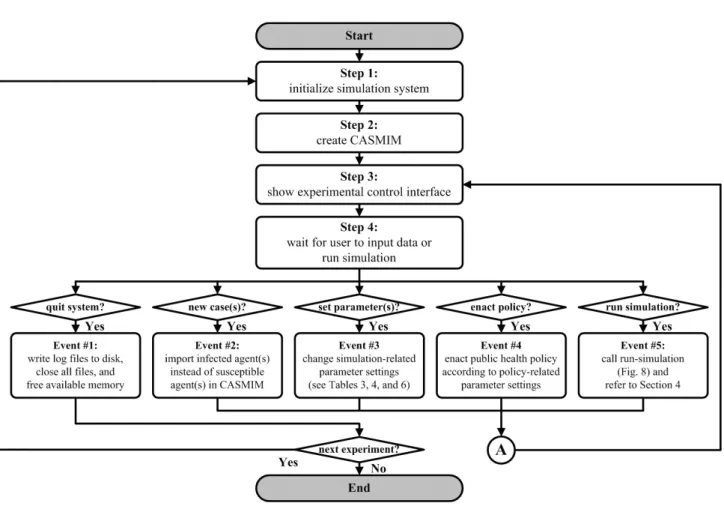
Because it is difficult to control human movement in terms of method, timing, direction, and distance, re-searchers are repeatedly challenged by the task of sim-ulating individual movement within a society—an issue referred to in the literature as the “mobile individual prob-lem” [17–20]. After the SARS outbreak of 2003, Huang et al. [21, 22] proposed a small-world epidemiological model for simulating epidemic transmission dynamics and public health policies; they called this the cellular automata with social mirror identity model, or CASMIM (Figure 1). They established the social mirror identity for integrat-ing long-distance movement and geographic mobility into
their model, simulating the transmission dynamics of con-tagious diseases, and investigating the effectiveness of var-ious combinations of public health policies and epidemic prevention strategies [21–23].
Results from experimental simulations indicate that CASMIM is a robust and extensible epidemiological sim-ulation system suitable for multiple applications, includ-ing classroom demonstrations of many types of epidemics and detailed numerical experiments involving specific epi-demic diseases and public health policy suites. It can there-fore serve as a good starting point for teaching and training novice researchers and epidemiology students. In addition, it should be noted that CASMIM’s value is not just for demonstrations, but also for performing interactive simu-lations. Novice researchers can use CASMIM to simulate and confront real-world problems. Through comparisons and discussions of simulation results with peers [24], in-dividual understanding of epidemic dynamics can be en-riched and different hypotheses may be evaluated in terms of their rationalities.
In this paper we describe three sets of instructional ex-periments for teaching social science researchers and inex-perienced epidemiologists how to use the CASMIM sys-tem to simulate epidemic dynamics and create strategies to address real-world issues. Our primary teaching goals are as follows: (i) to simulate epidemic transmission dynamics and public health policies associated with epidemics; (ii) to understand the properties and effectiveness of various public health policies, alone and in combination; (iii) to construct effective, inexpensive (in terms of financial and social costs), and executable suites of epidemic prevention strategies; (iv) to reduce costs associated with learning epi-demiological principles.
2. Related Theories and Systems
2.1 Teaching and Learning through Simulation: High-Level Intellectual Effort
Instruction-based education is often criticized for only providing information, without teaching practical skills that learners can use to solve real-world problems [25]. Un-til very recently, science education has emphasized hasUn-tily taught concepts while neglecting the importance of ex-ploring problems from a learner’s own experiences. Con-sequently, learners tend to become obsessed with complex procedures described in textbooks. Computer simulations are now employed to support learning or training based on constructivist learning principles [26, 27]. In a report on educational technology prepared for the United States President’s Office, a committee of science advisors pre-sented a list of the most promising constructivist applica-tions of technology; simulaapplica-tions were at the top of that list [28].
Learning through simulation fits well with construc-tivist principles, as both focus on active learning and knowledge construction based on interactions between
Figure 1. An example of the social mirror identity concept
previous experiences and ongoing events. Aldrich [29] de-scribes simulations as interactive, representational envi-ronments that provide experiences that require learners to actively construct knowledge. Constructivists believe that learners draw upon prior knowledge to form new schema for discovery learning [30]. When learners are confronted with a new stimulus, they apply their own knowledge bases to accommodate new information and alter their existing schema [31]. When a constructive learning process is em-bedded in a simulation tool, learners can “learn by doing”, have better opportunities to discover interesting primary and secondary issues, and gain hands-on experience to deal with real-world problems.
Learning through simulation can be viewed as an exam-ple of problem-based learning (PBL) in that it confronts learners with authentic problems that serve as contexts for practice. As a general model, PBL was developed for med-ical education in the early 1970s; since that time, it has been refined and implemented in over 60 medical schools [32]. Two characteristics make PBL compatible with
the theoretical foundation of learning/teaching through simulation.
1. Engagement. Learners often request simulations to assist with learning and to gain a sense of engage-ment with real-world problems. Consequently, re-lated concepts can be introduced to the learning pro-cess. There is no “perfect” educational simulation, but simulations support meaningful learning experi-ences as long as scenario limitations are taken into account [29].
2. Interaction flexibility. Simulation tools can be used with interaction and feedback to show how complex systems work under different circumstances [29]. Simulated problems are usually complex, often with no single “correct” answer. Learners need to model realistic situations via the repeated interactive ma-nipulation of parameters. With sufficient practice, learners or novice researchers can learn how to trans-fer their new knowledge to real-world issues.
During the simulation process, group discussion pro-vides opportunities for exchanges of alternative views and consensus building on comprehensive and coherent per-spectives. It is widely accepted that learners are reluctant to participate in unfocused discussions. A simulation and its results can provide a focus for individuals to discuss a range of observations or strategies for a single epidemic issue [33]. Sharing personal viewpoints within a group context can facilitate follow-up discussions of personal findings or the clarification of rationales behind different opinions. In-corporating group member observations and insights from simulation results can broaden or improve the ability of individuals to understand and learn epidemic concepts.
2.2 Epidemiological Models with Social Networks
The SIR model of Kermack and McKendrick [34] is the foundation on which most contagious disease models are based. The letters represent the three primary states of any individual with respect to a communicable disease: suscep-tible, meaning that an individual is vulnerable to infection but has not yet been infected; infectious, meaning that an individual can infect others; removed, meaning that an in-dividual has either recovered, died, or otherwise ceased to pose any further threat. During epidemic outbreaks, new infections occur because infected and susceptible individ-uals come into direct contact with each other. Suscepti-ble individuals consequently become infected according to probabilities associated with a combination of personal and disease characteristics.
The spreading of a contagious disease reflects a close relationship between social networks and individuals who come into contact with each other. The initial version of the SIR model assumed that interactions among S, I and R individuals occur according to a “well-mixed hypoth-esis” [35, 36] in which they interact without concern for population structure. Though improbable, this hypothesis simplifies contact factors that must be considered when formulating an epidemiological model. A random interac-tion hypothesis also makes it easier for epidemiologists and public health specialists to construct SIR models that represent ranges of possible transmission dynamics for epi-demic outbreaks, infectious origins, and disease parame-ters based on data collected during previous outbreaks of contagious diseases.
Results from statistical analyses and computer simula-tions show that the global topological characteristics of so-cial networks exert considerable influence on the behavior of easily spread diseases [15, 21, 35]. These characteristics allow for the detailed study of more subtle aspects of conta-gious disease transmission that cannot be performed using non-network models such as the original SIR model. Fur-thermore, the need to identify targeted and more efficient intervention strategies requires accurate model representa-tions of public health policies with geographical properties (e.g., home quarantines and hospital visitation bans). An important disadvantage of the SIR model and its
deriva-tives is that aggregate variables and differential equations can increase very quickly as the number of populations under consideration grows—for instance, healthcare work-ers, hospital patients, or the family members of individuals under home quarantine [35, 36].
3. Simulation System for Studying Epidemics and Public Health Policies
CASMIM [21, 22] is a small-world computation simu-lation model. CASMIM conceptualizes individuals as ele-ments and their most frequently visited places as logically abstracted mirror identities—for example, homes, train sta-tions, workplaces, and restaurants. The mirror identity con-cept utilizes simple social networks (i) to preserve the prop-erties of elements that interact with their neighbors within two-dimensional lattices, and (ii) to reflect such activities as long-distance movement and daily visits to fixed loca-tions. For this reason, the mirror identity concept in CAS-MIM is suitable for describing epidemics in modern soci-eties. The model has clustering and small-world properties that allow it to simulate epidemic transmission dynamics. By manipulating disease parameters and public health poli-cies, CASMIM can be used to simulate the transmission dynamics of influenza, tuberculosis, and other contagious diseases.
3.1 Cellular Automata with Social Mirror Identity Model (CASMIM)
CASMIM consists of two layers: an upper layer rep-resenting a simplified multi-agent system for simulating heterogeneous cohorts and a lower layer that contains
two-dimensional n× n cellular automata (CA) that represent
real-world activity spaces (Figure 2). The social mirror identities that connect the two layers establish CASMIM as a small-world network model. In CASMIM, each indi-vidual in the upper layer is depicted as a single agent in a multi-agent system; places that any agent visits on a reg-ular basis (e.g., homes, train stations, and workplaces) are defined as that agent’s social mirror identities. In a typical cellular automaton, lattices represent abstract agents. In CASMIM, each lower-layer CA lattice represents a social mirror identity.
It is possible for multiple social mirror identities (rep-resenting fixed locations that are visited daily or regularly) to be connected to the same agent. The number of social mirror identities for any single agent exhibits a normal dis-tribution. The mirror identity concept utilizes simple social networks to preserve the properties of elements that interact within two-dimensional lattices, thus reflecting such activ-ities as long-distance movement and daily visits to fixed locations. Clusters consisting of a mirror identity and its von Neumann neighbors can represent family members, co-workers, fellow commuters, healthcare workers, rela-tives in hospitals, or diners in restaurants. Each individual upper-layer agent has a set of attributes that demonstrates
Figure 2. Cellular automata with social mirror identity model (CASMIM)
its epidemiological progress and social mobility status; these attributes are accessible to all of the agent’s social mirror identities (Figure 3, Table 1). In addition, each so-cial mirror identity has a group of private attributes that represent its current status, location, and special activity lo-cations such as homes, hospitals, or dormitories (Table 2). Different epidemics require different simulation time steps. For the SARS example, CASMIM was programmed to define one time step as equivalent to one day in the real world. For diseases with long-term developmental stages (e.g., HIV) one time step may equal one year. Huang et al. incorporated this assumption into their CASMIM de-sign (Figures 4 and 5). The statuses of upper-layer agents change simultaneously with their lower-layer social mirror identity statuses during each time step, reflecting their daily interactions. The attributes of social mirror identities and agents vary according to the following: (i) the attributes of neighboring agents’ social mirror identities; (ii) a set of interaction rules; (iii) simulation and epidemic parameters; (iv) public health policy parameters. CASMIM can there-fore be considered a small-world epidemiological simula-tion system having such simple social network attributes as population structure, area clustering, space, heterogeneity, localization, and interaction. It also has the social attributes of long-distance movement, daily visits to fixed locations, multiple activity nodes, and the small-world characteris-tic of low degree of separation. All of these attributes are
Figure 4. Simulation system framework
Table 1. Agent attributes
Default
Attribute Description Value
ID Unique serial number that identifies agent in CASMIM. 1–P
E RateF oreverI mmune determines proportion of agents classified as M (Immune) in the epidemiological progress attribute E (i.e., the population of permanently immune agents). All other agents are classified as S (Susceptible)—“not yet infected but prone to infection”.
Susceptible, Immune
Mobility Default value is “free”—no restrictions on interacting with the mirror identities of neigh-boring agents. When an agent is placed under home quarantine or hospital isolation, its Mobility status changes to Quarantined or Isolated, meaning that the agent is re-stricted to its rooted social mirror identity (home, hospital, or dormitory), and that the activities of all social mirror identities are temporarily suspended.
Free
Count Records the number of an agent’s mirror identities; each agent has a minimum of 1 and a maximum of M. The number of an agent’s mirror identities exhibits a normal distribution.
1–M
MirrorIdentity Data structure for containing mirror identities.
Age Agents are categorized as young (1–20), prime (21–60), and old (61 and above). Ages are randomly assigned according to RateY oung, RateP rime, and RateOldparameters.
Young, Prime, Old
Super Denotes whether an agent is a super-spreader. If yes, set Super to “true”; if no, to “false”. The RateSuperparameter determines which agents are super-spreaders.
True, False
ImmunityP ermanent Denotes whether an agent is permanently immune. If yes, set ImmunityP ermanentyto “true”; if no, to “false”. The RateF oreverI mmunitydetermines which agents are perma-nently immune.
True, False
Day Number of days for each of the three epidemiological progress states. If an infected agent has not yet recovered, Day is used to indicate the number of infected days. For recovered agents, Day is used to indicate the number of days since full recovery. If a recovered agent has temporary antibodies, Day is used to indicate the number of immune days.
RateCont act Rate of contact with other agents. For all agents, RateCont act values exhibit a normal distribution.
0–1
WearingMask Denotes whether an agent wears a mask. If yes, set WearingMask to “true”; if no, to “false”. Default value is “false”. When a mask-wearing policy is enacted (for the general public or for healthcare workers), the PolicyW earingMask.Parameter.RateP art icipat ion parameter is used to determine how many agents wear masks.
False
MaskType Average prevention grade of agent masks. The higher the number (closer to 1), the greater the efficacy.
0–1
QuarantinedDay Number of home quarantine days, with a range of 0 to
PolicyH omeQuarant ine.Parameter.DayQuarant ined.
3.2 Parameters
In CASMIM, users can manipulate several types of pa-rameter set. For example, papa-rameters H and W in Table 3 control the height and width of two-dimensional CA. A combination of P and M can be used to set up a specific agent population and its mirror identities for a simulation. Detailed examples of simulation parameters are shown in Tables 3–5. Details for environmental and population pa-rameters and their default values are shown in Table 3. The default values allow first-time users to quickly execute sim-ple and understandable demonstrations.
The second set contains three types of epidemic parame-ters. The first type includes PeriodI ncubat ion, PeriodI nf ect ious, PeriodRecovered, and PeriodI mmune (Table 4). These have
strong associations with specified epidemic characteristics and epidemic progress (e.g., SIR or SEIR—susceptible, exposed, infectious, and recovered). The second type
con-sists of individual statuses such as the percentage of super-spreading events and age distribution (e.g., youth, adult, and elderly). The final type consists of RateF oreverI mmunity, RateI nf ect ion, RateDeat h, and FrequencyCont act. These are used
to determine epidemic transmission mechanisms among individuals.
The final CASMIM parameter set addresses the efficacy and efficiency of various public health policies (Table 5). Participation rates indicate the percentage of individuals who follow the suggested or required public health pol-icy. Examples of public health policies that affect epidemic prevention rates include wearing masks by the general pub-lic or hospital workers, body temperature measurement, and home quarantine for various time periods. Different types of masks—general, activated carbon, disposable sur-gical, N95—are rated as having the respective efficacies for preventing the transfer of viruses of 25%, 50%, 75%, and
Table 2. Social mirror identity attributes
Default
Attribute Description Value
Root Each agent has one mirror identity whose Root = true; for all other mirror identities,
Root = false. The rooted mirror identity is used to mimic special activity locations—for
instance, homes, hospitals, and dormitories.
True, False
Suspend Default value is false for all mirror identities, denoting that they can move about without restriction. Except for rooted mirror identities, Suspend = true for all mirror identities of an agent in home quarantine or hospital isolation, representing the idea that the agent cannot interact with other adjacent neighbors outside of its home or hospital until the end of the quarantine or recovery period. If the agent dies, Suspend = true for all mirror identities (including rooted mirror identity), representing the idea that the agent can no longer visit any other location.
False
Location The first number represents the x-axis coordinate and the second the y-axis coordinate for the location of a mirror identity in the two-dimensional CA. Each mirror identity is mapped to a single coordinate location; in other words, each coordinate location contains a single mirror identity of only one agent.
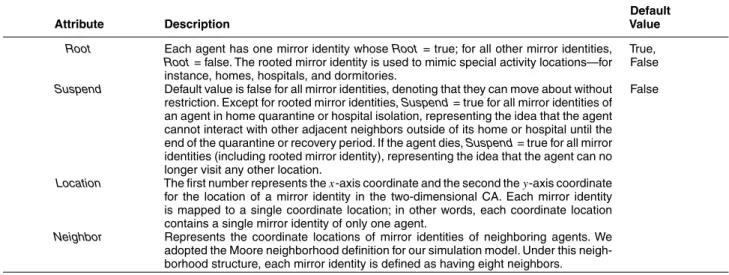
Neighbor Represents the coordinate locations of mirror identities of neighboring agents. We adopted the Moore neighborhood definition for our simulation model. Under this neigh-borhood structure, each mirror identity is defined as having eight neighbors.
Table 3. Simulation system parameters
Default
Attribute Description Value
PopulationAgent Stores total agent population in simulation system
P Total number of agents 100,000
M Upper limit of an agent’s mirror identities 5
H Height of two-dimensional lattice used in CA 500
W Width of two-dimensional lattice used in CA 500
N Total number of usable lattices (H× W) in CA 250,000
Table 4. Epidemic disease parameters
Default
Attribute Description Value
PeriodI ncubat ion Number of incubation days 5
PeriodI nf ect ious Number of infectious days 25
PeriodRecovered Number of recovered days 7
PeriodI mmune Temporarily immune to the disease
RateSuper Percentage of super-spreaders in total population 0.0001
RateY oung Percentage of young (0–20 years) agents in total population 0.3
RateP rime Percentage of prime (21–60 years) agents in total population 0.5
RateOld Percentage of old (60 years and above) agents in total population 0.2
RateF oreverI mmunity Percentage of permanently immune agents in total population
RateI nf ect ion Average infection rate 0.045
RateDeat h Average death rate 0.204
FrequencyCont act Number of contacts between an agent and its neighbors per time step 4
95%. A second example is home quarantine period. During the SARS outbreaks in 2002–2003, the World Health Or-ganization (WHO) suggested that the minimum length of home quarantine should be the twice the viral incubation period. Altering the length of the quarantine period allows students to determine the best combination of length and social costs.
Most data required for establishing epidemic param-eters are available from national health authorities or the WHO. This includes data for R0, PeriodI ncubat ion, Pe-riodI nf ect ious, PeriodRecovered, and PeriodI mmune.Values for RateF oreverI mmunity, RateDeat h, and the average number of
mirror identities require input from disease experts and epidemiologists, while novice simulation tool users are
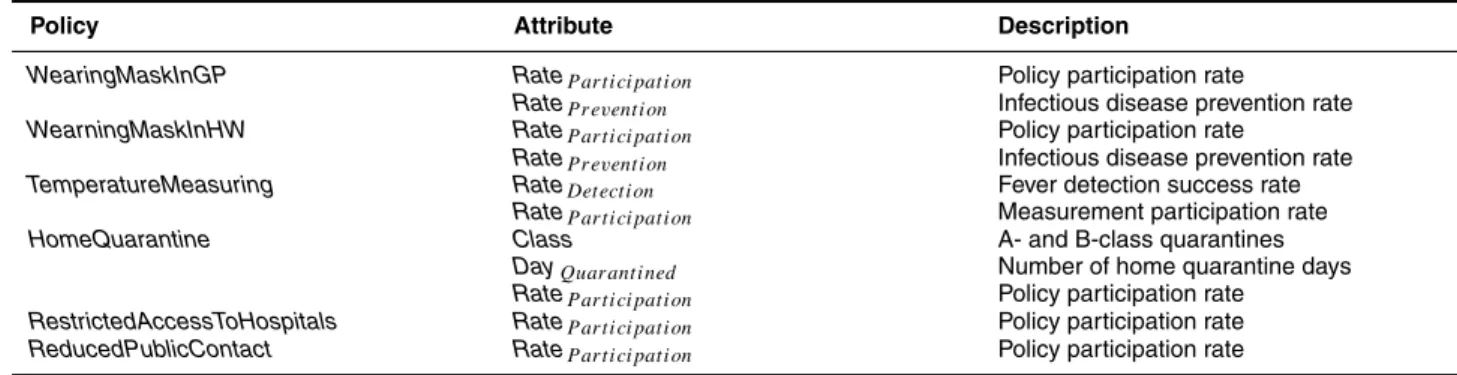
ca-Table 5. Public health policy parameters
Policy Attribute Description
WearingMaskInGP RateP art icipat ion Policy participation rate
RateP revent ion Infectious disease prevention rate
WearningMaskInHW RateP art icipat ion Policy participation rate
RateP revent ion Infectious disease prevention rate
TemperatureMeasuring RateDet ect ion Fever detection success rate
RateP art icipat ion Measurement participation rate
HomeQuarantine Class A- and B-class quarantines
DayQuarant ined Number of home quarantine days
RateP art icipat ion Policy participation rate
RestrictedAccessToHospitals RateP art icipat ion Policy participation rate
ReducedPublicContact RateP art icipat ion Policy participation rate
pable of manipulating the public health policy parameters listed in Table 5. Some environmental parameters (e.g.,
RateI nf ect ion, FrequencyCont act)can be derived from R0
us-ing the followus-ing equation: [22]
R0 = (avg. of social mirror identity × no. of neighbors
× Rcontact× Tcontact)× RInfection× PInfectious. 3.3 Input/Output Function and Simulation Flow
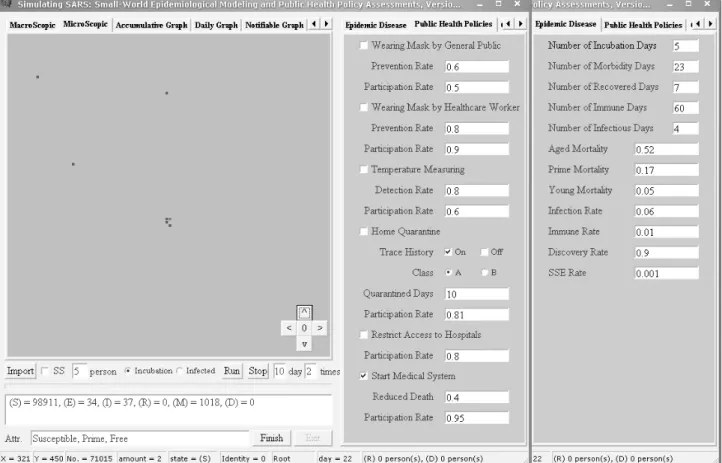
There are two methods for inputting and altering simu-lation parameters: via console and input files. Additionally, default values for each parameter are automatically loaded whenever the CASMIM simulation system is started with-out a specified input file. The simulation console consists of a set of modifiable parameters under environment, pop-ulation, epidemic, and public health policy tabs (Figure 5, Tables 3–5). The parameters are slightly simplified on the simulation console to facilitate variation. Table 6 shows an input data category display consisting of epidemic param-eter, imported case, and activated public health policy. In addition, the display console can be used to make changes to the statuses of individual agents on the fly (Tables 1 and 2). Alternatively, simulation parameters can be specified using an input file. Using the input file allows for con-trol over the full set of parameters, including setting data structures for agents and mirror identities.
The left-hand side of Figure 5 shows the geographical location of all individuals using two browser windows. The macroscopic browser window allows users to observe the propagation of an epidemic and the microscopic browser window allows users to observe detailed information on nosocomial infections, home quarantine, individual dis-ease status, and geographic mobility. Users can click on any cluster in the macroscopic graph to view microscopic details. CASMIM also produces daily statistical charts that reflect normal epidemic curves, accumulated epidemic curves, curves of the number of home quarantine individ-uals, and curves of the number of nosocomially infected individuals. At the end of a simulation, CASMIM creates
four log files for further study: user input and interaction processes, initial parameter sets, daily statistics on reported cases, and daily statistics on nosocomial infections. These interaction logs allow students to re-examine and analyze the simulation process.
Students can choose one of three ways to interact with CASMIM’s user interface. At the beginning of a simula-tion, a learner creates parameter sets via the user interface (far right-hand side of Figure 5), including the environ-mental and epidemic parameters mentioned in an earlier section. Next, the learner uses the button and input fields at the bottom right of Figure 5 to input data on imported cases, to trigger the simulation, and to advance time ac-cording to the epidemic outbreak or simulation timeline. Finally, as shown in the mid-section of Figure 5, the user can activate a public health policy according to the time-line and alter any parameter by activating or disabling it while the simulation is running. The simulation dynamic is affected immediately upon parameter modification. CAS-MIM’s simulation flowchart and system architecture are shown in Figures 4 and 6, respectively.
4. Instructional Experiments
After initializing the CASMIM simulation system and setting its parameters according to information distributed by the WHO and national health authorities (Tables 1 and 2), learners can simulate epidemic transmission dynamics in different areas and compare the effectiveness of various public health policies and disease prevention strategies. For example, knowing that SARS originated in China’s Guang-dong province allows users to view SARS cases in all other countries as imported and to use the number of cases an-nounced by local health authorities to determine transmis-sion source information (e.g., number of infectious indi-viduals entering a country, time steps during which they entered, and whether they entered as incubated or infected individuals). In three sets of instructional experiments we simulated public health policies at certain time steps ac-cording to actual announcements made by local health au-thorities, adjusting our environmental, epidemic, and
pub-Table 6. Input data category for simulating epidemic diseases
Category Attribute Description
Imported Cases Time Point Date when imported case occurred
Amount Number of patients
Phase Imported during incubation or illness period
Super-spreader Determines whether imported patient is a super-spreader
Public Health Policy Related Attributes
Run Day Number of execution days
Figure 6. Simulation flowchart
lic health policy parameters according to data reported by the WHO [37] and Kamps and Hoffmann [38].
4.1 Experiment Set 1: Comparing Simulation and Actual Case Results
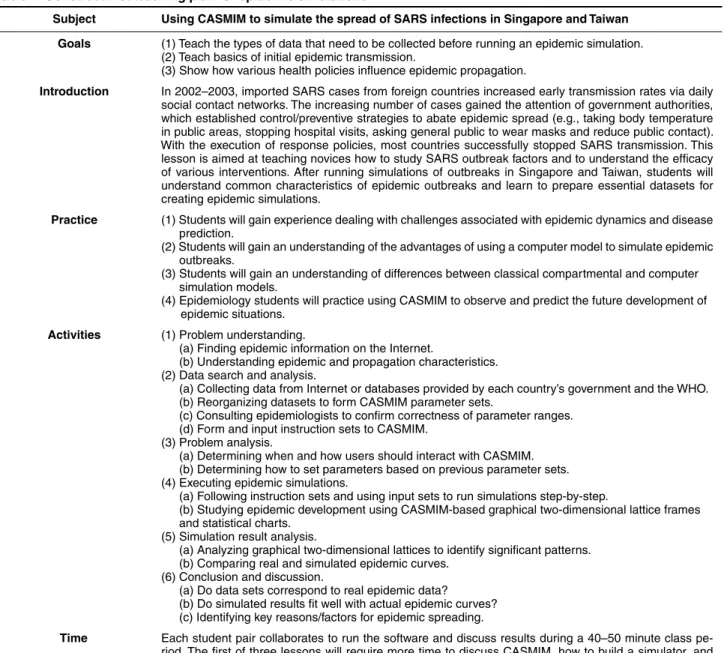
Experiment Set 1 helps students learn how to simulate the 2002–2003 SARS outbreaks in Singapore, Taiwan, and Toronto. Novices are instructed to follow the command sets shown in Tables 8–10 for running simulations. Learn-ing objectives include: understandLearn-ing the complexity of
epidemic characteristics, learning the advantages of a com-puter simulation model, and predicting outcomes. A teach-ing plan based on a constructive approach (e.g., object, goal, problems, methods, activities, and discussions) is pre-sented in Table 7. Before running the simulation, students need to construct a knowledge base of epidemic character-istics and the instructor needs to demonstrate how to re-organize the collected data to form CASMIM-compatible parameter sets. The next step is for learners to input the parameters and perform the instructional commands ac-cording to the input and simulation flowchart discussed
Table 7. Constructivist teaching plan for epidemic simulations
Subject Using CASMIM to simulate the spread of SARS infections in Singapore and Taiwan Goals (1) Teach the types of data that need to be collected before running an epidemic simulation.
(2) Teach basics of initial epidemic transmission.
(3) Show how various health policies influence epidemic propagation.
Introduction In 2002–2003, imported SARS cases from foreign countries increased early transmission rates via daily social contact networks. The increasing number of cases gained the attention of government authorities, which established control/preventive strategies to abate epidemic spread (e.g., taking body temperature in public areas, stopping hospital visits, asking general public to wear masks and reduce public contact). With the execution of response policies, most countries successfully stopped SARS transmission. This lesson is aimed at teaching novices how to study SARS outbreak factors and to understand the efficacy of various interventions. After running simulations of outbreaks in Singapore and Taiwan, students will understand common characteristics of epidemic outbreaks and learn to prepare essential datasets for creating epidemic simulations.
Practice (1) Students will gain experience dealing with challenges associated with epidemic dynamics and disease prediction.
(2) Students will gain an understanding of the advantages of using a computer model to simulate epidemic outbreaks.
(3) Students will gain an understanding of differences between classical compartmental and computer simulation models.
(4) Epidemiology students will practice using CASMIM to observe and predict the future development of epidemic situations.
Activities (1) Problem understanding.
(a) Finding epidemic information on the Internet.
(b) Understanding epidemic and propagation characteristics. (2) Data search and analysis.
(a) Collecting data from Internet or databases provided by each country’s government and the WHO. (b) Reorganizing datasets to form CASMIM parameter sets.
(c) Consulting epidemiologists to confirm correctness of parameter ranges. (d) Form and input instruction sets to CASMIM.
(3) Problem analysis.
(a) Determining when and how users should interact with CASMIM. (b) Determining how to set parameters based on previous parameter sets. (4) Executing epidemic simulations.
(a) Following instruction sets and using input sets to run simulations step-by-step.
(b) Studying epidemic development using CASMIM-based graphical two-dimensional lattice frames and statistical charts.
(5) Simulation result analysis.
(a) Analyzing graphical two-dimensional lattices to identify significant patterns. (b) Comparing real and simulated epidemic curves.
(6) Conclusion and discussion.
(a) Do data sets correspond to real epidemic data? (b) Do simulated results fit well with actual epidemic curves? (c) Identifying key reasons/factors for epidemic spreading.
Time Each student pair collaborates to run the software and discuss results during a 40–50 minute class pe-riod. The first of three lessons will require more time to discuss CASMIM, how to build a simulator, and background information on SARS outbreak scenarios.
Equipment and software Personal computer, CASMIM software, pre-test and post-test.
Software description CASMIM is a small-world computer simulation model that conceptualizes individual daily contact networks. It is suitable for simulating short-distance contagious epidemic enterovirus diseases such as SARS. The underlying network structure can be modified to simulate other types of disease with different infection routes (e.g., air transmission or sexual contact).
Discussion topics (1) How can different imported case distributions influence the spread of SARS in different countries? (2) What types of public health policies were executed to control the disease?
(3) Can you identify differences in disease trends between countries?
(4) What kinds of datasets need to be prepared before running this kind of simulation?
References Huang, C. Y., C. T. Sun, J. L. Hsieh, and H. Lin. 2004. Simulating SARS: Small-world epidemiological modeling and public health policy assessments. Journal of Artificial Societies and Social Simulation 7(4). Available online at http://jasss.soc.surrey.ac.uk/7/4/2. html.
Watts, D. J. 2003. Six Degrees. New York: W. W. Norton & Company. Related Material World Health Organization, http://www.who.int/en/.
Taiwan Disease Control Center, http://www.cdc.gov.tw/index1024.htm. Ministry of Health of Singapore, http://www.moh.gov.sg/corp/index.doc.
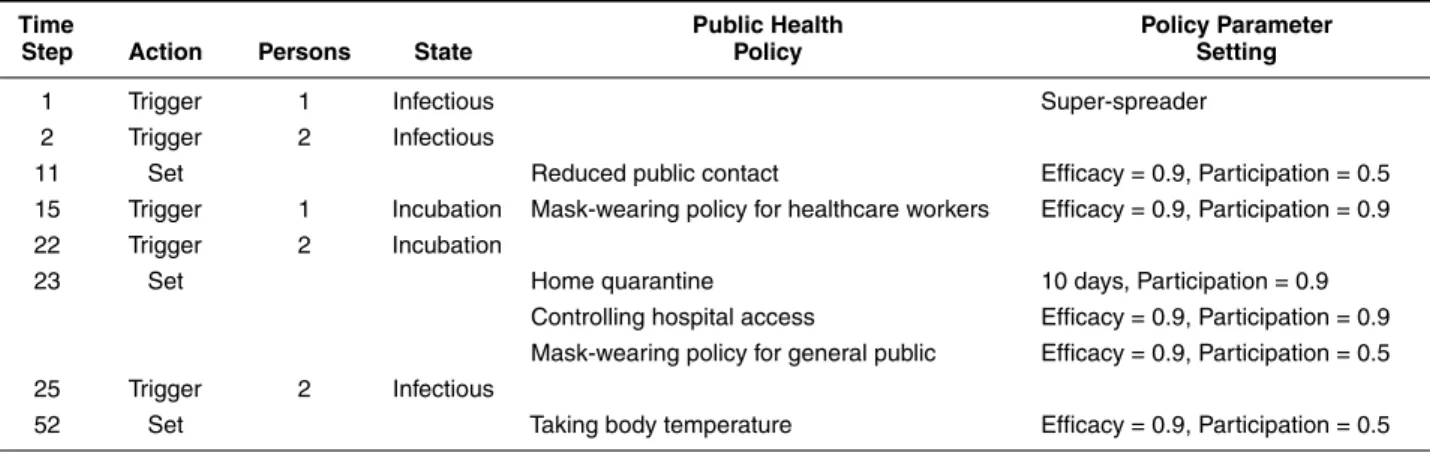
Table 8. Singapore instructional experiment input data
Time Public Health Policy Parameter
Step Action Persons State Policy Setting
1 Trigger 1 Infectious Super-spreader
2 Trigger 2 Infectious
11 Set Reduced public contact Efficacy = 0.9, Participation = 0.5 15 Trigger 1 Incubation Mask-wearing policy for healthcare workers Efficacy = 0.9, Participation = 0.9 22 Trigger 2 Incubation
23 Set Home quarantine 10 days, Participation = 0.9
Controlling hospital access Efficacy = 0.9, Participation = 0.9 Mask-wearing policy for general public Efficacy = 0.9, Participation = 0.5 25 Trigger 2 Infectious
52 Set Taking body temperature Efficacy = 0.9, Participation = 0.5
Table 9. Taipei instructional experiment input data
Time Public Health Policy Parameter
Step Action Persons State Policy Setting
1 Trigger 1 Infectious 2 Trigger 4 Incubation 9 Trigger 1 Incubation 11 Trigger 2 Infectious
12 Trigger 2 Infectious Home quarantine 10 days, Participation = 0.9 14 Trigger 1 Infectious
27 Trigger 1 Infectious Mask-wearing policy for healthcare workers Efficacy = 0.9, Participation = 0.9 47 Set Controlling hospital access Efficacy = 0.9, Participation = 0.9
53 Set Home quarantine 14 days, Participation = 0.9
Mask-wearing policy for general public Efficacy = 0.9, Participation = 0.5
74 Set Home quarantine 10 days, Participation = 0.9
88 Set Taking body temperature Efficacy = 0.9, Participation = 0.5
Table 10. Toronto instructional experiment input data
Time Public Health Policy Parameter
Step Action Persons State Policy Setting
1 Trigger 1 Infectious 6 Trigger 1 Infectious
19 Trigger 1 Infectious Mask-wearing policy for healthcare workers Efficacy = 0.9, Participation = 0.9 Reduced public contact Efficacy = 0.9, Participation = 0.5 30 Trigger 1 Infectious
37 Set Controlling hospital access Efficacy = 0.9, Participation = 0.9 Home quarantine 10 days, Participation = 0.9 38 Trigger 1 Infectious
68 Close All public health policies previously opened
91 Set Mask-wearing policy for healthcare workers Efficacy = 0.9, Participation = 0.9 112 Set All public health policies previously closed
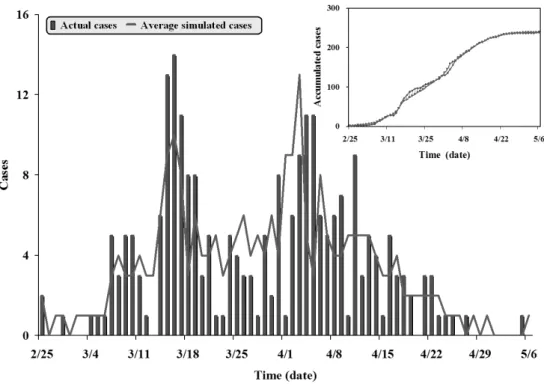
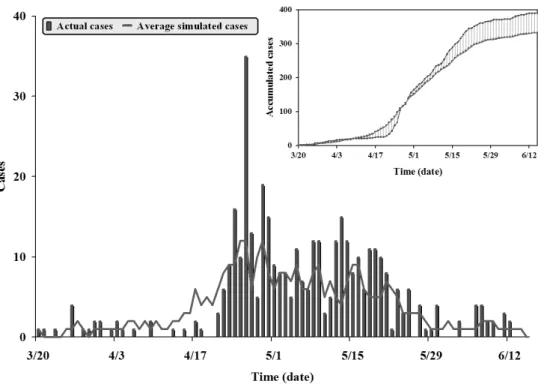
Figure 7. A comparison of actual and simulated epidemic results for the SARS outbreak in Singapore. The bars represent actual
reported cases, the line represents an average of results from 20 simulation runs
in Section 3.3. Students also need instruction in reading simulation results, including statistical reports and charts.
4.1.1 Scenario 1: Singapore SARS Outbreak
A comparison of actual and simulated SARS cases in Singapore indicates agreement in terms of two peak out-breaks that occurred between February 25 and May 5, 2003 (Figure 7). Emergency public health policies were not acti-vated following the first outbreak, which was attributed to imported cases. The second outbreak was attributed to the compound effects of secondary infections. Several emer-gency policies were put into effect on March 24, including a ban on visits to patients in hospitals or under home quaran-tine. The number of new cases dropped dramatically at the beginning of June; soon afterwards, the WHO announced that the disease was under control.
4.1.2 Scenario 2: Taipei SARS Outbreak
Our Taipei simulation included several public health policies enforced by that city’s government, including mul-tiple grades of home quarantine and a mask-wearing re-quirement for all public bus and train passengers (Table 9). As shown in Figure 8, the simulated results had a close fit with the probable case curve published by the Taiwanese health authority on September 28, 2003—a major spike
fol-lowed by several smaller outbreaks. The higher concentra-tion in the Taipei curve compared to Singapore’s was likely due to late case discoveries, delays in seeking treatment, illness cover-ups, and the large number of cases imported by travelers returning from Hong Kong. In Singapore, all imported cases were reported prior to the first outbreak; the second wave was the result of compound infections. The s-curve for the Taiwan situation is more representative of a typical infection pattern.
4.1.3 Scenario 2: Toronto SARS Outbreak
The SARS scenario in Toronto consisted of two major waves with almost no new cases in between (Figure 9). However, after a re-examination of the August 2003 data, the Canadian authorities acknowledged several additional cases during the lull period. According to our simulation, the second wave would not have been as severe if strict pub-lic health popub-licies had been enforced for a longer period following the first wave. In the instructional experiment de-scribed below, we relaxed epidemic control measures after the first wave subsided (Table 10). The simulation conse-quently produced a second spike within a few days of the actual spike reported by Toronto health authorities. Our re-sults support the conclusion by Kamps and Hoffmann [38] that the Toronto government canceled its control measures
Figure 8. A comparison of actual and simulated epidemic results for the SARS outbreak in Taipei
too quickly. Because of increased contact between patients and visitors and relaxed rules on health care workers wear-ing masks and/or respirators, Toronto experienced a second wave of nosocomial transmission.
Although most of the epidemic characteristics of these three scenarios were similar or identical, and because all three governments enforced most of the prevention poli-cies suggested by the WHO, there was great variation in simulation results as a result of differences in initial ex-ecution dates and participation rates. Instructors can use this variation in data to present information on the effects of underlying social networks on epidemic transmission (e.g., small-world and clustering properties). For example, one important lesson is that distance between individu-als (physical or geographical) is no longer the key factor in epidemic outbreaks that it once was, because modern transportation systems allow people to visit several fixed locations on a daily basis or to fly halfway around the world in less than 24 hours [21, 22].
4.2 Experiment Set 2: Analyzing Public Health Policies
In Experiment Set 2, students can analyze the effects of three public health policies executed during the 2003 SARS outbreak (Table 11): taking body temperature, wearing of protective masks by the general public, and wearing of masks by healthcare workers. To build an understanding of the efficacies of these policies, students should prac-tice altering the parameters of the command sets of these three actions. For example, they can manipulate protection rates (e.g., 25%, 50%, 70%, and 95%) to represent the ef-fectiveness of general, carbon-activated, medical, and N95 masks, respectively. Students should also be given statis-tical charts for comparing the results of the various public health policies. The special statistical chart for nosocomial transmission can be used to analyze the efficacy of banning hospital visits.
4.2.1 Taking Body Temperature
The Singaporean and Taiwanese governments imple-mented temperature measurement policies during the SARS epidemic, going so far as to launch national cam-paigns that included installing temperature-monitoring equipment and setting up manual temperature measure-ment stations at various governmeasure-ment buildings, clinics, and public transportation facilities. According to our simula-tion results, when such policies were both comprehensive and compulsory, they reduced the number of feverish indi-viduals entering public places. However, in the real world this policy is difficult to set up and enforce, because imple-mentation methods tend to vary, oversights are common, and an unknown number of individuals manage to avoid having their temperatures taken. Our results suggest that a participation rate of between 80% and 90% is required for this public health policy to have a positive effect on
control-ling a SARS-like epidemic (Figure 10); it has little effect at a rate of 65% or lower. The policy also incurs significant social costs that include distributing thermometers, setting up temperature screening stations, and employing work-ers to take manual temperature measurements at various public facilities and medical clinics.
4.2.2 Wearing Masks with Different Protection Levels: General Public Versus Healthcare Workers
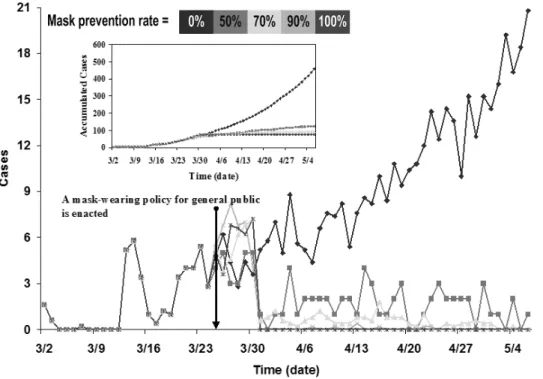
The efforts of the governments of Taiwan and Hong Kong to promote general mask-wearing policies led to hoarding and panic buying. Masks are categorized accord-ing to grade: ordinary, surgical, etc. In Taiwan, a serious shortage of professional masks for medical staff occurred following a rush by the general population to purchase masks regardless of grade; this triggered a debate over the necessity of wearing N95 respirator masks outside of hos-pitals and clinics. According to the results of a simulation that we ran to analyze this policy, ordinary and surgical masks succeeded in controlling the epidemic outbreak as long as they were worn consistently throughout the desired time period (Figure 11). At a prevention efficiency of 65% or more (meaning that the mask covered at least the mouth and nose), the epidemic could be controlled but not elimi-nated. When wearing ordinary masks, medical staff mem-bers still had relatively high infection rates (Figures 11 and 12). These personnel clearly benefited from wearing N95 and other high-resistance masks in hospitals and clinics. According to these simulation results, we suggest that the general public should not be required to wear higher-grade masks, which instead should be reserved for medical staff and healthcare workers.
Students should study the characteristics and properties of individual public health policies before running simu-lations to ensure reasonable estimates of efficacy and par-ticipation rates and proper implementation of each pub-lic health popub-licy in the simulation model. For example, in the area of mask-wearing, the Taiwanese and Singaporean governments tried to enforce a requirement that all health-care workers wear high-protection masks, but only issued advisories for the general public. Accordingly, the degree, range, and target populations for these two public health policies were very different—a point that needs to be em-phasized to novice learners. Furthermore, students should study frameworks for analyzing public health policies prior to running simulations [23].
4.2.3 Experiment Set 3: Assessing Public Health Policy Suites
The learning objectives for Experiment Set 3 were showing students how to build combinations of public health policies for assessing efficacy and estimating the so-cial costs of different combinations (Table 12). When faced with a new epidemic outbreak, decision-makers must con-sider various combinations of public health policies and
Figure 10. Results from an instructional simulation experiment focused on temperature measurement policy at different participation
levels. We used the eight imported cases reported in Singapore to trigger the simulation. In each 66-day simulation run, the policy was activated on day 24
Figure 11. Results from an instructional simulation experiment focused on the impact of mask-wearing by the general public,
Table 11. Constructivist teaching plan for public health policy assessment using computer simulations
Subject Using the CASMIM simulator to analyze public health policy efficacy
Goal To understand the properties of individual health policies, students run simulations at different efficacy levels.
Introduction Efforts by the Taiwan and Hong Kong governments to promote general mask-wearing led to hoarding and panic buying. In Taiwan, this resulted in a serious shortage of professional-grade masks for medical staff and triggered a debate on the necessity of wearing N95 respirator masks outside of hospitals and clinics. Simulations of general public and healthcare mask-wearing policies at different protection levels are used to teach novices public health policy concepts.
Practice (1) Students will gain greater understanding of the properties and characteristics of individual health policies.
(2) Health authorities and policy makers will gain greater understanding of the degrees to which health policies should be executed, taking into account efficacy and participation rates.
Activities (1) Problem understanding.
(a) Looking up health policy information for specific epidemics on the Internet.
(b) Consulting health policy makers to understand how they think and what they need for decision-making.
(2) Advance analysis of health policy properties and characteristics.
(a) Recognizing how each policy affects individuals with different disease statuses.
(b) Transforming health policy facts to parameters that can be input and implemented on CASMIM. (c) Consulting with health policy makers and epidemiologists to verify reasonable parameter value ranges.
(3) Executing health policy simulations.
(a) Simulating an epidemic without activating any health policy to serve as control.
(b) Enabling single health policies according to instruction sets and inputting efficacy and participation rate parameter data.
(c) Altering efficacy and participation rates.
(d) When using policy suites, disabling all but one policy to determine its effects via steps b and c. (4) Simulation results analysis.
(a) Comparing control and experimental group curves. (5) Discussion
(a) Comparing emerging experimental and control group trends. (b) Drawing conclusions about simulation results.
(c) Identifying relationships between simulation and actual results.
Time Student pairs collaborate to run the software and discuss results during a 15–20 minute period. Equipment and software Personal computer, CASMIM software, pre-test and post-test.
Software description CASMIM is a small-world computer simulation model that conceptualizes individual daily contact networks. It is suitable for simulating short-distance contagious epidemic enterovirus diseases such as SARS. The underlying network structure can be modified to simulate other types of disease with different infection routes (e.g., air transmission or sexual contact).
Discussion topics (1) Which mask protection level is sufficient to offer a minimum of protection for the general public? (2) Which mask protection level is sufficient for hospital and clinic healthcare workers?
(3) After comparing both mask-wearing policies, decide on a policy for the distribution of masks at difference protection levels to different user populations.
Reference Hsieh, J. L., C. Y. Huang, C. T. Sun, and Y. M. A. Chen. 2005. Using the CASMIM small-world epidemic model to analyze public health policies. In Proceedings of the Western Multiconference, New Orleans, LA, pp. 63–9.
Related material (1) World Health Organization, http://www.who.int/en/
(2) Taiwan Disease Control Center, http://www.cdc.gov.tw/index1024.htm (3) Ministry of Health of Singapore, http://www.moh.gov.sg/corp/index.doc
decide when to activate them. The compound effects of different combinations can differ a great deal because of the scale, efficacy, and target of each policy. Instructional samples are divided in terms of how individual govern-ments decide to execute public health policies, alone or in combination. Using the suites shown in Figure 13 as an example, an imaginary health authority decides to en-force a policy suite of taking body temperatures,
restrict-ing hospital visits, the required wearrestrict-ing of high-efficiency masks by healthcare workers, and an advisory for the gen-eral public to wear less efficient masks and to reduce pub-lic contact. Social costs clearly vary according to popub-licy combination, allowing for the teaching of the concept of cost-effectiveness. Instructional samples representing four possible public health policy suites executed by the Singa-porean health authority are shown in Figure 13.
Accord-Figure 12. Results from an instructional simulation experiment focused on the impact of mask-wearing by healthcare workers in
hospitals, comparing different mask protection levels
ing to the results presented in this figure, a combination of mask-wearing by the general public and reduced con-tact in public places was best for suppressing the spread of disease. Enforced mask-wearing entails some social and fi-nancial costs, but limited public contact does not. Further-more, masks address epidemics at their source—disease transmission.
Simulation results also suggest that a combination of temperature measurement, restricted hospital visitations, and mask-wearing by healthcare workers should be consid-ered a remedial reaction to a contagious disease outbreak, as these cannot help patients who are in the incubation stage or suffering from minor symptoms. In addition, this policy suite requires substantial amounts of labor and material re-sources. The combination of home quarantine and reduced contact in public places has high social costs, with results dependent upon how well the isolation guidelines are fol-lowed. Numerous instances of intra-family infections were reported during the actual 2002–2003 SARS epidemic— evidence that certain prevention strategies were ineffective in controlling it.
For simultaneously assessing efficacy and social costs, instructors should assist learners in recognizing differences in how governments implement public health policies and in discussing limited resource allocation. Certain resources
may be extremely limited or non-existent for an uniden-tified large-scale epidemic outbreak—for instance, vac-cines, hospital beds, healthcare workers, or high-protection masks. Allocating limited resources should be a central learning objective for students of large-scale epidemic simulations.
5. Evaluation 5.1 Participants
Participants were 34 college students recruited from a private university in north Taiwan. They were assigned to working pairs for collaboration and for discussing simula-tion results.
5.2 Procedure
The 17 participant pairs were given three instructional assignments. For each one, students were given a pre-test to examine their understanding of epidemic dynamics, verbal and written information on simulation goals, tools for using simulation results to answer core questions, and a post-test shown in Appendix A to determine the effects of the CASMIM simulation tool on learning.
Table 12. Constructivist teaching plan for assessing epidemic prevention strategies
Subject Use CASMIM to simulate different combinations of public health policies in response to an outbreak of SARS
Goal Students test various combinations in order to identify the best for mitigating the epidemic at a reasonable level of social costs.
Introduction When faced with a new disease outbreak, decision-makers must consider various public health policies and decide when to activate them. The compound effects of different policy suites can differ a great deal accord-ing to each policy’s scale, efficacy, and targeted goal. Social costs must also be taken into consideration— for example, establishing cooperation between health authorities and enforcement agencies, the cost of a public relations campaign to encourage mask-wearing by the general public, etc.
Practice Students will practice using a computer simulation model to assess the efficacies and social costs of various health policies.
Activities (1) Problem understanding.
(a) Summarizing characteristics and properties of each health policy from Experiment Set 2. (b) Consulting health policy makers to learn how and why they implement multiple health policies. (2) Analyzing possible health policy combinations.
(a) Forming several health policy combinations.
(b) Consulting with health policy makers and epidemiologists to gain greater understanding of potential health policy combinations.
(c) Using potential health policy combinations to build CASMIM instruction sets. (3) Executing health policy simulations.
(a) Simulating an epidemic without activating any health policy to serve as a control. (b) Enabling health policy suites according to instruction sets and inputting parameter data. (4) Simulation results analysis.
(a) Comparing control and experimental group curves.
(b) Analyzing statistical charts for each health policy’s efficacy and efficiency. (5) Discussion.
(a) Comparing efficacies of different combinations of health policies. (b) Forming recommendations for health authorities.
Time Each student pair collaborates to run the software and discuss results during a 10–15 minute period. Equipment and software Personal computer, CASMIM software, pre-test and post-test.
Software description CASMIM is a small-world computer simulation model that conceptualizes individual daily contact networks. It is suitable for simulating short-distance contagious epidemic enterovirus diseases such as SARS. The underlying network structure can be modified to simulate other types of disease with different infection routes (e.g., air transmission or sexual contact).
Discussion topics (1) Which policy combinations are most effective for abating the spread of SARS? Create a list in order of effectiveness.
(2) Which policy combinations have the lowest social costs? List in order.
Based on the pre-established data for this lesson, the correct order for most-effective and lowest social costs should be the following.
• A-class home quarantine for 10 days and reduced public contact. • Wide-scale taking of body temperatures and hospital visitation restrictions.
• Wide-scale taking of body temperatures, hospital visitation restrictions, and mask-wearing by healthcare workers.
• Public mask-wearing and reduced public contact.
Reference Hsieh, J. L., C. Y. Huang, C. T. Sun, and Y. M. A. Chen. 2005. Using the CASMIM small-world epidemic model to analyze public health policies. In Proceedings of the Western Multiconference, New Orleans, LA, pp. 63–9.
Related material World Health Organization, http://www.who.int/en/.
Taiwan Disease Control Center, http://www.cdc.gov.tw/index1024.htm. Ministry of Health of Singapore, http://www.moh.gov.sg/corp/index.doc.
5.3 Results
Pre-test/post-test scores were measured on a scale of 0 to 50; scores for individual topics ranged from 0 to 10. Re-sults from a paired-sample t-test indicate statistically sig-nificant improvement in overall understanding of epidemic
concepts (pre-test: M= 31.71, SD = 3.11; post-test: M =
35.15, SD= 2.77; t = –5.36, p < 0.001). Specifically, the results show a significant difference in experiment sets 1
(comparing simulation and actual case results between
out-breaks in Singapore and Taiwan; pre-test: M= 6.12, SD =
1.01; post-test: M = 6.91, SD = 1.44; t = –2.17, p < 0.05) and 3-1 (assessing the efficacies of different combinations
of public health policies; pre-test: M = 6.59, SD = 1.37;
post-test: M= 8.41, SD = 0.71; t = –5.12, p < 0.001). No significant differences were noted for experiment sets 2-1 (analyzing the effects of the wearing of protective masks by the general public; pre-test: M= 6.24, SD = 1.15;
post-Figure 13. A comparison of various public health policy suites in the third instructional simulation experiment. We used the eight
imported cases reported in Singapore to trigger the simulation. Policy suites went into effect on day 24 of our 66-day simulations. Suite 1 (cyan diamonds): A-class home quarantine for 10 days and reduced public contact; suite 2 (red triangles): wide-scale taking of body temperatures and a restriction on hospital visitations; suite 3 (green crosses): wide-scale taking of body temperatures, a restriction on hospital visitations, and mask-wearing by healthcare workers; suite 4 (pink squares): public mask-wearing and reduced public contact
test: M= 6.53, SD = 1.23; t = –1.32, ns), 2-2 (analyzing
the effects of the wearing of masks by healthcare workers;
pre-test: M = 6.76, SD = 1.09; post-test: M = 7.06, SD =
0.66; t = –1.32, ns) or 3-2 (estimating the social costs of different combinations of public health policies; pre-test:
M = 6.00, SD = 1.37; post-test: M = 6.24, SD = 1.15;
t = –1.00, ns). 5.4 Discussion
As predicted, participants with prior epidemic sim-ulation experience performed better on post-test items addressing epidemic-related concepts. However, detailed analyses of responses for each experiment set indicate in-sufficient understanding of epidemic transmission dynam-ics on the part of participants. Possible explanations in-clude the following: (i) fear or misunderstanding of SARS, which may have interfered with the participants’ decisions concerning protective equipment; (ii) insufficient time for novices to become familiar with epidemic jargon; or (iii) lack of experience with budgeting social costs. We there-fore investigated the results on participant perceptions of
simulation issues in an attempt to identify specific reasons for participant choices and misconceptions.
5.4.1 Experiment Set 1: Comparing Simulation and Actual Results for Singapore and Taiwan Outbreaks
The purpose of this set was to guide novices through the simulation process so that they could decide for themselves which data or disease parameters are required for simula-tion results to resemble actual case results. We gave par-ticipants simulation scenarios to picture SARS outbreaks and instructions on manipulating parameters to generate results for follow-up discussion. The pre-test and post-test questionnaires contained items on 13 parameters: seven real (date imported cases occurred, number of imported cases, activated date of public health policies, population size, daily number of suspected infected individuals, daily number of reported infected individuals, and total num-ber of deaths) and six dummy (infected rate for imported cases, location for activating public health policies, public health policy records, total number of infected individuals,
daily number of deaths, and human contact history for each infected individual).
Of the seven real parameters, most participants rec-ognized five as important to simulating epidemic trans-mission dynamics; exceptions were “population size” and “total number of deaths”. The results suggest that the par-ticipating students were not aware that the relative scale of simulated population size and the number of deaths can serve as determinants for evaluating simulation results. Of the six dummy parameters, four were generally recognized as unnecessary; here the exceptions were “infected rate of imported cases” and “daily number of deaths”. A possible explanation is CASMIM’s social mirror identity feature, which emphasizes the effect of human contact on epidemic propagation. Accordingly, there is no need to input the in-fected rate of imported cases (except for super-spreaders) in the simulation process. Some participants gave more weight than necessary to the infected rate while neglecting the significant effect of human contact. Others misunder-stood that while the total number of deaths is required for estimating the relative scale between simulation and actual case results, the daily number of deaths is unnecessary for an outbreak simulation.
5.4.2 Experiment Set 2: Analyzing the Effects of Mask-Wearing by the General Public and Healthcare Workers
Participants were instructed to work with masks having different protection levels according to the separate needs of healthcare workers and the general public. The students were encouraged to collaborate on a decision regarding which mask protection level (0%, 10–50%, 60–70%, 80– 90%, or 100%) was best for each population to avoid in-fection; an added factor was a shortage of professional-grade masks. As stated above, no statistically significant improvement between pre- and post-test scores was noted for sets 2-1 or 2-2. A detailed review of set 2-1 test re-sponses revealed the following: (i) almost one-half of the participants (41.2%) chose masks with adequate protection levels in both pre- and post-tests, which may be attributed to the effect of government-sponsored advertisements during the actual SARS outbreak; (ii) about one-fourth (23.5%) of the participants chose masks with lower-protection rates for the general public in their post-test responses (50% ver-sus 60–70%), perhaps due to their recognizing the needs of healthcare workers and the shortage of professional masks; (iii) 11.8% of the participants still favored masks with high protection levels (80–90%) when they learned that such masks could not only control but perhaps eradicate the SARS virus, perhaps because of their personal fears; an-other 11.8% said they were willing to buy the more costly professional masks to protect themselves. The results for set 2-2 indicate a very small difference between pre- and post-test preferences (100% and 80–90% protection lev-els). They also indicate that the participants believed that health workers deserved better protection as long as
pro-fessional masks were available, comfortable to wear while working, and inexpensive.
5.4.3 Experiment Set 3: Assessing the Efficacies and Social Costs of Different Public Health Policy Suites
Participants simulated each public health policy to gather data on efficacy and efficiency. They were taught how to observe the results of activating or disabling in-dividual policies and how to test various combinations. The purpose of this set was to have participants identify which combinations were capable of abating the SARS epidemic within reasonable budget constraints. The set 3-1 results indicate statistically significant improvement re-garding participant decisions on the efficacy rates of four public health policy combinations; that is, participants suc-cessfully learned the target information as conveyed via the simulation. It appears that follow-up guidance and expla-nations of simulation results by an instructor are very im-portant for enhancing learning in this area. Test responses show that the participants did not acknowledge the im-portance of daily human contact on outbreaks of short-distance contagious diseases such as SARS. Ptest re-sponses show that just under one-half of the students (47%) recognized the combination of “public mask-wearing and reduced public contact” as being the least effective among the four public health policy combinations. A possible ex-planation is that they were not aware of the dual effects of public mask-wearing: protecting oneself from infection and preventing infected individuals from spreading the dis-ease. Other problems were noted for two policies: “A-class home quarantine for 10 days” and “wide-scale taking of body temperatures”. The efficacy of the first may be re-duced by difficulties associated with quarantining mem-bers of an infected individual’s family prior to the individ-ual’s infection being reported. The efficacy of the second may be reduced because of instrument inaccuracy, diffi-culties associated with identifying individuals who are in an incubation period, and problems putting the policy into effect.
As for the absence of statistical significance for the set 3-2 results, we offer two possible explanations: the lack of familiarity with budgeting issues among the college student participants and/or the insufficient clarity of the simulation results on estimating the social costs.
6. Conclusions
The use of computer-based social simulations to explore social issues and disease epidemics has increased rapidly in the past two decades. They can also serve as powerful instructional tools for providing learners with rich and low-cost opportunities to construct comprehensive understand-ings of simulation problems. For this paper we designed three sets of experiments to evaluate the utility of CAS-MIM (a simulation system that meets the requirements of