行政院國家科學委員會專題研究計畫 成果報告
以蛋白質體學分析中草藥萃取物處理的人類肝癌細胞(2/2)
計畫類別: 個別型計畫 計畫編號: NSC93-2313-B-002-025- 執行期間: 93 年 08 月 01 日至 94 年 07 月 31 日 執行單位: 國立臺灣大學食品科技研究所 計畫主持人: 張鴻民 報告類型: 完整報告 處理方式: 本計畫可公開查詢中 華 民 國 94 年 12 月 8 日
中文摘要 應用蛋白質體學策略 (proteomics approach) 以蛋白質表現層面來看不同藥物 及濃度處理之間的蛋白質表現有無差異,藉此來尋找受其調控的下游基因產物。 蛋白質體可分析出同ㄧ物種的細胞或組織在不同環境下所表現全部蛋白質圖譜 的差異。在等電點凝膠電泳膠體電壓及電流試驗結果中,可用以預測溶液所含的 離子濃度。在膠體影像分析結果方面,蛋白質點的配對率除Hep3BMC 為 31.2 ﹪, 其它癌細胞約50 ﹪。在體積差異率 50 ﹪結果可知,AP 所造成的蛋白質變化最 大。再以不同濃度AP 萃取物處理結果可知,HepG2 及 Hep3B 均隨藥物濃度增加, 蛋白質體積差異率數目也隨之增加。而不同處理的膠體蛋白質含量相關性結果, 以HepG2 30 µg /mL AP(r=0.91)及 Hep3B 10 µg / mL(r=0.92)表示含量最接近控制 組。在不同處理間蛋白質點體積差異分怖結果,可知不同蛋白質受到不同處理的 變化情形。將欲分析蛋白質以介質輔助雷射吸附游離離子化飛行時間(MALDI-TOF) 質譜儀的偵測與資料庫做比對,結果分別有13 個蛋白質被檢測出,這些蛋白質 顯示出藥物處理所造成的細胞生理變化。本研究結果發現以蛋白質體研究中草藥 處理癌症是一個可行的方法,可為肝癌研究提供診斷處理方面的基礎資訊,並了 解不同中草藥之作用,然中藥中具有可抑制癌細胞的有效成分,值得再做進一步 之探討。 Abstract
Proteome is a systematic analysis of the proteins expressed by a cell or tissue. Proteomics approach has been utilized to explain this observation. By using IEF and SDS-PAGE
separation, we have compared the protein expression pattern in the different treatments and degree of protein expression. In IEF voltage and current assay result showed, we can find that it can be used to forecast with ion strength of solution. Image analysis result showed that percentage of matched spots of Hep3BMC is 31.2 %, other treatments are probably 50 % .In
fifty percent of volume different results, great change of protein by AP treated. Then with various concentrations of AP treatment, more change of HepG2 and Hep3B by concentration increased. Result of correlation of protein content by various treatments, we can know that contents of gel protein by HepG2 30 µg/mL AP (r=0.91) and Hep3B 10µg/mL(r=0.92) are close to control gel. In results of percentage of volume different of protein spots,we can find that states of different proteins changed by various treatment. In the in-gel digestion method, protein spots were digested by trypsin and the peptide mass fingerprints were analyzed by matrix assisted laser desorption ionization–time of flight (MALDI-TOF) mass spectrometry. The identify of protein was searched by comparing to the internet database. Thirteen proteins were identified after those treatments. The differential expressions of those protein spots indicated changes of cell physiology by herb treated. This provides an evidence based on information in clinical treatment for liver disease research. Proteomic study would be worth to probe into the feasible way for herb treatments in cancer. However, useful components of herbs which have inhibition on cancer treatment are worth doing further research.
實驗方法 一、 樣品製備 將中藥材以中藥磨粉機研磨,放入低溫冷藏櫃(4 ℃)中保存。將樣品 以甲醇(1/10,w/v)於室溫下萃取 24 小時,過濾除去殘渣得甲醇萃取液,並 以減壓濃縮機濃縮抽乾,備用的甲醇萃取物保存於乾燥箱。實驗時再加入 DMSO 使凍乾物溶解得 DMSO 回溶液;將甲醇萃取後之殘渣以水(1/10,w/v) 比例於室溫下萃取24 小時,過濾後行冷凍乾燥得乾燥水萃取物,保存於乾 燥箱備用。 二、 細胞株之繼代培養及保存 (1) 繼代培養(subculture)
人類肝癌細胞株HepG2 細胞及 Hep3B 細胞分別以 10 ﹪FBS/MEM 及 10 ﹪3B-DMEM 培養液,而 MCF7 及 CCD966SK 以 10 ﹪FBSDMEM 培養液,均
在37 ℃、5 % CO2條件下培養。細胞以倒立式顯微鏡觀察,待細胞長滿為
單層(monolayer)時,進行繼代培養(subculture)。除去舊培養液,以磷酸 緩衝溶液(Dulbecco’s phosphate-buffered saline,PBS)清洗兩次,再加入 PBS 及trypsin-EDTA 液輕微搖晃(使 trypsin-EDTA 最終濃度為 0.1%),以倒立式 顯微鏡觀察,當細胞要分離而呈現圓粒狀時,吸掉trypsin-EDTA 溶液,加 入上述培養液將細胞打散並收集,再以2 x 10⁶ cells / mL 的細胞濃度進行繼 代培養(洪,2000)。 (2)保存 將收集細胞液之密度調至5 x 10⁶ cells / mL,加入 1 ﹪(v/v)DMSO, 混 合均勻後取1.0 mL 細胞液置於細胞冷凍管中,將冷凍管裝入於有異丙醇之 冷凍盒,放入-80 ℃冰箱經 12 小時後再將冷凍管移入液態氮中保存(洪,
2000)。 三、 細胞生長形態 將不同藥物之不同甲醇萃取液直接加入培養癌細胞之培養液中使其濃 度分別為0、0.1、0.3、0.5 %(v/v),在 24 小時作用時間處理下,分別以 200 倍倒立式光學顯微鏡觀察細胞數目變化並記錄細胞形態的變化,如細胞形態 和控制組相比有不同(形態萎縮、細胞不再相連結、細胞呈圓形甚至浮起等) 及細胞數目和控制組相比有明顯不同(Huang et al., 2001)者。 四、 細胞生長及毒性評估 MTT 法 調整細胞至合適的濃度,再各取50 µL 的細胞懸浮液加入於 96 well 的組
織培養盤中,使HepG2 和 Hep3B 之細胞數分別為 5×10⁴ 和 105 cells/mL。置
於培養箱(37 ℃,5 ﹪CO2)中24 小時後換 50 µL 新鮮培養液及加入 50µL 不同濃度的樣品液,使最終藥物濃度分別為甲醇萃取液(0.1、0.2、0.3、0.4、 0.5 %(v/v))或 DMSO 回溶液(0、10、30、50、70、100 µg/mL),培養 24、 48 及 72 小時。其後,除去培養液並以 PBS 清洗,加入 100 µL MTT 液(1 mg/mL)。 在培養箱中反應4 小時之後將液體除去,再加入 100 µL DMSO 使藍色結晶溶 解,以ELISA reader 測定波長 570 nm 和輔助波長如 630 nm 作為參考波長之吸 光值( Wang, 2000)。 五、 蛋白質測定試驗 SRB 法 調整細胞至合適的濃度,再各取50 µL 的細胞懸浮液加入於 96 well 的組織培養盤
℃,5 ﹪CO2)中24 小時後換 50 µL 新鮮培養液及加入 50µL 不同藥物濃度之 DMSO
回溶樣品液,使最終藥物濃度為0、10、30 和 50 µg/mL,培養 24、48 及 72 小時。
其後,除去培養液並以PBS 清洗,再加入 50 µL 50 % TCA 於 4℃下靜置 30 分鐘, 除去TCA 並以 PBS 清洗,置室溫下風乾後加入 40 µL 0.4 % SRB(溶於 0.1 % acetic acid)作用 20 分鐘,再以 0.1 % acetic acid 清洗 3 次並置室溫下風乾。乾燥後觀 察型態並加入100 µL 10 mM Tris base(pH 10.5),使紅色結晶溶解,以ELISA reader 測
定波長490 nm 和輔助波長如 630 nm 作為參考波長之吸光值(Wang,2000)。 7.1 蛋白質萃取 將肝癌細胞冷凍乾燥後,以1:5(v/v)的比例加入 lysis buffer,輔以超音 波及震盪各5 分鐘,使細胞分散及破碎完全。於低溫下靜置 1 小時後,在 4 ℃下以8000 xg 離心 30 分鐘,取上層中約 80 %的上清液以減少核酸物質及 剩餘細胞殘渣對實驗的干擾,並進行蛋白質定量、導電度測定及等電點凝 集電泳實驗或保存於-80 ℃以備用。 7.2 第一維電泳
第 一 維 電 泳 為 等 電 點 凝 集 (isoelectric focusing,IEF)電泳(Berkelman and Stenstedt,1998),分為兩部分:
(1)膠體再水合(rehydration):
由於購得之 strips 上的膠體(4 ﹪acrylamide)為乾燥狀態(-20 ℃), 故在進行等電點凝集電泳前,須先經再水合的過程,使膠體膨潤。
IPGphor IEF system 的再水合及 IEF 的操作在同一步驟內完成(於 7.2(2) 敘述)。而Multiphor II 電泳系統的再水合及 IEF 則分開處理,操作如下:取 30 µL 細胞蛋白質樣品液和 300 µL rehydration buffer 混合後,和 Immobline Drystrips(長度 18 cm , pH 3-10 NL, Pharmacia)先後放置於 Drtstrip Reswelling Tray
中(膠體面朝下)並覆蓋paraffin,於 20 ℃下靜置 12 小時。
(2)IEF 操作
樣品電泳條件分析以Multiphor II 電泳系統操作;蛋白質鑑定時,改以
IPGphor IEF 系統(Pharmacia)進行操作。 1.Multiphor II
打開冷卻器,降溫至20 ℃左右,滴約 3 mL 的 paraffin 在冷卻器面板 上,壓上Immobline Strip Tray,壓到沒有氣泡,在 Tray 上滴約 3 mL 的 paraffin, 壓上專用塑膠片(Drystrip Aligner),壓到沒有氣泡 (凹槽面向上) 。將再水 合之strips 依序放入凹槽中(膠體面向上),strips 的前後兩端以潤溼過的細 長棉紙條輕輕覆蓋住,將電極壓在棉紙條上,倒入paraffin 使膠體完全被 覆蓋,再上蓋。操作條件:溫度 18 ℃ , 2 mA , 100 kV‧Hour(100V 100Vhr、 1000V 1000Vhr、4000V 4000Vhr 及 6000V 100kVhr)。完成後將strips 取出並盡 量除去paraffin,進行 7.3 2D 電泳實驗或保存於-20 ℃。 2.IPGphor 將Strip Holder 放於機器面板上,取 50 µL 細胞蛋白質樣品液和 200 µL rehydration buffer 混合後,將上述混合液和 Immobline Drystrips(長度 18 cm , pH 3-10 NL)先後放入 strip holder 內(膠體面朝下),加入Drystrips cover fluid 覆蓋。操作條件:溫度 20 ℃ ,5 µA / gel , 70 KV‧Hour(30V 12hr、100V 100Vhr、500V 500Vhr、1000V 1000Vhr、4000V 4000Vhr 及 6000V 70KVhr)。並
於操作期間每五分鐘以RS232 接頭將電壓、電流及實驗狀況的資料輸出
至記錄器紀錄。
第二維電泳為SDS-聚丙烯胺膠體電泳(2D-SDS-
polyacrylamide gel electrophoresis,SDS-PAGE)(Berkelman and Stenstedt,1998) 7.3.1 試藥
(1)Stock solutions
Slo.A 40 ﹪acrylamide-bisacrylamide,37.5:1 溶液
38.96 ﹪acrylamide 及 1.04 ﹪bisacrylamide 配製成 37.5 ﹪ acrylamide-bisacrylamide 溶液
Slo.B 4 倍濃縮 Resolving gel buffer
取181.5 g 的 Tris 溶於二次水,以 1 N HCl 調 pH 至 8.8,定容至 1 L, 於4 ℃冷藏備用。 (2)Gel solution 膠 體 濃 度 10 ﹪ 15 ﹪ 20 ﹪ Sol.A(mL) 75 112.5 150 Sol.B(mL) 75 75 75 Water(mL) 150 112.5 75 Sodium thiosulfate(mg) 372 372 372 Ammonium persulphate(mg) 150 225 300 TEMED(µL) 99 148 198 此為10 片膠體之配方表 7.3.2 膠體配製
將玻璃排於Multigel casting chamber(Bio-Rad)中並做序號,依上表配 製10 ﹪、15 ﹪或 20 ﹪膠體溶液放入 Gradient Former model 39(Bio-Rad)
中,在chamber 中製成梯度膠體(10-20 ﹪膠體為影像分析用或 10-15 ﹪ 膠體為蛋白質鑑定用),於每片膠上層加入2 ml 99 ﹪ethanol 等待凝膠,至 少1 至 1.5 小時。 7.3.3 樣品製備及操作方法 7.3.3.1 樣品製備 將Strips 自-20 ℃冰箱或第一維電泳結束後,依序放入 Equilibration Tray 中 (膠體面朝上),並依序加入後述之 Equilibration buffer 1 及 Equilibration buffer 2 各反應 15 分鐘。
Equilibration buffer 1 :
2 ﹪(w/v) DTE / 6 M urea / 30 ﹪glycerol / 2 ﹪(w/v) SDS / bromophenol blue / 50 mM Tris-HCl,pH 8.8
Equilibration buffer 2:
2.5 ﹪(w/v) iodoacetamide / 6 M urea / 30 ﹪glycerol / 2 ﹪(w/v) SDS / bromophenol blue / 50 mM Tris-HCl,pH 8.8
7.3.3.2 操作方法
以多片可控溫電泳設備(Protean II XL Multi-cell, Bio-Rad)操作。膠 體以sandwich clamp 固定,將已平衡的 strips 放於膠片上。在膠體上方 倒入0.5 ﹪agarose ,待 agarose 凝固後,架上 Power pac,放入電泳槽 中。在Power pac 上倒入 1 倍濃縮 SDS running buffer,蓋上蓋子後,接 上電源。當藍色bromophenol blue 至膠片底部 0.5 cm 時則可將膠片收起, 泳動時間約需5 小時。操作條件: 8 ℃ 、45 mA / gel
(1)Silver stainig 電泳結束後,取下膠片置於二次水中洗滌5 分鐘以除去小分子膠體及 雜質。除去上述液體,換成固定液A (ethanol/acetic acid/water = 40/10/50,v/v/v) 固定 1 小時。除去上述液體,移至固定液 B (ethanol/acetic acid/water = 5/5/90,v/v/v)作用 12 小時,移入二次水中洗滌 30 分鐘(每次 15 分鐘)以 除去固定液及雜質。除去上述液體,再加入1 ﹪glutaraldehyde / 0.5 M sodium acetate 溶液反應 30 分鐘,移入二次水中洗滌 30 分鐘(每次 15 分鐘)。以 0.05 ﹪(w/v)2, 7-naphtalene-disulfonic acid solution 溶液反應 30 分鐘;移入二 次水中洗滌30 分鐘(每次 15 分鐘)後,在銀染液(0.01 M silver nitrate /10 mL 25 ﹪氨水/ 0.008 M NaOH/L)中作用 45 分鐘;移入二次水中洗滌 30 分鐘(每 次15 分鐘)後,加入顯色溶液(0.005 ﹪(w/v)citric acid 及 0.05 ﹪(v/v) formaldehyde)中顯色。反應約 5 分鐘,立即將膠體移入終止液(5 ﹪(w/v) Tris 和 2 ﹪(v/v)acetic acid)中 15 分鐘,以終止顯色反應;移入二次水中 洗滌30 分鐘(每次 15 分鐘)(Chu et al., 2000)。
(2)Sypro Ruby 染色
電泳結束後將膠片取出,以10 ﹪methanol/ 7 ﹪acetic acid 的溶液固定 30 分鐘,取出再浸於 SyproR Ruby protein gel stain(500 mL /gel)(Lopez, 2000)
中染色,避光下反應至少3 小時。再以 10 ﹪methanol/ 7 ﹪acetic acid 的溶
液進行退染(減低背景值及減少破碎膠體的附著)。膠片染色都在軌道式
震盪機下操作。
銀染色之膠片以HP Scan Jet 4100C 掃描(灰階、300 dpi),而使用 Sypro Ruby(Excitation 280 及 450 nm;Emission 610 nm)之膠片則以雷射掃描系統 Molecular image FX 掃瞄,將圖檔存檔(TIFF 格式)後膠片密封保存。
7.6 影像分析比對
以Image Master 2D Elite Site license 3.10 版(Amersham Pharmacia Biotech)進 行影像分析比對,比對時以控制組的膠體影像作為參考影像用以調整比對的 參數(noise factor、operator size、sensitivity and background factor,此為對蛋白質 點作定義)得到經軟體自動篩選的蛋白質點(Monribot-Espagne and Boucherie, 2002),之後再以人為判別將不是點的點(如破碎膠體及掃瞄的雜訊)篩除;
蛋白質點背景值的扣除以內建的Mode of non-spot 功能進行。選擇一膠體影像
作為比對的參考影像(一般用控制組),進行蛋白質點配對(spot match),可
得到蛋白質點的資訊(number、volume、peak 等),或以內建的total spot volume normalisation 功能進行蛋白質點體積標準化(normalisation)處理,用以上資訊 進行區域相對密度趨勢分析(regional relative density trend analysis)、不同處理 間的蛋白質點比較、標準化體積相關性比較及蛋白質點體積差百分比分析 (Tonge, 2001;Huang et al., 2001),另以 PDQuestTM 6.2.0 版(Bio-Rad)的 density tools
進行雙軸相對密度趨勢分析(Pennington and Dunn, 2001)。
第八節 蛋白質鑑定
8.1 蛋白質膠內消化(In-Gel digestion)
膠體置於紫外光機上,將tip 前端剪成不同孔徑大小,取適當孔徑的 tip,
以垂直膠體表面方式對準點(spot)中心,將欲檢測的點由膠體挖出(約 1 mm3
trifuge tube 中,再以 200 μL 50 ﹪acetonitrile(ACN)/25 mM ammonium bicarbonate (pH 8.0)溶液洗滌 45 分鐘。除去上述溶液後,再浸於 200 μL 100 ﹪ACN 中5 分鐘。除去溶液,如此可將染劑除去及使膠體膨潤;將膠體在真空濃縮 機中乾燥20 分鐘。確定完全乾燥後,每個樣品加入 10 µg/mL sequencing grade modified trypsin,於 37℃下至少反應 16 小時(一般為 16-24 小時);再加入50 μ L 之 50 ﹪ACN / 5 ﹪TFA 浸漬,且超音波震盪 30 分鐘以萃取肽。將萃取液 以真空濃縮機乾燥,溶於20 μL 之 0.1 ﹪TFA 後,以 Zip-tip C18將肽脫鹽
及濃縮(Chu et al., 2000)。本部分實驗使用之 tip 及 appendof 均先以甲醇清洗 處理。
8.2 質譜分析
8.2.1 MALDI-TOF 質譜分析
將由in-gel digestion 而來之濃縮液及標準品(ATCH 之 fragment 18-39,22 amino acid 分子量為 2465.199)各取 1.5μL 以等比例(v/v)和 matrix(α -cyano-4-hydroxycinnamic acid,CHCA)混合,上述兩種混合溶液各取 1.5μL 點於flat gold MALDI plate 上。將 plate 置於室溫下至乾燥,其餘溶液保存於 -20 ℃。將plate 置於 MALDI-TOF 質譜儀進行測定(Clauser, 1999)。
8.3 資料庫檢索
將MADLI-TOF 質譜儀所得的數值(比例/時間)以質量/電荷(m/z)的
格式,輸入MADLI-TOF 質譜儀系統所附資料庫比對程式 MassLynx 3.5 及網路
比對程式Profound(Clauser, 1999;Crawford, 2000;ProteoMetrics website)中, 以預估之等電點及分子量和其它可能資訊(如修飾作用-磷酸化、蛋白質 N 端乙醯基化及 methionine 氧化等情況)為條件及選定的資料庫(NCBI; SwissPort,ExPASy website)進行比對。
1、 細胞週期的影響
將細胞放在1.5ml 離心管中內含有 70﹪乙醇的 PBS 中,冰浴固定 30 分鐘,以
800×g 離心 3 分鐘,吸掉上清液,再以 PBS 清洗、離心,吸掉上清液後加入 含有40 mg/ml 的 propidium iodide 及 0.1 mg/ml RNase 的 PBS,使細胞懸浮於此溶 液,37℃下培養 30 分鐘,以 flow cytometry 以波長 488nm 定量細胞 DNA 含量。
實驗流程 中草藥 甲醇萃取 細胞形態 有效中草藥 甲醇萃取液 DMSO回溶液 MTT SRB 等電點凝焦電泳 導電度測定 電壓電流測定 SDS-PAGE Silver staining Sypro Ruby 影像比對分析 In-gel digestion Lysis buffer
結果與討論 第1 節 蛋白質相對含量差異分析 蛋白質含量多寡是影響電泳實驗的因素之一,尤其在定量分析及膠體顯色方 面均會影響電泳結果,故進行導電度測定及SRB 蛋白質定量,以評估蛋白質相 對含量的差異。 蛋白質Lysis 溶液離子導電度的測定結果(未列出)亦不佳,原因應如 同蛋白質定量測定,可能由於導電度是測定離子的濃度,推測可能是離子濃度過 高或蛋白質的量相對於溶劑的比例太低,使其不足影響整體導電度的表現,造成 導電度測定時數值不穩定且隨測量的位置及溶劑的多寡而有所變化。此外,以不 同蛋白質標準品進行測試時,測定數值與濃度之間也未發現任何相關性。 不同濃度(0、10、30、50 μg / mL)AP 甲醇萃取物的 DMSO 回溶液作 用於HepG2 及 Hep3B(圖 11)之 SRB 分析,其結果和細胞形態觀察時之變化一
樣,AP 對 HepG2 毒性作用較 Hep3B 顯著。由於 SRB 分析是測定細胞蛋白質含量
以作為細胞毒性的指標,故亦可將SRB 的分析結果當成蛋白質的測定分析(Hwang
et al., 1997)。AP 萃取物濃度達 30 μg / mL 作用 24 小時下即對 HepG2 的細胞有毒 性影響,而濃度至50 μg / mL 且經 24 小時作用下 AP 萃取物處理的 Hep3B 才會 影響細胞蛋白質。
前述方法是測定以Lysis buffer 萃取後的蛋白質量,以利進行電泳實驗,
但因Lysis buffer 含 7M Urea,而市售的蛋白質定量試劑僅可忍受 6M Urea(Bio-rad protein assay manual),故本實驗對蛋白質的分析以相對百分率去預測各條件間蛋 白質的關係。而導電度的測定也不用在評估蛋白質的含量,改以導電度數值用於 評估是否可進行等電點凝集電泳的分析,因高導電度會使等電點凝集電泳的操作 時間增加,由蛋白質顯色後可發現蛋白質凝集不完全而呈帶狀分佈。SRB 和 MTT
同為測定細胞毒性的方法,不同的是SRB 法是測定活細胞中蛋白質的含量,也
蛋白質之後蛋白質測定更能代表藥物處理後細胞蛋白質的含量變化,避免因萃取
所造成的損失或Lysis buffer 對蛋白質測定的干擾。但同 MTT 容易在操作過程損失
結晶及對某些蛋白質無法估計等因素(Wang, 2000),故對蛋白質的分析同前二項 試驗以相對含量(relative protein content)表示。
第五節 一維凝膠電泳分析 本研究主要是將中草藥甲醇萃取物處理之細胞蛋白質以二維凝膠電泳的方 法進行蛋白質的分離,而二維凝膠電泳即是結合二種一維凝膠電泳-等電點凝集 及SDS-PAGE,所以實驗操作及影響因素變更為複雜。 蛋白質的萃取以萃取細胞全部的蛋白質為目的,即探討整體可萃取蛋白 質量的變化,但目前尚沒有任何的方法可以一次將全部的細胞蛋白質萃出 (Herbert, 1999;Vuong et al., 2000)。本實驗所使用之蛋白質萃取法所萃取的蛋白 質會有較多疏水性及高分子量蛋白質,因lysis buffer 中含有 thiourea(Berkelman and Stenstedt, 1998;Herbert, 1999)之故。使用的一維膠體為非線性酸鹼梯度的膠體 (Non-line pH,pH NL),而一般在靠近兩極端酸鹼值區域及 pI 點接近鹼性區域的 蛋白質在等電點凝集時較不易被分離區分(Fey and Larsen, 2001),而且在實驗過 程中距電極較近的膠體由於離子濃度較高和生熱速率較快等因素,膠體容易破 壞,所以實際可用以分離目的蛋白質的酸鹼值僅約pH 4-8(pH 3-10 NL 膠體實際 pH 約為 3.2-9.5),然而細胞蛋白質之pI 值大多分佈在 pH 5-7 之間(VanBogelen et al., 1999),故對實驗的影響輕微(pH 3-10 NL 膠體酸鹼值梯度在 pH 5-7)。 等電點凝集電泳實驗操作以觀察膠體電壓及電流的相互變化作為實驗 結果好壞的初步判斷,在膠體電壓已固定在最大設定值時,可從電流的變化而預 測離子濃度(V=I/C,V=電壓 I=電流 C=導電度)。從實驗結果(圖 12)可知,控 制組的離子濃度較加藥實驗組(50 μg/mL)來的高,所需操作時間較加藥實驗 組長,亦即在相同測試細胞數及相同實驗條件的假設下,由先前結果(表六)可
知AP 加藥實驗組對 Hep3B 細胞具有毒性造成細胞數減少使蛋白質含量亦應較控 制組少,故加藥實驗組的離子濃度較少。
SDS-PAGE 實驗操作以影像分析作為實驗結果的判斷,良好的電泳分析
結果要將蛋白質完全區分開,即膠體上的每一點就代表一個蛋白質(圖14-S1),
否則無法進行影像及質譜的分析。圖13 為藥物試驗及標準品蛋白質的電泳結
果,將圖中的S(蛋白質標準品,BSA)及 C 和 D(AP 3B1day)做相對密度趨勢分
析(圖14),可知藥物試驗組在一維凝膠並不能將蛋白質區分;而以分子量66 kDa
之BSA 蛋白質標準品的橫軸範圍做區域相對密度趨勢分析(圖 15)時,可知各
樣品(S、AP 3B1day、B(Albumin,Sigma)及 AP 3B2day)在此範圍內各種試驗藥
物相對含量變化。例如由B1 到 B4 的相對量變化,即可表示不同 BSA 蛋白質量 (4.6 至 48 mg)的變化。將 0.3%(v/v)不同藥物(AP、MC、AS、AR 及 RR)處 理24 小時的電泳圖以雙軸相對密度趨勢分析(圖 16),可知各軸上各處理的相對 含量變化,即代表不同藥物對測試細胞在此一範圍內細胞蛋白質的影響差異,但 範圍小且蛋白質的分離在單一維凝膠電泳的分離的分離不佳,故必須以二維凝膠 電泳進行分析。 在一維電泳的分析方面,導電度的試驗雖然無法具體的證明蛋白質對電 泳分析的影響,但於實驗中可知過高的導電度會延長凝集電泳的操作時間,故隨 後的SDS-PAGE 膠體影像結果均不佳,故可以用導電度的試驗來判斷是否進行電 泳實驗依據,避免時間及藥品的浪費。此外在測定凝集電泳操作時的電壓及電流 變化,發現控制組的電流值在固定電壓(6000V)期間明顯地較加藥組(大腹皮 50 µg / mL)多,即導電度較高,在各種環境條件(機器、溫度或溶液等)相同下, 就導電度的定義及之前的細胞毒性試驗結果可知,因控制組的蛋白質較加藥組多 的緣故。由相對密度趨勢分析的結果可以知道單一條件(分子量)的分離並不能 完全將複雜蛋白質個別分開,但卻可得到大多數蛋白質的分佈情形及彼此的相關 含量,可藉此調整有利於分離的膠體濃度及實驗條件(Zuo et al., 2001;Rubenwolf et
al., 2002)。 第六節 二維電泳分析 二維電泳分析方法在操作上有幾個關鍵點-蛋白質萃取、等電點凝集電泳 的實驗條件、二維凝膠膠體的製作及膠體內蛋白質的顯色等,本段探討後三項條 件。 等電點凝集電泳的實驗條件除參考文獻外,尚需配合實驗的嘗試,主要是 受蛋白質種類、溶液條件或機器及環境影響。經數次預實驗得知,肝癌細胞(HepG2 及 Hep3B)的實驗條件為:70 KVhours(實際值約 75000 KVhours)。而萃取蛋白質 的注入量經數次預實驗得知,分析用30μL 及鑑定用 50 μL(6×10⁷ cells) (一
般107 cell 中約含 1mg 蛋白質,故 50 μL 約 0.3 mg 蛋白質)(Vuong et al., 2000;APAF
manual),加入 lysis buffer 至總體積 350μL。
二維凝膠膠體的製作技術較成熟再現性高,對二維電泳結果影響不
大,以10-20 %膠體濃度進行實驗。膠體內蛋白質的顯色,以銀染法來找尋二維
凝膠電泳的操作條件,但此法有不利於後續的影像分析及質譜分析的缺點,故本 實驗後期亦全改用Sypro RubyTM螢光染劑法(Thierry, 2000)。
第七節 電泳膠片影像比對分析 影像比對分析在操作上有幾個關鍵點-影像的處理、蛋白質點的定義及影 像分析對照組的選擇等因素。將掃瞄的影像以photoshope 6.0(adobe)進行轉檔 (TIFF 格式)及個別對比調整,以利各種影像比對軟體間的操作,分析時再以比 對軟體內建對比調整功能進行群組對比調整,以減少影像間背景值的差異。蛋白 質點的定義則以能進行後續質譜分析為原則,以實驗需求及軟體內建功能進行蛋 白質點的選取;影像分析對照組則選擇以實驗對照組為影像比對對照組。
Vercoutter-Edouart 等(2001 年)曾以不同濃度 FGF-2 (fibroblast growth factor) -2 探討 MCF7 乳癌細胞的蛋白質變化,且 Chevalier 等(2000 年)以 EGF (epidermal growth factor)、TNFα(tumour necrosis factor α )及 peroxisome proliferator 探討 HepG2
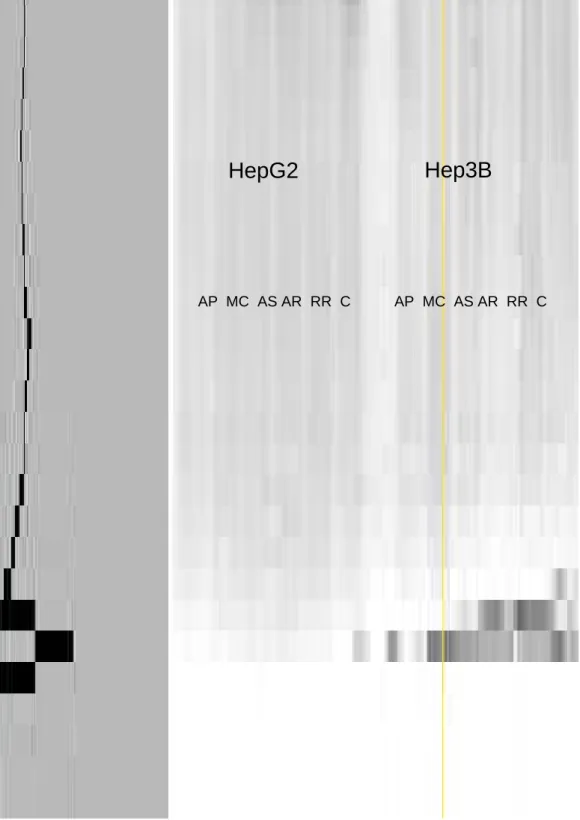
肝癌細胞的蛋白質表現,而二者均使用蛋白質體的分析方法研究藥物對癌細胞蛋 白質的影響。本研究以不同藥物處理後之Hep3B(圖 17)及 HepG2(圖 18)2D 電泳圖,由其影像比對後所得的蛋白質spot 分佈圖得知,spot 中蛋白質不同含量 差異(增減50%)的 spot 點數都不同,可知 0.3%(V/V)不同藥物(AP、MC、 AS、AR and RR)濃度作用對細胞蛋白質的影響各有所不同。造成細胞蛋白質的 不同變化,亦可由圖16 的結果得知。而由表九的數據結果可知銀染色法蛋白質
點配對率(percentage of matched spot)除 Hep3BMC 為 31.2 %外,其他約 50 %, 而在體積差異率(percentage of volume difference)50 %以上的數據中,以 HepG2 AP 及Hep3B AP 所造成的差異數目最多分別為 141 點及 235 點,而以 HepG2 MC 及 Hep3B MC 的數目最少分別為 66 點及 109 點,由此可知 AP 藥物作用造成的細胞 蛋白質變化最大。
將Hep3B(圖 19)及 HepG2(圖 20)經不同濃度 AP 萃取物的 DMSO 回溶液
(0、10、30、50 μg / mL)處理後的膠體 Sypro Ruby 染色後,進一步進行影像比
對,由二維電泳圖結果可知,不同AP 濃度處理對細胞蛋白質的影響程度均不同。
而由表10 可知,各 AP 處理濃度下蛋白質點配對率均高於 70 %,配對率相對提
升20 %(表 9 的 AP 濃度處理如表 4 所述約同等表 10 AP 30μg / mL 處理),可能
因不同溶劑(甲醇及DMSO)或不同染色法(銀染色法染色無終點,蛋白質顯色
隨時間而增加;而Sypro Ruby 為 end-staining,蛋白質顯色不隨時間而增加只隨蛋
白質含量而變化)有關,使可分離及分析的蛋白質點數目增加,而從體積差異率 30 %以上的數據可知,兩種細胞均隨 AP 濃度的增加,所造成的差異數目也隨之 增加。 Tonge 等(2001 年)及 Lehr 等(2002 年)的研究指出,經由標準化處理的 數值可以更精準的表示蛋白質之間的相關性質,故同一片(批)膠體上的蛋白質 點,影像分析時由於比較的基礎條件一致(膠體背景值(染色差異)、膠體濃度 差異、膠體掃瞄差異(不同掃瞄器)等因素),故可直接以蛋白質點間的體積(spot
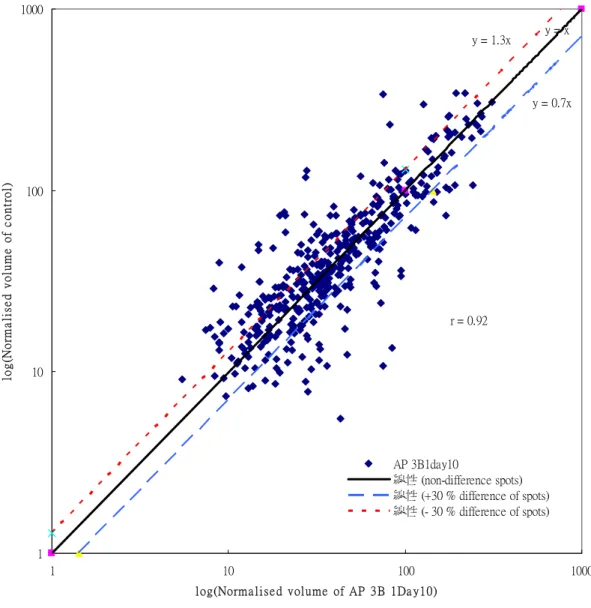
volume)進行比較,但若分析不同片(批)膠體間的蛋白質點,則必須先將各膠 體的基礎條件差異盡可能縮小,以利更精準的分析,所以需進行蛋白質點體積的 標準化(normalisation)處理。在 Hep3B(圖 21)及 HepG2(圖 22)之標準化體積 (normalised volume)比較方面,由圖可知兩片 2D 膠體的全部蛋白質之相對含量 分佈情形(對控制組),蛋白質點分佈如愈趨近直線(y=x,r=1 r:相關係數),則 表示兩片膠體的全部蛋白質含量愈相等,藉此分析可瞭解不同膠體蛋白質含量的 相關訊息。膠體蛋白質含量最接近控制組的分別為HepG2 30 µg/mL AP (r=0.91) (圖21-2)及 Hep3B 10 µg/mL AP(r=0.92)(圖 22-1)。而表 11 為膠體上增減及未 改變蛋白質點的數目之整理結果,由表中結果可知,隨藥物濃度增加,此兩種細
胞株HepG2 及 Hep3B 2D 膠片中蛋白質含量相等之點(位於 y=x 線上)的數目隨
之減少,而蛋白質含量較多者(位於y=x 線下方)的數目隨之增加。此外,在濃
度50µg/mL AP 處理下,蛋白質含量較少者(位於 y=x 線上方)的數目有減少的情
形。而有關不同處理的膠體蛋白質含量相關性結果方面,Yan 等(1999 年)用相 關係數來定量蛋白質的表現。而本研究以HepG2 30 µg /mL AP(r=0.91)及 Hep3B 10 µg / mL(r=0.92)表示含量最接近控制組,隨大腹皮濃度增加,位於 y=x(r=1)線 上的蛋白質點有減少的趨勢,及整體蛋白質的含量隨藥物濃度增加而隨之減少, 故可用相關係數的數值來預測不同處理間的整體蛋白質含量的關係,所得結果亦 和Yan 有相同趨勢。
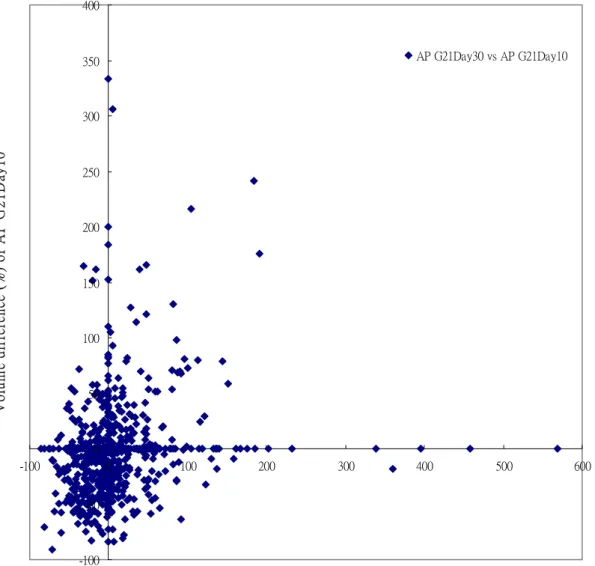
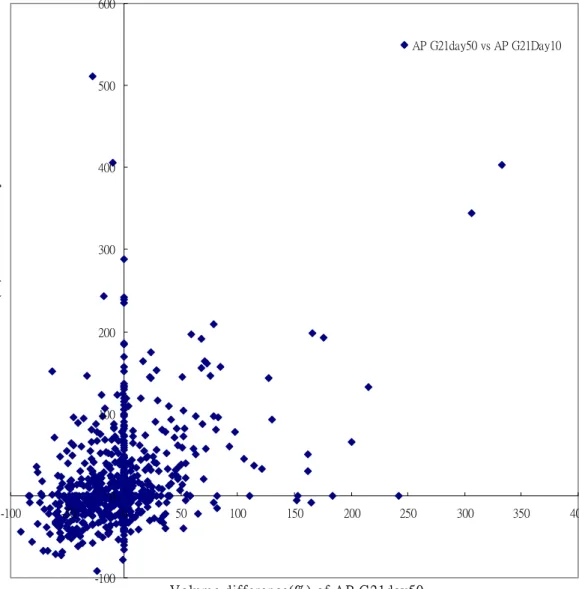
在體積差異率(percentage of volume difference)方面(圖 23、24),可瞭解 個別蛋白質點在兩個不同處理間(AP G21Day30 vs AP G21Day10、AP G21Day50 vs AP G21Day10、AP 3B1Day30 vs AP 3B1Day10 及 AP 3B1Day50 vs AP 3B1Day 10 )相對分 佈的情形,即瞭解每個蛋白質點受不同藥物濃度處理的變化。由圖中可知,大多
數的蛋白質點分佈在第三及第四象限內(不考慮兩軸上之點),各處理下 HepG2
約300 點和 Hep3B 200 點。而表 12 則為分佈於軸上及各象限內點的數目。第一象
組)。另由表12 的 APG21Day 第一象限(30 vs 10 及 50 vs 10)中可知,在 30 及 50 µg/ mL 濃度作用使象限內點的含量差(相對於控制組)增加,表示藥物濃度的增 加使蛋白質的表現量較原先增加,故同理由表中數據可知藥物作用於 HepG2 及 Hep3B 均是第一及第四象限(10 µg/ mL 處理時蛋白質含量較控制組低)隨濃度增 加使象限內點的含量增加,而第二(10 µg/ mL 處理時蛋白質含量較控制組高)及 第三象限隨濃度減少使象限內點的含量減少,也就是蛋白質隨藥物濃度變化而改 變。此外,在探討個別蛋白質點在不同處理間之體積差異分布情形,PleiBner 等 (1998 年)及 Charlwood 等(2002 年)的研究指出,可利用蛋白質體含量相關性 及蛋白質點體積差異性的分布情形來研究。由於影像比對分析提供蛋白質點在不 同條件間的相關特性,這些資訊可提供作分析藥物作用、癌細胞蛋白質變化及鑑 定的依據。 第八節 蛋白質質譜鑑定分析 在瞭解藥物對蛋白質的影響後,接著就是探討肝癌細胞中何種蛋白質受到變 化。以質譜技術對蛋白質進行定性及定量分析是蛋白質體學研究上所不可或缺 的,即使有各種試圖替代二維凝膠電泳的方法陸續被發展(Cagney et al., 2001), 而質譜的分析依然是被公認為分析鑑定蛋白質最主要的工具,因僅需pmole 或 fmole 的量即可被檢測。 上述有關肝癌細胞Hep3B 的影像分析中,將差異較大或經人為比對認為有 意義的蛋白質點(HepG2 則參考現有的 HepG2 蛋白質圖譜或文獻,資料未列出) 由膠體中挖出,進行膠內水解(In-gel digestion)及去鹽(desalting)等步驟,再以 MALDI-TOF 質譜進行蛋白質鑑定分析(附錄五 VIII-XIX A),其實驗結果整理於圖 25 及表 13。另將被鑑定出的 13 種蛋白質在各種藥物及不同濃度的相關影響結果 整理於附錄五 VIII-XIX B-D。在受測試的 72 點蛋白質點中,有 52 個蛋白質被測定
出,在以pH、分子量、物種及質譜圖譜判定等條件篩選確認後,共鑑定出 13 個
果中。 藉由被鑑定出的蛋白質及蛋白質點影像比對分析,可以瞭解在不同藥物及 濃度處理下,各蛋白質間的相互關係。在AP 及 MC 兩種藥物處理比較方面,蛋 白質(spot 1、2、7、12,表 13)在 MC 藥物處理下並不表現,蛋白質(spot 4、6、 9、11,表 13)在 AP 藥物處理下表現量較 MC 藥物處理多,蛋白質(spot 10,表 13)在 MC 藥物處理下表現量較 AP 藥物處理多,其餘蛋白質表現量差異不大(附 錄五VIII-XIX B 及 C)。在不同濃度AP 藥物處理比較方面,有些蛋白質(spot 1、2、 3、4、5、6、8、10、12,表 13)有隨藥物濃度增加而表現量隨之增加的趨勢, 而有些蛋白質(spot 7,表 13)有隨藥物濃度增加而表現量隨之減少的趨勢(附 錄五VIII-XIX D)。將被鑑定出的各蛋白質在各種藥物及不同濃度的相關影響,以 Lim 等(2002 年)對肝癌的研究方式整理於附錄四。這些蛋白質顯示出藥物處理 所造成的細胞生理變化,但由於所得資訊有限和Wirth 等(1995 年)及 Seow 等(2001 年)對肝癌的研究參照,用以推測大腹皮對Hep3B 的作用機制,期待可以進一步 瞭解藥物的影響。經由Swiss-port 資料庫可知,蛋白質 1 及 12 作用在內質網,可 能會影響蛋白質的合成及功能的表現;蛋白質9 及 13 調控 DNA 合成,可能會影 響後續基因訊息的傳遞;蛋白質 11 亦可能影響 tryptophan 代謝及蛋白質 6 可能 是影響glycosis 等範圍(Berg et al.,2001)。 推測其可能的作用機制為隨 AP 藥物
濃度增加,蛋白質9 的濃度增加而可能會抑制 DNA 合成(圖 26A);蛋白質 1 的濃度減少而可能使內質網到高基氏體(Golgi)運輸能力減緩(圖 26A);蛋白 質 11 的濃度減少可能會終止 tryptophan degradation(圖 26B);蛋白質 6 的濃度 增加而可能使帶高能量的phosphoenol- pyruvate 大量產生(圖 26C)。 結論 本研究以細胞形態實驗所篩選出的中草藥(大腹皮、厚朴、檳榔、白朮及大 黃),藉由細胞形態變化可和後續蛋白質體的分析相結合(Harris et al., 2002)。經
由MTT 細胞毒性試驗得知,中藥甲醇萃取物對 HepG2 作用較 Hep3B 敏感,以 24 小時處理對HepG2 達 50﹪抑制率所需的濃度(IC50值)分為大腹皮(10-30 µg / mL)、 厚朴(< 10 µg / mL)、檳榔(< 10 µg / mL)、白朮(50 µg / mL)及大黃(30 µg / mL), 均較Hep3B 所需低,而水萃取物所造成的影響十分低微。在 SRB 的分析方面, 大腹皮濃度達30 µg / mL 始對 HepG2 的蛋白質有影響,濃度至 50 µg / mL 時,對 Hep3B 的蛋白質才有些微影響,若將 SRB 分析結果以細胞毒性表示,則和 MTT 細胞毒性試驗有相似的結果。 本研究也首先在比較不同中藥(大腹皮、厚朴、檳榔、白朮及大黃)處理的 膠體影像分析中,除發現Hep3BMC 的蛋白質點配對率為 31.2 ﹪外,其餘均約 50 ﹪。此外,以大腹皮處理所造成的蛋白質點變化最大,對HepG2 及 Hep3B 分別為 141 點及 235 點,厚朴所造成的蛋白質點變化最少,分別為 66 點及 109 點。由膠 體上蛋白質點數目的變化,可更清楚瞭解藥物對癌細胞的影響程度(Westbrook et al., 2001)。在不同濃度(0、10、30 及 50 µg / mL)大腹皮處理的膠體影像分析中, 從體積差異率30 ﹪以上的數據可知 HepG2 及 Hep3B 均隨大腹皮濃度增加,所造 成的差異數目也隨之增加。而10、30 及 50 µg / mL 對 HepG2 處理分別增加 241、 255 及 276 點,對 Hep3B 處理則為 159、162 及 190 點,由此差異推測可能是大腹 皮對HepG2 作用較強。本研究將由影像比對所得的體積數據進行標準化處理,用 以分析膠體蛋白質含量相關性及蛋白質點體積差異性的分布情形。而在探討個別 蛋白質點在不同處理間之體積差異分布情形,經實驗可知不同蛋白質受到不同處 理的變化情形。 經由MALDI-TOF 質譜分析有 13 個蛋白質被檢測出,依序分別是 sedlin、
mitochondrial short-chain enoyl-coenzyme、hypothtical protein FLJ12934、fibrinogen γ-B chain precursor、white protein homolog、enolase 1、PRO0720、TSA、prohibitin、v-crk avian sarcoma virus CT10 oncogence homolog-like、tryptophan 2,3-dioxygenase、ER60 及 ribonucleotide reductase。這些蛋白質顯示出藥物處理所造成的細胞生理變化,由於所得資訊有
限,推測可能影響的範圍可能在DNA 合成、內質網、tryptophan metabolism 及 glycosis
等方面,仍不足以推測大腹皮對Hep3B 的作用機制,期待往後實驗可以進一步探
HepG2 30 50 70 90 110 130 150 170 190 210 0 0.1 0.2 0.3 0.4 0.5 C o n c e n t r a t i o n ( % ) p e r w e l l Cell viabilit y (%) A P 2 4 h r A P 4 8 h r A P 7 2 h r M C 2 4 h r M C 4 8 h r M C 7 2 h r A S 2 4 h r A S 4 8 h r A S 7 2 h r A R 2 4 h r A R 4 8 h r A R 7 2 h r R R 2 4 h r R R 4 8 h r R R 7 2 h r Hep3B 50 100 150 200 0 0.1 0.2 0.3 0.4 0.5 C o n c e n t r a t i o n ( % ) p e r w e l l Ce ll v ia bi li ty ( % ) A P 2 4 h r A P 4 8 h r A P 7 2 h r M C 2 4 h r M C 4 8 h r M C 7 2 h r A S 2 4 h r A S 4 8 h r A S 7 2 h r A R 2 4 h r A R 4 8 h r A R 7 2 h r R R 2 4 h r R R 4 8 h r R R 7 2 h r 圖 10、不同草藥水萃取物對 HepG2 及 Hep3B 細胞生長之影響。 Figure 10、Effect of various herb water extracts on the growth
of HepG2 and Hep3B cells.
HepG2 cells(2.5×10³/well) and Hep3B cells(5×10³ cell/well)were seeded in 96 well culture plates for 24 hr, and were subsequently incubated in fresh media and treated with various concentrations of water extracts of Herbs(AP、MC、AR、AS and RR)for 24hr、48hr and 72 hr. Number of cells cultured in media with the addition of herb extract was need as control. Cell viability was determined by MTT assay. Each data represents mean±SD(n=5)from the same experiment. Cell viability(%)= OD of treated by various treatments / OD of control.
HepG2 20 40 60 80 100 120 140 0 10 30 50 D μ g / m L R e l a t i v e p r ote in c on te nt (% ) 24hr 48hr 72hr Hep3B 0 20 40 60 80 100 120 140 0 10 30 50 D μg / mL Rel at ive p rot ei n c on ten t (% ) 24hr 48hr 72hr 圖 11、以 SRB 法分析經不同濃度之 AP 甲醇萃取物對肝癌細胞 HepG2 及 Hep3B 作用後之蛋白質相對量變化。
Figure 11、Effect of various amounts of AP methanol extract on the protein changes of (A)HepG2 and (B)Hep3B cells by SRB method.
HepG2 cells(2.5×10³/well)and Hep3B cells(5×10³/well) were seeded in 96 well culture plates for 24 hr, and were subsequently incubated in fresh media and treated with various concentrations of DMSO AP(DMSO dissolved AP methanol extract) for 24hr、48hr and 72 hr. Cell viability was determined by SRB assay. Each data represents mean±SD(n=5) from the same experiment. Relative protein content in HepG2 and Hep3B cells treated with various amounts of AP methanol extract. Protein in 96 well dish was quantified with SRB method and protein content in cells without extract treatment was used as control.
0 1000 2000 3000 4000 5000 6000 7000 0 2 4 5 7 9 11 12 14 16 18 19 21 23 25 26 28 30 32 33 Time (hours) V 0 10 20 30 40 50 μA Theoretic V 3B control V 3B 50 V 3B control A 3B 50 A 圖 12、IEF 電泳不同操作時間下不同蛋白質濃度對電壓及電流的影響。 Figure 12、Effect of the concentration of protein extracts from Hep3B Cells on the levels of Voltage(V) and current(µA) during one dimension
electrophoresis.
Hep3B(2×10⁶ cells /mL)was seeded in 10 cm culture dishes for 24 hr, and were subsequently incubated in 10 mL fresh media and treated with 3B control 0 µg / mL (3B control) and 50 µg / mL (3B 50) of AP extract in DMSO for 48hr. Voltage(V)and current(µA)was determined by IPGphor II.
圖 13、不同 AP 萃取物濃度處理後 Hep3B 細胞中蛋白質之 SDS-PAGE 圖。 Figure 13、SDS-PAGE electrophoresis of Hep3B cells treated with
various levels of AP extract in 0.3 % DMSO.
Hep3B(2×10⁶ cells /mL)were seeded in 10 cm culture dishes for 24 hr, and were subsequently incubated in 10 mL fresh media and treated with various concentrations(0、10、30 and 50 µg / mL) of AP extract in DMSO for 24hr (AP 3B1Day)and 48hr(AP 3B2Day). Proteins in 10-20 % polyacrylamide gel were stained with Sypro Ruby. C=0µg / mL ; D=0.3 % DMSO. S1,
S2:protein molecular weight maker-Phophorylase b(97.0 kDa)、Albumin(66.0 kDa)、Ovalbumin(45.0 kDa)、Carbonic anhydrase(30.0 kDa)、Trypsinn inhibitor(20.1 kDa)and α-Lactalbumin(14.4 kDa). B1,B2,B3,B4=4.6,12,24,48
AP 3B1Day
S1 C D 10 30 50 B1B2B3B4 C D10 30 50 S2 97.0 66.0 45.0 30.0 20.1 14.4 KDa 6.7 8.3 14.7 8.3 μg 8.0 11.6 4.6 12 24 48 μgAP 3B2Day
µg of BSA.
圖 14、SDS-PAGE 蛋白質之相對密度趨勢分析。
Figure 14、 Relative density trend analysis of proteins in SDS-PAGE.
Relative density trend analysis of S1、C and D lanes in Figure 15 were performed by PDQuest software.
圖 15、區域相對密度趨勢分析。
Figure 15、 The regional relative density trend analysis of proteins (66 kDa) in the Hep3B Cell treated with various levels of AP extract in 0.3 % DMSO.
The regional relative density trend analysis of the transverse axle(66kDa proteins) in Figure 15 were performed by ImagemasterTM software. 1 : 66 kDa transverse axle;
2: background transverse axle.
S C D 10 30 50
B1B2B3B4
C D10 30 50 S
S C D 10 30 50
B1B2B3B4
C D10 30 50 S
圖 16、不同草藥處理蛋白質萃取物之雙軸相對密度趨勢分析。
Figure 16 、The dual-axle relative density trend analysis of protein in cells treated with various herb extracts.
HepG2 and Hep3B(2×10⁶ cells /mL)were seeded in 10 cm culture dishes for 24 hr, and were subsequently incubated in 10 ml fresh media and treated with 0.3 % various herb methanol extracts(AP、MC、AS、AR and RR)for 24hr. C=0 µg / mL. SDS-PAGE contains 10-20 % polyacrylamide gel was stained with Sypro Ruby. The dual-axle relative density trend analysis was performed by PDQuest software 10 % 20 %
HepG2
Hep3B
AP MC AS AR RR C AP MC AS AR RR C 10 % 20 %HepG2
Hep3B
AP MC AS AR RR C AP MC AS AR RR C(A) (B)
圖 17、不同草藥處理對 Hep3B 細胞蛋白質之二維凝膠電泳圖比較。 Figure 17、2D-electrophoretograms of the cellular proteins of Hep3B.(2×10⁶
cells/mL)after 24 h of treatment with (A) 0.3 % AP、MC、AS、AR and RR, and their respective (B)image analyzed results.
3BAP 3BMC 3BAS 3BAR 3BRR 3BC
AP
MC
AS
AR
RR
C
Cellular proteins were initially electrophoresed with a Multiphor II with pH 3-10 NL Ampholines and then electrophoresed on a 10-20 % polyacrylamide gel for the second dimensional separation. Gel was stained with silver stain method and analyzed with a ImagemasterTM . C:Hep3B treated with 0.3 % methanol and used as control. IEF conditions : 6000 V(total 75000 VHr). SDS-PAGE conditions were 45 mA/gel, 5 hr.
(A) (B)
圖 18、不同草藥處理對 HepG2 細胞蛋白質之二維凝膠電泳圖比較。 Figure 18、2D-electrophoretograms of the cellular proteins of HepG2.(2×10⁶
cells/mL)after 24 h of treatment with (A) 0.3 % of AP、MC、AS、AR and RR, and their respective (B)image analyzed results.
G2AP G2MC G2AS G2AR G2RR G2C
AP
MC
AS
AR
RR
C
Cellular proteins were initially electrophoresed with a Multiphor II with pH 3-10 NL Ampholines and then electrophoresed on a 10-20 % polyacrylamide gel for the second dimensional separation. Gel was stained with silver stain method and analyzed with a ImagemasterTM . C:HepG2 treated with 0.3 % methanol and used as control. IEF conditions : 6000 V(total 75000 VHr). SDS-PAGE conditions were 45 mA/gel, 5 hr.
A (
0 µg AP/ mL)
a
B (
10 µg AP/ mL)
a
(
30 µg AP/ mL)
a
D (
50 µg AP/ mL)
圖19 AP 草藥處理對 Hep3B 細胞蛋白質之二維凝膠電泳圖比較
Figure19 2D electrophoreticgrams (a)of celluar proteins of Hep3B(2×10⁶ cells/mL treated with 0 µg/mL(A, control),10 µg/mL(B),30 µg/mL(C),50 µg/mL(C) of DMSO AP(DMSO dissolved AP methanol extract) for 24 hr and then respective
a
image analyzed result(b)
The 2D gel was run on the IPGpor II with pH 3-10 NL Ampholines in the first dimension and 10-20 % polyacrylamide in the second dimension. IEF conditions were 12 hr at 30 V, followed by a gradient up to 6000 V, than about 12 hr at 6000 V (total 75000 VHr). SDS-PAGE conditions were 5hr by 45 mA/gel. The gel was stained with Sypro RubyTM and analyzed with ImagemasterTM .
A (
0 µg AP/ mL)
a
B (
10 µg AP/ mL)
a
C (
30 µg AP/ mL)
a
D (
50 µg AP/ mL)
圖20 AP 草藥處理對 HepG2 細胞蛋白質之二維凝膠電泳圖比較
Figure20 2D electrophoreticgrams (a)of celluar proteins of HepG2(2×10⁶ cells/mL) treated with 0 µg/mL(A, control),10 µg/mL(B),30 µg/mL(C),50 µg/mL(C) of DMSO AP(DMSO dissolved AP methanol extract) for 24 hr and then respective
a
image analyzed result(b)
The 2D gel was run on the IPGpor II with pH 3-10 NL Ampholines in the first dimension and 10-20 % polyacrylamide in the second dimension. IEF conditions were 12 hr at 30 V, followed by a gradient up to 6000 V, than about 12 hr at 6000 V (total 75000 VHr). SDS-PAGE conditions were 5hr by 45 mA/gel. The gel was stained with Sypro RubyTM and analyzed with ImagemasterTM
r = 0.85 y = x y = 0.7x y = 1.3x 1 10 100 1000 1 10 100 1000
log(Norm alized volum e of AP G21Day10)
lo g (N o rm alized v o lu m e o f c o n tr o l) AP G21Day10 線性 (non-difference spots) 線性 (+30 % difference of spots) 線性 (-30 % difference of spots) 圖21-1、AP G21Day10 中不同蛋白質點標準化體積的相關性。
Figure 20-1、Correlation between the normalized volume of protein spots of HepG2 cells treated with 10 µg AP / mL DMSO and those of protein spots of control.
HepG2 (2×10⁶ cells /mL)were incubated in 10 mL fresh media and treated with various concentrations(0、10 µg / mL) of AP extract in DMSO for 24hr. 2D-gels were stained with Sypro RubyTM and analyzed with ImagemasterTM. The quantity of each spot in the X-axis(AP G21Day10) is plotted on a log scale against the quantity of that in the Y-axis(control). If the spots quantity is the same in both treatments, its point will fall on the y = x line in the graph. If the quantities are not the same, the point will fall above or below the y = x line(slope = 1). The correlation coefficient(r = 0.85) for the regression line is shown on the graph. A coefficient of 1.00 indicates that the two images are perfectly similar. In this normalization, the total volume of all of the spots in the gel divides the volume of each spot.
r = 0.91 y = x y = 0.7x y = 1.3x 1 10 100 1000 1 10 100 1000
log(Norm alized volum e of AP G21Day30)
lo g (N o rm al iz ed vol u m e of con tr ol ) AP G21Day30 線性 (non-difference spots) 線性 (+30 % difference of spots) 線性 (-30 % difference of spots) 圖21-2、AP G21Day30 中不同蛋白質點標準化體積的相關性。
Figure 20-2、Correlation between the normalized volume of protein spots of s HepG2 cells treated with 30 µg AP / mL DMSO were and those of protein spots of control.
HepG2 (2×10⁶ cells /mL)were incubated in 10 mL fresh media and treated with various concentrations(0、30 µg / mL) of AP extract in DMSO for 24hr. 2D-gels were stained with Sypro RubyTM and analyzed with ImagemasterTM. The quantity of each spot in the X-axis(AP G21Day30) is plotted on a log scale against the quantity of that in the Y-axis(control). If the spots quantity is the same in both treatments, its point will fall on the y = x line in the graph. If the quantities are not the same, the point will fall above or below the y = x line(slope = 1). The correlation coefficient(r = 0.91) for the regression line is shown on the graph. A coefficient of 1.00 indicates that the two images are perfectly similar. In this normalization, the total volume of all of the spots in the gel divides the volume of each spot.
r = 0.87 y = x y = 0.7x y = 1.3x 1 10 100 1000 1 10 100 1000 N o r m a l i z e d v o l u m e o f A P G 2 1 D a y 5 0 Nor mal ize d v olu me of co ntr ol AP G21Day50 線性 (non-difference spots) 線性 (+30 % difference of spots) 線性 (- 30 % difference of spots) 圖21-3、AP G21Day50 中不同蛋白質點標準化體積的相關性。
Figure20-3、Correlation between the normalized volume of protein spots of s HepG2 cells treated with 50 µg AP / mL DMSO were and those of protein spots of control.
HepG2(2×10⁶ cells /mL)were incubated in 10 mL fresh media and treated with various concentrations(0、50 µg / mL) of AP extract in DMSO for 24hr. 2D-gels were stained with Sypro RubyTM and analyzed with ImagemasterTM. The quantity of each spot in the X-axis(AP G21Day50)is plotted on a log scale against the quantity of that in the Y-axis(control). If the spots quantity is the same in both treatments, its point will fall on the y = x line in the graph. If the quantities are not the same, the point will fall above or below the y = x line(slope = 1). The correlation coefficient(r = 0.87) for the regression line is shown on the graph. A coefficient of 1.00 indicates that the two images are perfectly similar. In this normalization, the total volume of all of the spots in the gel divides the volume of each spot.
r = 0.92 y = x y = 0.7x y = 1.3x 1 10 100 1000 1 10 100 1000
l og(Norma l i se d vol ume of AP 3B 1Da y10)
log( N o rm a li se d vol u m e of c ont ro l) AP 3B1day10 線性 (non-difference spots) 線性 (+30 % difference of spots) 線性 (- 30 % difference of spots) 圖22-1、AP 3B1Day10 中不同蛋白質點標準化體積的相關性。
Figure 21-1、Correlation between the normalized volume of protein spots of s Hep3B cells treated with 10 µg AP / mL DMSO were and those of protein spots of control.
Hep3B(2×10⁶ cells /mL) were incubated in 10 mL fresh media and treated with various concentrations(0、10 µg / mL) of AP extract in DMSO for 24hr. 2D-gels were stained with Sypro RubyTM and analyzed with ImagemasterTM. The quantity of each spot in the X-axis(AP 3B1Day10) is plotted on a log scale against the quantity of that in the Y-axis(control). If the spots quantity is the same in both treatments, its point will fall on the y = x line in the graph. If the quantities are not the same, the point will fall above or below the y = x line(slope = 1). The correlation coefficient(r = 0.92) for the regression line is shown on the graph. A coefficient of 1.00 indicates that the two images are perfectly similar. In this normalization, the total volume of all of the spots in the gel divides the volume of each spot.
r = 0.82 y = x y = 0.7x y = 1.3x 1 10 100 1000 1 10 100 1000 lo g ( No r m alised v o lu me o f AP 3 B 1 Day 3 0 ) lo g(N o rm al is ed vol u m e of con tr ol) AP 3B1Day30 線性 (non-difference spots) 線性 (+30 % difference ofspots) 線性 (- 30 % difference of spots) 圖22-2、AP 3B1Day30 中不同蛋白質點標準化體積的相關性
Figure21-2、Correlation between the normalized volume of protein
spots of s Hep3B cells treated with 30 µg AP / mL DMSO were and those of protein spots of control.
Hep3B(2×10⁶
cells /mL) were incubated in 10 mL fresh media and treated with various concentrations(0、30 µg / mL) of AP extract in DMSO for 24hr. 2D-gels were stained with Sypro RubyTM and analyzed with ImagemasterTM. The quantity of each spot in the X-axis(AP 3B1Day30) is plotted on a log scale against the quantity of that in the Y-axis(control). If the spots quantity is the same in both treatments, its point will fall on the y = x line in the graph. If the quantities are not the same, the point will fall above or below the y = x line(slope = 1). The correlation coefficient(r = 0.82) for the regression line is shown on the graph. A coefficient of 1.00 indicates that the two images are perfectly similar. In this normalization, the total volume of all of the spots in the gel divides the volume of each spot.
r = 0.89 y = x y = 0.7x y = 1.3x 1 10 100 1000 1 10 100 1000
log(Norm alised volum e of AP 3B1Day50)
lo g(N o rm al is ed vol u m e of con tr ol) AP 3B1Day50 線性 (non-difference spots) 線性 (+30 % difference of spots) 線性 (-30 % difference of spots) 圖22-3、AP 3B1Day50 中不同蛋白質點標準化體積的相關性。
Figure21-3、Correlation between the normalized volume of protein spots of s Hep3B cells treated with 50 µg AP / mL DMSO were and those of protein spots of control.
Hep3B(2×10⁶ cells /mL) were incubated in 10 mL fresh media and treated with various concentrations(0、50 µg / mL) of AP extract in DMSO for 24hr. 2D-gels were stained with Sypro RubyTM and analyzed with ImagemasterTM. The quantity of each spot in the X-axis(AP 3B1Day50) is plotted on a log scale against the quantity of that in the Y-axis(control). If the spots quantity is the same in both treatments, its point will fall on the y = x line in the graph. If the quantities are not the same, the point will fall above or below the y = x line(slope = 1). The correlation coefficient(r = 0.89) for the regression line is shown on the graph. A coefficient of 1.00 indicates that the two images are perfectly similar. In this normalization, the total volume of all of the spots in the gel divides the volume of each spot.
-100 -50 0 50 100 150 200 250 300 350 400 -100 0 100 200 300 400 500 600
Volum e difference (%) of AP G21Day30
V o lu m e d if fe re nc e (%) of A P G 21D ay10 AP G21Day30 vs AP G21Day10
圖23-1、AP G21Day30 和 AP G21Day10 二者間蛋白質點體積差百分比之相關
性。
Figure23-1、Correlation between the percentage of volume difference of protein spots of AP G21Day30 and AP G21Day10.
HepG2(2×10⁶ cells /ml)were subsequently incubated in 10 ml fresh media and treated with various concentrations(0、10、30 µg / ml) of DMSO AP(DMSO dissolved AP methanol extract)for 24hr. Gels were stained with Sypro RubyTM and analyzed with ImagemasterTM. The volume difference (%) of each spot of AP
G21Day30 in the X-axis is plotted against that AP G21Day10 volume difference (%) in the Y-axis. The volume difference (%) of each spot of AP G21Day30 gel or AP G21Day10 gel was that compared with its matched spot in control gel(AP G21DayC).
-100 0 100 200 300 400 500 600 -100 -50 0 50 100 150 200 250 300 350 400
Volum e difference(%) of AP G21day50
V o lu m e d if fe re n ce( % ) o f A P G 2 1 d ay 1 0 AP G21day50 vs AP G21Day10
圖23-2、AP G21Day50 和 AP G21Day10 二者間蛋白質點體積差百分比之相關
性。
Figure23-2、Correlation between the percentage of volume different of protein spots of AP G21Day50 and AP G21Day10.
HepG2(2×10⁶ cells /ml)were subsequently incubated in 10 ml fresh media and treated with various concentrations(0、10、50 µg / ml) of DMSO AP(DMSO dissolved AP methanol extract)for 24hr. Gels were stained with Sypro RubyTM and analyzed with ImagemasterTM. The volume difference (%) of each spot of AP
G21Day50 in the X-axis is plotted against that AP G21Day10 volume difference (%) in the Y-axis. The volume difference (%) of each spot of AP G21Day50 gel or AP G21Day10 gel was that compared with its matched spot in control gel(AP 21DayC).
-200 -100 0 100 200 300 400 500 -200 -100 0 100 200 300 400
Difference of AP 3B1Day30 spots
D if fe re nc e of A P 3B 1D ay 10 spot s AP 3B1Day30 vs AP 3B1Day10 圖24-1、 AP 3B1Day30 和 AP 3B1Day10 二者間蛋白質點體積差百分比之 相關性。
Figure24-1、Correlation between the percentage of volume different of protein spots of AP 3B1Day30 and AP 3B1Day10.
Hep3B(2×10⁶ cells /mL)were subsequently incubated in 10 mL fresh media and treated with various concentrations(0、10、30 µg / mL) of DMSO AP(DMSO dissolved AP methanol extract)for 24hr. Gels were stained with Sypro RubyTM and analyzed with ImagemasterTM. The volume difference (%) of each spot of AP
3B1Day30 in the X-axis is plotted against that AP 3B1Day10 volume difference (%) in the Y-axis. The volume difference (%) of each spot of AP G21Day50 gel or AP 3B1Day10 gel was that compared with its matched spot in control gel(AP 3B1DayC).
-200 -100 0 100 200 300 400 500 600 700 -200 -100 0 100 200 300 400 500 600 700
Difference of AP 3B1Day50 spots
D if fe re nc e of A P 3B 1D ay 10 spot s AP 3B1Day50 vs AP 3B1Day10 圖24-2、 AP 3B1Day50 和 AP 3B1Day10 二者間蛋白質點體積差百分比之相關 性。
Figure 24-2、Correlation between the percentage of volume different of protein spots of AP 3B1Day50 and AP 3B1Day10.
Hep3B(2×10⁶ cells /mL)were subsequently incubated in 10 mL fresh media and treated with various concentrations(0、10、50 µg / mL) of DMSO AP(DMSO dissolved AP methanol extract)for 24hr. Gels were stained with Sypro RubyTM and analyzed with ImagemasterTM. The volume difference (%) of each spot of AP
3B1Day50 in the X-axis is plotted against that AP 3B1Day10 volume difference (%) in the Y-axis. The volume difference (%) of each spot of
AP 3B1Day50 gel or AP 3B1Day10 gel was that compared with its matched spot in control gel(AP 3B1DayC).
表9、蛋白質表現在不同草藥處理之比較
Table 9、Comparison of protein expression of HepG2 and Hep3B treated with various herb methanol extracts for 24 hrs
Herb extract AP MC AS AR RR Number of spots 612 308 336 564 381 HepG2 Matched spots(%) 57.74 50.65 56.55 57.29 47.51 Spots with ≧ or ≦ ≧50% 50% volume difference ≦50% 38 103 24 42 29 64 26 63 52 74 Number of spots 338 250 291 269 378 Hep3B Matched spots(%) 53.85 31.20 49.14 52.04 50.30 Spots with ≧ or ≦ ≧50% 50% volume difference ≦50% 129 106 32 77 36 81 123 53 45 69
HepG2 and Hep3B(2×10⁶ cells /mL)were seeded in 10 cm culture dishes for 24 hr, and were subsequently incubated in 10 mL fresh media and treated with 0.3 % various herb MeOH extracts. Cellular proteins were initially electrophoresed with a Multiphor II with pH 3-10 NL Ampholines and than electrophoresed on a 10-20 % polyacrylamide gel for the second dimentional separation. Gel was stained with silver stain method and analyzed with a ImagemasterTM .
表10、在不同濃度 AP 中草藥萃取物處理後 Hepg2 及 Hep3B 細胞之蛋白質表現 Table 10、Comparison of protein expression of HepG2 and Hep3B treated with
various levels(µg/mL)of methanol extracted AP
AP Concentration(µg/mL) 0 10 30 50
HepG2 Number of spots 788 666 776 839
Matched spots(%) 100 78.38 79.38 74.26 Spots with > or < >30% 30% volume difference <30% 88 153 132 123 186 90
Hep3B Number of spots 635 573 443 581
Matched spots(%) 100 73.65 72.69 71.77
Spots with > or< >30% 30% volume difference <30% 73 86 56 106 169 41
HepG2 and Hep3B(2×10⁶ cells /mL)were seeded in 10 cm culture dishes for 24 hr, and were subsequently incubated in 10 mL fresh media and treated with various concentrations(0、10、30 and 50 µg / mL)of DMSO AP(DMSO dissolved AP methanol extract)for 24hr(AP 3B1Day , AP G21Day). Cellular proteins were initially electrophoresed with a IPGphor II with pH 3-10 NL Ampholines and than
electrophoresed on a 10-20 % polyacrylamide gel for the second dimentional separation. Gels were stained with Sypro Ruby and analyzed with a ImagemasterTM
表11、蛋白質表現量在標準化體積中以不同濃度 AP 草藥處理之比較 Table 11、Comparison of protein expression of HepG2 and Hep3B treated with
various concentrations(µg / mL)of AP for 24 hrs after normalization of against control
Cell Concentration(µg / mL)of methanol AP
0 10 30 50 HepG2 +* 191 286 334 0 186 93 87 -** 331 329 287 Hep3B +* 97 185 262 0 176 77 83 -** 223 235 152
HepG2 and Hep3B(2×10⁶ cells /mL)were seeded in 10 cm culture dishes for 24 hr, and were subsequently incubated in 10 mL fresh media and treated with various concentrations(0、10、30 and 50 µg / mL)of DMSO AP(DMSO dissolved AP methanol extract)for 24hr(AP 3B1Day and AP G21Day). Cellular proteins were initially electrophoresed with a IPGphor II with pH 3-10 NL Ampholines and than electrophoresed on a 10-20 % polyacrylamide gel for the second dimentional separation. Gel was stained with Sypro Ruby and analyzed with a ImagemasterTM . A symbol(+or -)is represent to volume increase or decrease(the spots fall below or above the y = x(slope = 1)in Figure 26 and 27).
表12、蛋白質表現量在體積差中以不同濃度 AP 草藥處理之比較
Table 12、Comparison of protein expression of HepG2 and Hep3B treated with various concentrations(µg / mL)of AP for 24 hrs on the volume difference graph 30 vs 10 50 vs 10 AP G21Day X 軸 186 186 Y 軸 93 87 第一象限 96 123 第二象限 60 46 第三象限 192 177 第四象限 111 128 AP 3B1Day X 軸 176 176 Y 軸 77 83 第一象限 55 66 第二象限 22 11 第三象限 136 92 第四象限 64 104
HepG2 and Hep3B(2×10⁶ cells /mL)were subsequently incubated in 10 mL fresh media and treated with various concentrations(0、10、30、50 µg / mL) of DMSO AP(DMSO dissolved AP methanol extract)for 24hr. The gels were stained with Sypro Ruby and analyzed with Imagemaster. The volume difference (%) of each spot of AP G21Day30 gel or AP G21Day50 and AP 3B1Day30 gel or AP G21Day50 gel that compared with its matched spot in control gel(AP G21DayC or AP 3B1DayC).The gels were analyzed with Imagemaster. The number of spots in Figure 28 and 29 were counted by Imagemaster.
表 13、蛋白質的特性及功能
Table 13、Identities and functions of the proteins characterized. gi number(a series of digits that are assigned consecutively by NCBI to each sequence it processes)
Spot gi number pI / MW
(kDa) Protein Function
1 gi|7657548 6.0 / 16.43 spondyloepiphyseal dysplasia, late;sedlin may play role in vesicular transport from
endoplasmic reticulum to golgi 2
gi|11429768 5.9 / 28.85 mitochondrial short-chain enoyl-coenzyme
A hydratase 1 precursor
straight-chain enoyl-coa thioesters from c4 up to at least c16 are processed, although with decreasing catalytic rate
3 gi|12597637 6.2 / 42.66 hypothetical protein FLJ12934
4
gi|71828 5.4 / 52.12 fibrinogen gamma-B chain precursor fibrinogen has a double function: yielding monomers
that polymerize into fibrin and acting as a cofactor in platelet aggregation
5 gi|2795895 5.6 / 26.63 white protein homolog
6 gi|4503571 7.0 / 47.49 enolase 1, (alpha);
phosphopyruvate hydratase;
Involved in glycolysis pathway
7 gi|11493510 8.0 / 9.62 PRO0720
8 gi|1617118| 5.2 / 18.48 (X82321) TSA reduces peroxides、enhances NK cells activity
9 gi|4505773 5.6 / 29.84 prohibitin Role in regulating proliferation, inhibits DNA
10 gi|4885153 6.3 / 33.87 v-crk avian sarcoma virus CT10 oncogene homolog-like
11 gi|5032165 6.5 / 48.02 tryptophan 2,3-dioxygenase;
Tryptophan oxygenase
l-tryptophan + o2 = l-formylkynurenine
tryptophan metabolism 12
gi|2507461 6.0 / 57.16 DISULFIDE ISOMERASE ER-60 rearrangement of both intrachain and interchain
disulfide bonds in proteins to form the native structures, endoplasmic reticulum lumen
13 gi|227541 5.0 / 34.0 ribonucleotide reductase provides the precursors necessary for DNA synthesis;
參考文獻 上野洋一郎。組織培養技術。1999。藝軒圖書出版社。 中醫藥資訊網。中藥行政-常用中藥。行政院衛生署中醫藥委員會。 王聲遠、許梅玲、李旭生和蕭明熙。1993。靈芝與雲芝免疫增強作用之研究。中 醫藥年報11:257-276。 李一宏和呂文智。2000。刪補名醫方論。志遠書局。 何彥毅。2000。中藥厚朴抽取物厚朴酚對於乙醯氨酚引起急性肝損傷之動物模式 之研究。國立陽明大學傳統醫藥學研究所碩士論文。 行政院「第二次生物技術策略(SRB)會議」。1998 6 8-12。「議題結論報告」。主題一、 中藥發展策略。台灣。 行政院衛生署衛生統計-八十九年死因統計,2001。行政院衛生署。 行政院衛生署健康食品管理法及相關法規-健康食品之免疫調節功能評估方 法。1999。 沈成基。1985。中藥大黃對實驗性肝炎之療效。中國醫藥學院中國醫藥研究所碩 士論文。 周佳珍。2000。龍膽瀉肝湯及其主成分 baicalein 等對 Hep3B 細胞凋亡之影響。國 立臺灣大學藥理學研究所碩士論文。 洪淑敏。2000。靈芝促進人類肝癌細胞凋亡之研究。國立臺灣大學食品科技研究 所碩士論文。 洪業晃。1998。茵陳蒿湯之抗氧化的作用。中國醫藥學院中國醫藥研究所碩士論 文。 郭慧固和楊維傑。2000。內經知要譯解。志遠書局。 陳定信、賴明陽和陳建弘。本土醫學資料庫之建立及衛生政策上之應用。1991。 行政院衛生署八十年度委託研究計畫研究報告。 陳定信。慢性B,C 及 G 型病毒性肝炎之研究:分子流行病學、致病機轉、自然病 史與治療。1999。行政院衛生署八十八年度科技研究發展計畫研究報告。 常玉澤。2000。Magnolol 對人類肝癌細胞之抗肝癌活性的機制研究。台北醫學院 細胞及分子生物研究所碩士論文。 蛋白質體會議及研討會。2001。中央研究院生物化學所。台灣。 張立青。1998。大黃素調節人類細胞中核甘酸切除修補之分子機轉研究。高雄醫 學院生物化學研究所碩士論文。 張思平。1998。肝脂質過氧化之研究。台北醫學院生藥學研究所碩士論文。 張永勳。1997。台灣巿售易混用、誤用中藥品種之探討。中醫藥年報 15:476-624。