行政院國家科學委員會專題研究計畫 成果報告
利用植物及培養皿進行大陸沙塵暴實際沉降量監測之研究
計畫類別: 個別型計畫 計畫編號: NSC91-2313-B-002-356- 執行期間: 91 年 08 月 01 日至 92 年 07 月 31 日 執行單位: 國立臺灣大學植物病理與微生物學系暨研究所 計畫主持人: 孫岩章 計畫參與人員: 林雨亭 報告類型: 精簡報告 處理方式: 本計畫可公開查詢中 華 民 國 92 年 12 月 31 日
行政院國家科學委員會補助專題研究計畫成果報告
※※※※※※※※※※※※※※※※※※※※※※※
※
利用植物及培養皿進行大陸沙塵暴實際沉降量監測之研究
※
※
Study on the monitoring of deposited yellow sand storm ※
※
particles from mainland China by plants and petri dishes
※
※※※※※※※※※※※※※※※※※※※※※※※※
計畫類別:v□個別型計畫 □整合型計畫
計畫編號:NSC91-2313-B-002-356
執行期間: 91 年 8 月 1 日至 92 年 7 月 31 日
計畫主持人:孫岩章
共同主持人:
本成果報告包括以下應繳交之附件:
□赴國外出差或研習心得報告一份
□赴大陸地區出差或研習心得報告一份
□出席國際學術會議心得報告及發表之論文各一份
□國際合作研究計畫國外研究報告書一份
執行單位: 台灣大學植物病理與微生物學系
中 華 民 國 92 年 12 月 25 日行政院國家科學委員會補助專題研究計畫成果報告
利用植物及培養皿進行大陸沙塵暴實際沉降量監測之研究
(
Study on the monitoring of deposited yellow sand storm particles from mainland China byplants and petri dishes
)
計畫編號:NSC91-2313-B-002-356
執行期限:91 年 8 月 1 日至 92 年 7 月 31 日
主持人:孫岩章(
En-Jang Sun)
執行機構及單位名稱:台灣大學植物病理與微生物學系
計畫參與人員:林雨亭中文摘要
目前環保單位對大陸沙塵暴的監測主要是根據台灣地區各監測站之
懸浮微粒 PM10 監測值,外加國外之情報資料加以研判,但此些皆屬間接
證據,因為 PM10 是代表總量,而無法代表沙塵暴的單一數量。為此本研
究乃在過去兩年發展出一種直接的微粒採樣皿,配合適當遮雨柵欄,設法
對大陸沙塵暴(Yellow sand storm)微粒加以實際採樣及監測。此塑膠遮雨柵
欄為雙層型,以垂直方式於四面圍成箱形,上下則由平板遮蓋,構成遮雨
而不遮沙塵之採樣器。在此採樣器中央擺設一兩升燒杯,再於其內放置 9
公分之微粒採樣培養皿,內含一 76 x 26 mm 之載玻片,且每週於週 1、3、
5 更換此採樣培養皿,達成一週採樣三次之任務。載玻片上之微粒即以上
光源顯微鏡配合暗視野顯微鏡加以鑑別。在以台北市台灣大學為首站進行
兩年之監測與鑑定之後,發現大陸沙塵暴及背景沙塵微粒在上光源配合暗
視野顯微鏡下呈現出亮黃或亮褐色,此與其他黑煙、汽機車微粒、海鹽、
花粉等皆屬不同。又發現當大陸沙塵暴進襲時每 200 倍視野之顆粒數(粒徑
以 5-20 微米為準)會顯著升高。經兩年之分析,確定在 200 倍視野之顆粒
數大於 10 以上時即表示有大陸沙塵暴之污染事件(Episode)。在 2003 年之
監測中發現在二月及三月中各有三次之污染事件。此一方法證實可提供一
直接監測大陸沙塵暴污染事件之技術,以補充目前大陸沙塵暴監測純粹仰
賴 PM10 間接資料之不足。也因此建議環保單位應在未來加用此一監測技
術,以求確實監測此一跨國之空氣污染。
( English Abstract)
Monitoring of China Sand Storm Particles with Petri Dish and
Glass Slide in Shelter
Abstract
At present time China sand storm particle was only monitored by an indirect method, the PM10 monitoring system in Taiwan. However the PM10 data represent only the total amount of fine particles and is not appropriate for expressing the severity of China sand storm in concerned areas. For this purpose we had developed a microscopic technique during the past two years that can detect and identify the sand particles. A meteorological shelter with two layers of shutter at four directions was designed for monitoring the target sand particles. Within the shelter a 2-liter beaker was placed and a 9-cm petri dish with glass slide was adhered in the beaker. The petri dish with glass slide was replaced with new one each for 2 –3 days. Exposed slides were observed under dark field metallurgical light microscope. Results showed that sand particles were differentiable from other anthropogenic particles. Typical sand particles were shiny yellow, yellowish or brown. Those with size 5-20 um are chosen as indicator particle species for use in counting the deposition. In non-sand storm days the background particle number per field is less than 10. From the results of particle counting in February and March 2003, we have found three and three sand storm episodes at Taipei, respectively. The microscopic approach provides us a direct method for detecting or measuring the severity of sand storm. We therefore recommend this approach to be used in other country or areas for monitoring this transboundary particle pollution.
Key words: Sand storm; Microscopy; Particle; PM10; Taiwan
(Accepted for presentation in IUAPPA’s 14th Regional Conference – Air Quality: Assessment and Policy at Local Regional and Global Scales, at Dubrovnik, Croatia, on October 6-10, 2003)
Introduction
The sand storm in East Asia is a very important issue as it attacks most of the countries, including China, Japan, and Korea (Kim & Park 2001; Kim et al, 2001; Ma et al., 2001; Zhang, 2003). It also spread over Taiwan and Hong Kong (Fang et al 1999; Lin 2001; Young et al., 1997). After a long-range transport this yellow sand particle can even reach Hawaii and
America continent (Perrington et al., 1983). The sand storm not only impairs the sky visibility, contaminates the materials, covers the green plant leaves, but also increases the PM10 level, causing human health effects in many urban cities (Kim et al, 2001; Lin 2001; Sabbioni, 1995; Young et al., 1997; Zhang, 2003). For instance the total suspended particulate (TSP) level reached to 3906 ug/m3 on April 6, 2000 at Beijing (Zhang, 2003), while the health standard is set
at only 250 ug/ m3 in Taiwan. It is on this health concern that scientists need to study the pollution event and monitor the pollution severity.
Basically any kinds of particle should have its physical or chemical characteristics that scientist can use to identify and differentiate them from other species of particles (Chen & Sun 1998; Cheng et al., 1976; Farmer& Linton, 1984; Kaufherr & Lichtman, 1984; Ma, 2001; Mamane, 1986; McCrone & Delly, 1973; Rose, 1996; Schure et al., 1985; Sun, 1993a; 1993b; 1993c; 1994a; 1994b; 2001; Sun & Chen, 1998). However since the sand storm particles are originated from Gobi Desert, the soil type particle had great variation in chemical composition, and may have similar composition to those from local emission, making them difficult for chemical speciation and identification (Kim et al, 2001; Rao et al., 2001). Even the enrichment elements are not easy to select as those in modern receptor modeling technique. Right now Taiwan EPA (Environmental Protection Administration of Taiwan) had used PM10 data and other meteorological information to predict the occurrence of the sand storm episode around the island. It was a great concern that raised PM10 is only an indirect evidence of the sand storm episode as other pollution sources may also contribute to this parameter.
It was based on this concern that we initiated this study since 2000. Part of the results had been published in ASAAQ Conference held in March 2003 at Japan (Sun & Tsau, 2003). Briefly we had developed a direct detection method to monitor the occurrence of sand storm. Under the light microscope, especially the dark-field microscope, we found that the China sand particles showed shiny yellow to brown color, that is differentiable from other anthropogenic particles and salt spray aerosols (Sun, 1994b). Results also showed that the sand particle number per microscope field increased correspondingly, following the EPA’s prediction. With this technique we had detected 2, 3, 1 and 1 storm episodes in February, March, April, and May 2001, at Taipei. In this report we have tried to compare the particle deposition with PM10 data and tried to provide more results about monitoring the sand particles using the microscopic technique.
Materials and Methods
Collection device for sand storm particle
An anti-rain sampling shelter was designed and established at National Taiwan University (NTU). The shelter is following an early design for collecting air-borne particles as described in a previous report (Sun, 1993c). Principally the shelter is made by four pieces of two-layer plastic shutter (each 36 x 22 cm, consist of an outer frame and 6 pieces of slant board, like those used in bathroom door). They were clamped to each other to form a square fort that can keep the rain droplets from coming into the central petri dish. On the top of the fort is a 60 x 60 x 1 cm square plastic roof. On the bottom is a 40 x 40 x 1 cm square plastic board. The whole shelter is placed at open roof space of a four-floor building with height of 16 m. It is supported by four 1.5 m tall stainless steel poles. One of the four shutters is designed into an openable door with magnetic lock. A 2-liter plastic beaker (19 cm tall, 12.5 cm wide) is adhered at the center of bottom board for further protection from rain or mist interference. A 9-cm plastic petri dish with clean glass slide ( 7.5 x 2.5 x 0.1 cm, No. 2041 of Assistent Co., Germany) is placed in the center of the open beaker for collecting the sand storm particles.
Generally the 9-cm plastic petri dish with glass slide was replaced with new set in the late afternoon on every Monday, Wednesday, and Friday. The exact collecting time and period were recorded afterward. The new petri dish with glass slide is opened only on site just before use. The exposed one was immediately covered and the whole petri dish with glass slide was taken back to laboratory for particle identification and counting.
Microscopic identification and counting of sand storm particles
For general particle identification, we use a microscopic system that contains a metallurgical light microscope (Olympus BH2-UMA) which use a vertical light source, a polarizing microscope (Olympus BH-2), and a scanning electron microscope (SEM)
(JEOL-T330A) installed with an energy-dispersive X-ray (EDX) analyzer (Link QX 2000). The SEM-EDX system was operated under the following conditions: 20-kv accelerating voltage, 60 uA beam, and 15/ 38 cm working distance. Elements heavier than sodium are detectable when a Be window is used, while those heavier than boron are also detectable when a windowless option is applied. However, for the sand particle identification in this study, we found that the SEM-EDX system was not so necessary.
The sand particle collected from Beijing in winter and spring in recent years were used as reference samples for particle identification. The samples were collected with the same set of 9-cm plastic petri dish with glass slide at Beijing City when the sand storm occurred there. Particle samples collected at NTU in spring and all other seasons were also identified and compared with those from Beijing.
For sand particle counting on each slide, the typical shiny small particles with size 2-10 um were used as indicator particles, as preliminary study showed that they are adequate indicator for sand storm particles. Totally three observers were trained in recognizing the particles, measuring the size and counting them. Usually ten microscopic fields at 200X magnification were observed and the typical particles were counted. The particle number per field were averaged and compared with PM10 data for further analysis.
Correlation between deposited particle number and PM10
The hourly PM10 data of the Kutin Air Quality Monitoring Station of Taiwan EPA, located 1 km west from our particle collection site, were obtained from Taiwan EPA. The average PM10 concentrations for the period of particle collection were calculated. The correlation between the particle number and PM10 data was determined with the equation of correlation coefficient. For this year, the February and March data were analyzed.
Microscopic identification and counting of sand storm particles
The sand particles collected from Beijing were observed and used as reference particles in this study. Generally the Beijing sand storm particles exhibit amorphous shape under light microscopes, although some minor particles have different shape or color. Under a common metallurgical light microscope, typical sand particle showed dark gray to brownish color. Under a polarizing microscope (Olympus BH-2), the sand particles showed various but non-specific colors, depending on the polarizing angle. However, when they were observed in dark field condition under metallurgical light microscope (Olympus BH-2-UMA, with top vertical illumination) at magnification of 200X or 500X, they reflected the light and show shiny colors of bright yellow, yellowish brown or brown.
Under the dark field metallurgical light microscope, the sand particles were differentiable from other anthropogenic particles such as black sphere from heavy oil combustion, carbon black from diesel combustion, color droplets from painting industry, and cement dust from construction site.
Generally the size of Beijing sand particles ranged from 1 to 60 um. The similar sand particles could be also found in samples collected in non-sand storm days or seasons in Taipei, Taiwan, but the particle number per field was significantly lower than those collected in sand storm days, especially the small shiny ones with size of 5-20 um. The particle numbers in non-sand storm day or season then could be recognized as a background number or
concentration.
For sand particle counting on each exposed slide, only the typical shiny small particles with size 5-20 um were taken into account. Usually the counting for ten microscopic fields at 200X magnification was enough for representing each slide sample. In a preliminary study we found that the standard deviation for a ten-field counting was not significantly different from a 20-field counting. Therefore the ten-field counting was adopted for all the samples in this study. For each exposed slide two to three observers were assigned for the observation and counting. The mean of them is adopted for all the values shown in the tables or figures.
Performance of collection device in shelters
The anti-rain collection device was tested for its efficiency in controlling the rain
interference. During the 2002 winter season, when it rained heavily, the petri dish with glass slide was carefully examined after the rain. Generally, they performed very well in
protecting the petri dish from rain droplets. The salt spray droplets can easily come into the petri dish, but not turning into an interference factor.
When three shelters as described above were installed at the same open roof space at NTU, each was separated for a distance of 2 m, the counted particle numbers were very similar, indicating that they can represent for each other. Therefore only one station was operated after the preliminary study.
Correlation between deposited particle number and PM10
The PM10 data of Kutin Air Quality Monitoring Station of Taiwan EPA, located 1 km west from our particle collection site, were compared with the sand particle number data in this study. Since in 2003 the occurrence of sand storm in Taipei is not so frequent as previous years, only the data of February and March 2003 were analyzed.
Since generally background particle number per field at 200X magnification under dark field metallurgical light microscope is less than 10, the samples with particle number equal or greater than ten were recognized as contaminated from the China sand storm.
From the results of particle counting in February 2003, we have found three sand storm deposition episodes at Taipei (Table 1). Two of them are mild as the particle numbers are only 10 and 14 per microscopic field. For March, also three episodes were found (Table 2, Table 3), although two of them are mild with particle number of 12 and 16, respectively. For these three episodes in February the particle number per field ranges from 10 to 25, while the background values are 2-9. For the three episodes in March the range of particle number is 12-27,while the background values are 2-9. The deposition density of the particle however is about ten times lower than those of Beijing samples, collected in November 2002 (Data not shown).
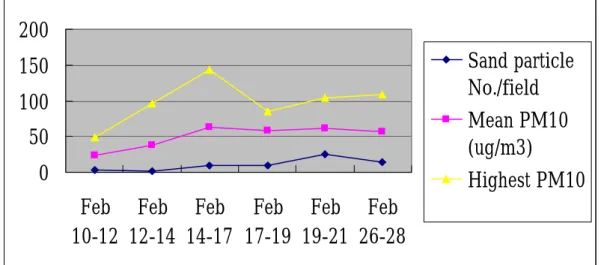
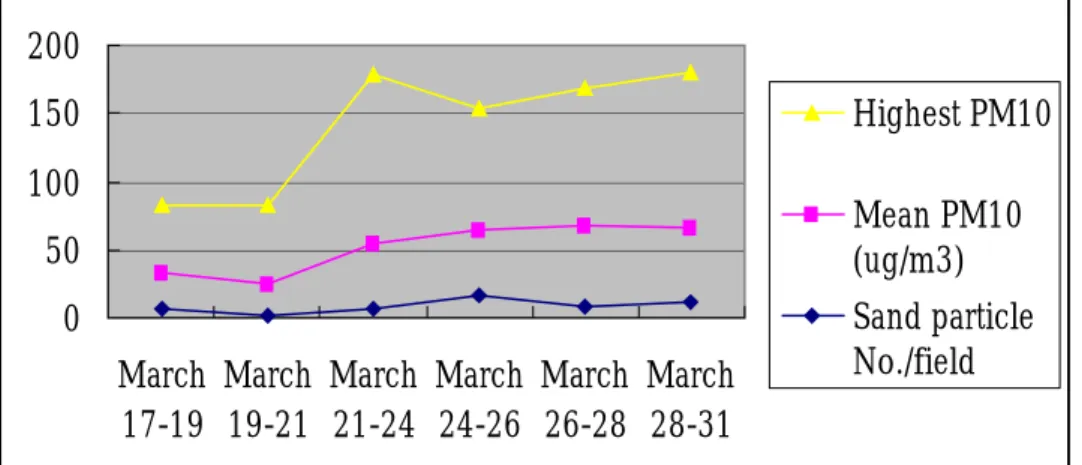
The PM10 data, however, did not have same changing tendency as those of sand particle number data in this study. For February data, we found that highest PM10 occurred mostly on the non-sand storm days (Fig. 1). In March, the situation is about the same (Fig. 2, Fig. 3). These results indicate that local emission sources are more important than the China sand
storm in these two months.
Taiwan EPA had reported that PM10 levels were greatly raised when heavy sand storm occurred in Taiwan. Scientist therefore had tried to adopt the PM10 data to track the
occurrence of sand storm. In our study we found that this approach is not adequate, as other emission may be larger than the sand storm, especially when the storm is mild. This
The deposited sand particle provided us a direct evidence of the occurrence of China sand storm in Taiwan. We therefore recommend that this approach can be used in other countries or other areas for detection of the sand storm episodes.
Conclusion
In this study, we found: (1) The anti-rain shelter performed very well in preventing the rain interference and is adequate for sand particle collection; (2) Under the dark field metallurgical light microscope, the sand particles were differentiable from other
anthropogenic particles; (3) The shiny small amorphous particles with size 5-20 um can be used as indicator particle species for use in counting the deposition, as generally background particle number is less than 10; (4) From the results of particle counting in February and March 2003, we have found three sand storm episodes in each month at Taipei; (5) The microscopic approach provide us a direct method for detecting or monitoring the sand storm; and (6) We recommend this approach can be used in other country or areas to monitoring this transboundary pollution.
Acknowledgement
This study was supported by grants from National Science Council, ROC (Grant #NSC-91-2313-B-002-356 ). The author is also grateful to Dr. Reyi Wu, for her help in collecting the sand storm samples in Beijing.
Literature Cited
Chen, W. Y., and Sun, E. J., 1998. Identification of particulate matters deposited on plant surface. J. Chin. Environ. Prot. Soc. 21, 166-174.
Cheng, R. J., Mohnen, V. A., Shen, T. T., Current, M., and Hudson, J. B. (1976) Characterization of particulates from power plants. J. Air Pollut. Control Assoc. 26:787-790.
Fang, M., Zheng, M., Wang, F., Chim, K. S., and Kot, S. C. 1999. The long-range transport of aerosols from Northern China to Hong Kong—A multi-technique study. Atmosph. Environ.33: 1803-1817.
Farmer, M. E., and Linton, R. W. 1984. Correlative surface analysis studies of environmental particles. Environ. Sci. Technol 18:319-326.
Kaufherr, N., and Lichtman, D. 1984. Comparison of micron and submicron fly ash particles using scanning electron microscopy and X-ray elemental analysis. Environ. Sci. Technol. 18:544-547.
Kim, B. G.. and Park, S. U. 2001. Transport and evolution of a winter-time yellow sand observed in Korea. Atmosph. Environ. 35: 3191-3201.
Kim, K. W., Kim,Y. J. and Oh, S. J. 2001. Visibility impairment during yellow sand periods in the urban atmosphere of Kwangju, Korea. Atmosph. Environ. 35: 5157-5167.
evidence and simulation. Atmosph. Environ. 35: 5873-5882.
Ma, C. J., Kasahara, M., Tohno, S., and Hwang, K. C. 2001. Characterization of the winter atmospheric aerosols in Kyoto and Seoul using PIXE, EAS and IC. Atmosph. Environ. 35: 747-752.
Mamane, Y., Miller, J. L., and Dzubay, T. G. 1986. Characterization of individual fly ash particles emitted from coal- and oil-fired power plants. Atmosph. Environ. 20:2125-2135. McCrone, W. C., and Delly, J. G. 1973. The Particle Atlas, 2nd Ed., Ann Arbor Science,
Michigan.
Page, A. L. and Chang, A. C. 1979. Contamination of soil and vegetation by atmospheric deposition of trace elements. Phytopathology 69:1007-1011.
Perrington, J. R., Zoller, W. H., and Aras, N. K. 1983. Asian dust: Seasonal transport to Hawaiian Islands. Science 220: 195-197.
Ro, C. U., Oh, K. Y., Kim, H., Chun, Y., Osan, J., de Hoog, J., and van Grieken, R. 2001. Chemical speciation of individual atmospheric particles using low-Z electron probe X-ray microanalysis: Characterizing “Asian Dust” deposited with rainwater in Seoul, Korea. Atmosph. Environ. 35: 4995-5005.
Rose, N. L. 1996. Inorganic fly-ash spheres as pollution tracers. Environ. Pollut 91:235-252. Sabbioni, C. 1995. Contribution of atmospheric deposition to the formation of damage
layers. Science of the Total Environment 167:49-55.
Schure, M. R., Soltys, P. A., Natusch, D. F. S., and Mauney, T. (1985) Surface area and porosity of coal fly ash. Environ. Sci. Technol. 19:82-86.
Sun, E. J., 1993a. Microscopic identification of atmospheric black smoke particles from heavy oil combustion. J. Chin. Environ. Prot. Soc. 21, 166-174.
Sun, E. J., 1993b. Microscopic identification and source apportionment of airborne particles deposited in northern and central Taiwan. J. Chin. Environ. Prot. Soc. 21, 166-174.
Sun, E. J., 1993c. Microscopic identification and X-ray microanalysis of smoke particles deposited on vegetation surface originated from an oil-fired power plant. Plant Pathol. Bull. 1: 196-202.
Sun, E. J., 1994a. Air pollution injuries to vegetation in Taiwan. Plant Disease 78, 436-440. Sun, E. J., 1994b. Studies on scorching of rice plants and trees on northwestern coastal areas of Taiwan IV. Microscopic and chemical identification of salt spray droplets in the atmosphere. Plant Prot. Bull. 36: 301-312.
Sun, E. J., 2001. Environmental Pollution and Identification of Its Adverse Effects. Scientific Technology Publ. Co., Taipei, Taiwan.
Sun, E. J. and Chen, W. Y. 1998. Identification of black particles on building and vegetation from oil-fired power plant using various microscopes and energy-dispersive X-ray analyzer. Proceedings Air & Waste Management Association’s 91th Annual Meeting & Exhibition, June 14-18, 1998, San Diego, CA, USA.
Sun, E. J. and Tsau, H. S. 2003. Detection of China sand storm particles with glass slide and microscope. Proceedings of 8th International Conference on Atmospheric Sciences and Application to Air Quality. Tsukuba Science City, Japan. March 11-13, 2003.
Young, C. Y., Lee, K. H., and Liu, C. M. 1997. A comparison of air-quality data obtained during a dust-storm event and a local pollution episode- March 12-16, 1995. Journal of the Chinese Environmental Protection Society 20(1): 1-38.
Zhang, R. 2003. Recent observation of dust storm in Beijing. Proceeding of 8th International Conference on Atmospheric Science and Applications to Air Quality. March 11-13, Tsukuba, Japan.
Table 1. Sand storm particle deposition and its correlation with PM10 at Taipei during Feb 17 -28, 2003 Sampling period Sand particle No./field
Mean PM10 (ug/m3) Highest PM10
Feb 10-12 3 23 49 Feb 12-14 2 38 96 Feb 14-17 9 63 144 Feb 17-19 10 59 85 Feb19-21 25 61 104 Feb 26-28 14 57 109
Table 2. Sand storm particle deposition and its correlation with PM10 at Taipei during March 3 -13, 2003
Sampling period Sand particle No./field
Mean PM10 (ug/m3) Highest PM10
March 3-5 3 30 68 March 5-7 2 51 148 March 7-10 27 57 97 March 10-12 4 28 73 March 12-14 4 29 80 March 14-17 7 55 149
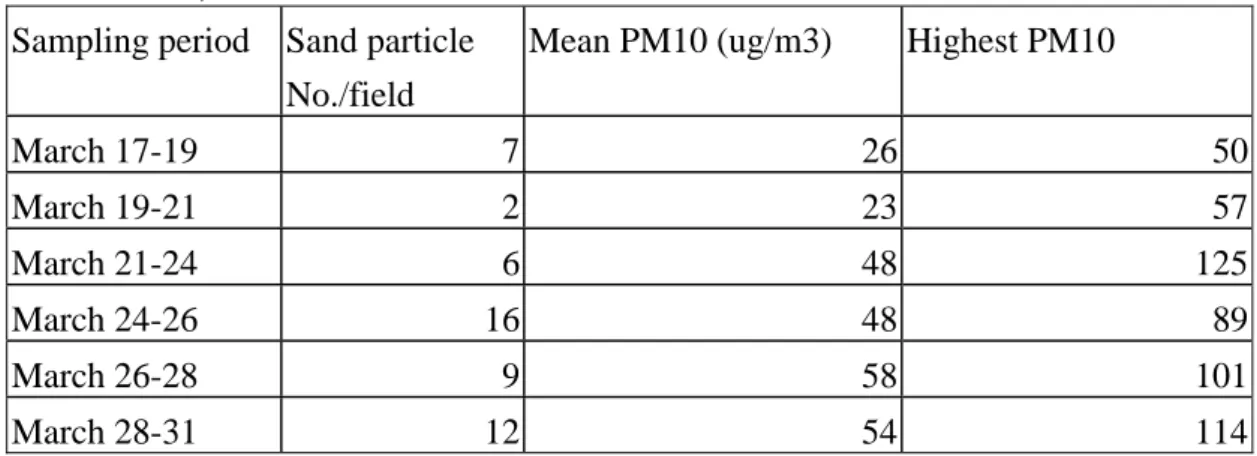
Table 3. Sand storm particle deposition and its correlation with PM10 at Taipei during March 17-31, 2003.
Sampling period Sand particle No./field
Mean PM10 (ug/m3) Highest PM10
March 17-19 7 26 50 March 19-21 2 23 57 March 21-24 6 48 125 March 24-26 16 48 89 March 26-28 9 58 101 March 28-31 12 54 114
0
50
100
150
200
Feb
10-12
Feb
12-14
Feb
14-17
Feb
17-19
Feb
19-21
Feb
26-28
Sand particle
No./field
Mean PM10
(ug/m3)
Highest PM10
Fig. 1. Correlation between deposited sand storm particles and mean and highest PM10 at Taipei during Feb. 10 -28, 2003.
0
50
100
150
200
March
3-5
March
5-7
March
7-10
March
10-12
March
12-14
March
14-17
Sand particle
No./field
Mean PM10
(ug/m3)
Highest PM10
Fig. 2. Correlation between deposited sand storm particles and mean and highest PM10 at Taipei during March 3 -17, 2003.
0 50 100 150 200 March 17-19 March 19-21 March 21-24 March 24-26 March 26-28 March 28-31 Highest PM10 Mean PM10 (ug/m3) Sand particle No./field
Fig. 3. Correlation between deposited sand storm particles and mean and highest PM10 at Taipei during March 17 -31, 2003.