國立交通大學
科技管理研究所
博士論文
科技政策與計畫之結構評估模式
A Structure Evaluation Model for Technology
Policies and Programs
研 究 生:李宗偉
指導教授:曾國雄 講座教授
科技政策與計畫之結構評估模式
A Structure Evaluation Model for Technology Policies
and Programs
研 究 生:李宗偉 Student: Chung-Wei Li
指導教授:曾國雄 講座教授 Advisor:
Gwo-Hshiung Tzeng
國立交通大學
科技管理研究所
博士論文
A Dissertation
Submitted to the Institute of Management of Technology
College of Management
National Chiao Tung University
In partial fulfillment of the
Requirements for the degree of
Doctor of Philosophy
in
Management of Technology
March 2009
Hsinchu, Taiwan, Republic of China
中華民國九十八年三月
科技政策與計畫之結構評估模式
研 究 生:李宗偉 指導教授:曾國雄 講座教授
國立交通大學科技管理研究所
摘 要
在科技管理領域中,管理者經常在充滿不確定性的決策環境中做決策,尤其在面 對如資訊、生物、奈米等新興科技時,決策者常面臨複雜且交錯的決策問題。在 解決複雜的問題時,將問題的考量因素及因素間相互的關係予以圖型化,有利於 釐清複雜問題中相關的議題及概念。DEMATEL 方法主要的目的即在於研究並解 決複雜且決策因子交錯的問題。此方法現在已經廣泛被應用於問題分析或工業規 劃等領域之中。應用 DEMATEL 方法時,可以將欲解決的問題予以圖像化,而 這圖像亦反應了參與決策的人員對問題的認知情形。但是要得到合適的圖像,門 檻值的設定將影響後續對問題的分析或解決方式。在以往,門檻值通常是經由專 家們討論之後定案,但在獲得門檻值的共識是一件困難的事,有時候,亦會由研 究者自行考量後訂定,而此將導致不同的研究者將得到不同的門檻值。本論文提 出最大平均熵差法(Maximum Mean De-Entropy, MMDE)來解決此問題。本論文亦 將引用「矽智財交易中心」之政策規劃及「數位學習」之成效評估模式等兩個案 例,說明本方法之可行性,並比較本方法與傳統經由專家們決定門檻值間之異同 之處。A Structure Evaluation Model for Technology Policies
and Programs
Student: Chung-Wei Li Advisor:
Gwo-Hshiung Tzeng
Institute of Management of Technology, National Chiao Tung University
Abstract
Most fields in the management of technology experience uncertainty in the environment of decision-making, especially in emerging technology fields. Information technology, biotechnology and nanotechnology are good examples of sectors with complex coordination problems. To deal with complex problems, structuring them through graphical representations and analyzing causal influences can aid in illuminating complex issues, systems, or concepts. The DEMATEL method is a methodology which can be used for researching and solving complicated and intertwined problem groups. The applicability of the DEMATEL method is widespread, ranging from analyzing world problematique decision making to industrial planning. The end product of the DEMATEL process is a visual representation—the impact-relations map—by which respondents organize their own actions in the world. In order to obtain a suitable impact-relations map, an appropriate threshold value is needed to obtain adequate information for further analysis and decision-making. To obtain the reasonable threshold value, with respect to the difficulty of discussions with experts, the researcher may decide upon the value subjectively themselves. This result may differ among researchers. In this dissertation, we propose a method based on the entropy approach, the Maximum Mean De-Entropy (MMDE) algorithm, to achieve this purpose. Using real cases to find the interrelationships between the criteria for planning SIP Mall policy and evaluating effects in E-learning programs as examples, we will compare the results obtained from the respondents and from our method, and discuss that the different impact-relations maps from these two methods.
Keywords: management of technology, DEMATEL, Maximum Mean De-Entropy
誌 謝
論文研究與口試期間承蒙交通大學虞孝成教授、洪志洋教授、元智大學曾芳 美教授、中原大學胡宜中教授、及致理管理學院張正昌教授撥冗審閱與指正,使 本論文疏漏謬誤之處得以匡正,在此致上最深謝意。 在交大科管所期間,感謝袁建中教授、虞孝成教授、徐作聖教授、洪志洋教 授的教導,使我在專業知識及研究態度與方法上得益甚多,很高興能從本所畢 業,我也深以此為榮。 曾國雄講座教授是一位非常令人尊敬的老師,曾老師對於學生的照顧,可說 無微不至:小從對身體健康的關懷,大至人生處世態度的分享與生涯規劃的建 議,曾老師總是竭盡所能的予以協助;對學生的耐心及追求新知與研究的熱誠, 總讓我感到他真是師道的榜樣。我如果未來在學術界中發展,曾老師永遠是我學 習的對象,我衷心慶幸能成為他的學生。 我感謝研究所這段期間中,與我共同學習的學長、學姊、學弟、學妹們,無 論在學術上的相互砥勵,或是在生活上相互的照應,沒有你們,我應該完成不了 學業;和我同時進入本所博士班的同學們,無論是才華、文漢、仁帥、筱琪、雅 雯、辭修、鴻裕、華凱,或是半途另謀高就當新娘子的維芯,大家共同生活的記 憶,每每想起,總是笑意。國防部的一些好友,在我心情低落的時候,總能給我 一些溫暖的鼓勵,元凱、逸舟、坤佑、麗卿、曉雯…,謝謝各位;特別感謝宗耀 學長,你的協助與關懷,我點滴心頭。 我的妻子與兒子,一直以來就是我生活的重心與最親愛的人,總是給我過多 的包容與體諒,是我一切動力的來源,我能獲得博士學位,這兩位是成就這功名 的最大支柱。 我總喜歡陳之藩的一段文句:「因為需要感謝的人太多了,就感謝天罷。無 論什麼事,不是需要先人的遺愛與遺產,即是需要眾人的支持與合作,還要等候 機會的到來。越是真正做過一點事,越是感覺自己的貢獻之渺小」。一路走來, 遇到的貴人太多;我,總顯得渺小。 李宗偉 謹誌 中華民國九十八年三月二十一日 于 新竹交通大學 科技管理研究所Abstract (Chinese) ………..………..….ii Abstract………..……….….iii Acknowledgements………...………..….iv Contents……….………..….v List of Tables……….……..….vii List of Figures………..….viii Chapter 1 Introduction...1 1.1 Background ...1 1.2 Research Purpose ...3
1.3 Framework and Methods ...5
1.4 Assumptions of Dissertation ...6
1.5 Outline of Dissertation...7
Chapter 2 Literature Review ...8
2.1 Methods for Technology Policy Planning...10
2.2 Methods for Technology Program Evaluation ...14
2.3 SIP Mall Policy Planning...16
2.3.1 The functions of an SIP Mall ...17
2.3.2 Factors Contributing to the Development of the SIP Mall ...19
2.3.3 . Issues Faced by SIP Malls ...20
2.4 E-Learning Programs Evaluation...23
2.4.1 Introduction...23
2.4.2 Methods for Evaluating E-Learning Course Effectiveness...25
Chapter 3 Models for Technology Policy Planning and Programs Evaluation....27
3.1 The Factor Analysis ...27
3.2 The DEMATEL Method ...28
3.3 Fuzzy Measure and Fuzzy Integral ...31
3.4 Analytical Hierarchy Procedure (AHP) ...33
3.5 Maximum Mean De-Entropy Algorithm (MMDE) ...35
3.5.1 Information Entropy...37
3.5.2 The Dispatch- and Receive-Nodes...38
Chapter 4 Applications of MMDE Algorithm in Technology Management ...44
4.1 Policy Planning of the SIP Mall...44
4.1.1 . DEMATEL Method and Interrelated Factors ...45
4.1.2 Results and Implications ...46
4.1.3 . Discussions ...50
4.2 The Usage of MMDE Algorithm in SIP Mall Case ...52
4.3 Evaluation of the E-learning Program ...56
4.3.1 A Hybrid MCDM Model for Program Evaluation...56
4.3.2 Empirical Experiment of the Hybrid MCDM Model ...59
4.3.3 Results and Analysis ...61
4.3.4 Discussions ...67
4.4 The Usage of MMDE Algorithm in the E-learning Case...70
Chapter 5 Conclusions and Remarks...72
5.1 Discussions ...72 5.2 Conclusions...74 5.3 Remarks ...76 References………..….76 Appendixes………..….84 Autobiography………..….88
LIST OF TABLES
Table 3-1 Scale of relative importance……….35 Table 3-2 The results from Step 1 to Step 6……….42 Table 4-1 The results derived from Steps 2 to 6 using the MMDE algorithm……….55 Table 4-2 Reliability analysis results………62 Table 4-3 Factor analysis result: names and components (criteria) of factors……….63 Table 4-4 Fuzzy measure for two final affected elements of factor 1………..65 Table 4-5 Fuzzy integral results of each element in different programs ………..66 Table 4-6 Final score of each program……….67 Table 4-7 The results obtained from the respondents and from MMDE method.….71
LIST OF FIGURES
Figure 1-1 The steps of the DEMATEL method………..4
Figure 1-2 Research Framework………..5
Figure 1-3 Outline of Dissertation ………..7
Figure 2-1 Development of Multiple Objective Decision Making ………..13
Figure 2-2 Development of Multiple Attribute Decision Making………16
Figure 2-3 Services the SIP Mall provides to facilitate the phases of the SIP trade…17 Figure 3-1 Example of a direct graph………...30
Figure 3-2. Diagrams of traditional Riemann integral and non-additive fuzzy integral (Choquet integral)……….……. 33
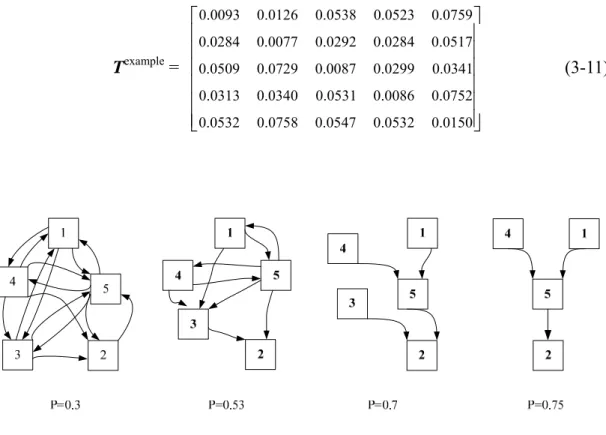
Figure 3-3 Impact-relations maps based on the same total relation matrix but different threshold values………... .….36 Figure 4-1 The total relation matrix of the SIP mall case……….…...46
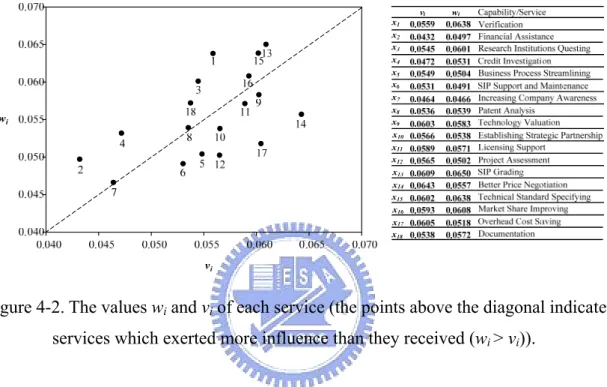
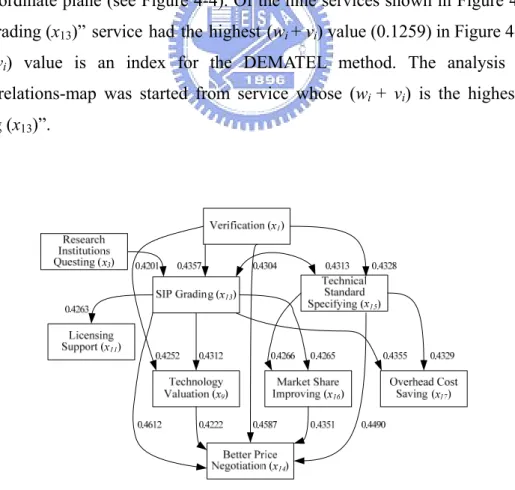
Figure 4-2 The values wi and vi of each service ……….…….47
Figure 4-3 Impact-relations-map based on the threshold value p = 0.42………….…48
Figure 4-4 Values (wi + vi ) and (wi - vi ) of the eighteen services ………..49
Figure 4-5 324 mean de-entropy values ………...53
Figure 4-6 324 mean de-entropy values of receive-nodes set with a maximum mean de-entropy value of 0.0770……….53
Figure 4-7 Hybrid MCDM Model procedures……….58
Figure 4-8 Non-additive methods for finding the synthetic effect………...59
Figure 4-9 The impact-digraph-maps of nine factors derived by DEMATEL method………64
Chapter 1 Introduction
1.1 Background
Decision-making is the study of identifying and selecting alternatives based upon the values and preferences of the decision-maker. It involves reducing uncertainty and doubt about alternatives to make the most reasonable choice, and therefore stresses information-gathering. Making a decision implies that there are alternative choices to be considered, and in such a case, the decision-maker may want to identify as many of these alternatives as possible, but only choose one. The chosen alternative should have the highest probability of success, effectiveness, or the best fit with the decision-makers goals, desires, and values. Alternatives can be identified (especially in problem evaluation) or developed (created where they did not previously exist, especially in problem planning).
The decision-makers criteria consists of the characteristics or requirements each alternative must possess. Typically, alternatives are rated on how well they possess each criterion. Every decision is made within the decision environment, including the collection of information, alternatives, values, and preferences available at the time of the decision. An ideal decision environment would include the accurate information required for every possible alternative. However, both information and alternatives are constrained, because efforts to gain information or identify alternatives are limited. The effort constraint reflects the limits of manpower, funding, and priorities. Since decisions must be made within this constrained environment, a major challenge of decision-making is to identify the adequate criteria for program planning or problem evaluation.
Information includes knowledge about the decision, the effects of its alternatives, and the probability of each alternative. While a substantial amount of information is desirable, the statement that "the more information, the better" is not true. Too much information can actually reduce the quality of a decision. The fact that decisions must be made within a limiting decision environment means many decision-makers tend to
seek more information than required to make a good decision. When too much information is sought and obtained, one or more problems can arise. One of these problems is information overload. In this state, so much information is available that decision-making ability actually declines, because the information in its entirety can no longer be managed or assessed appropriately. Therefore, the selective use of the information will occur. That is, the decision-maker will choose from among all the information available only those facts supporting a preconceived solution or position.
The concepts and techniques in the Management of Technology needed to deal with the complexity of the concepts of technological innovation generate the need for a deeper understanding of organization, systems and strategy. Accordingly, there has evolved a set of core techniques for the Management of Technology, which include: (1) Organizational analysis, (2) Systems analysis, (3) Technology forecasting and planning, (4) Innovation procedures, (5) Technical project management, (6) Marketing experimentation, and (7) Entrepreneurship [1].
Most fields in the Management of Technology experience uncertainty in the environment of decision-making. For example, identifying the emerging issues for innovation in the new product development area [2], managing technology development projects with many unknowns and great technical uncertainties [3], or determining indicators to justify research and development (R&D) programs [4]. Decision-makers usually face the uncertain environment of decision-making. To deal with complex problems, it helps to structure them using graphical representations and analyze causal influences that aid in illuminating complex issues, systems or concepts.
In the social sciences field, casual analysis techniques, such as path analysis and structural equation models, have been applied in a number of areas. These techniques help resolve questions about the possible causes by providing explanations of effects as a result of the previous causes [5-8]. In the multi-criteria decision-making (MCDM) field, the analytic hierarchy process (AHP) and the analytic network process (ANP), are decision analysis methods developed by Saaty [9-11]. These methods consider both qualitative and quantitative information and combine them by decomposing problems into systematic hierarchies to rank alternatives.
Some of the constraints or assumptions of these methodologies make them difficult to use for resolving practical problems. The assumptions of the models [12-14]
make these casual analysis techniques inappropriate to use to solve ambiguous problems when it is hard to collect the necessary data. In addition, although path diagrams can be used to represent causal flow in a system of variables, they need not imply such a causal flow; in other words, these models can convey linear relationships and test the correlation between variables, but not the direction of influence of each variable. Although AHP and ANP provide a mechanism for checking the consistency of the evaluation measures, the structure of the problem should be outlined to choosing the most appropriate method.
1.2 Research Purpose
The DEMATEL (Decision-Making Trial and Evaluation Laboratory) method, developed by the Science and Human Affairs Program of the Battelle Memorial Institute of Geneva between 1972 and 1976, was used for researching and solving complicated and intertwined problem groups [15, 16]. DEMATEL was developed with the hope that the pioneering and appropriate use of scientific research methods could improve the understanding of a specific problematique, a cluster of intertwined problems, and contribute to the identification of workable solutions by a hierarchical structure. The DEMATEL method is based upon graph theory, enabling the user to plan and solve problems visually, so that they can divide the factors into a cause and effect group, to better understand the causal relationships. The methodology can confirm interdependence among variables and develop a directed graph that reflects the interrelationships between variables.
The applicability of the DEMATEL method is widespread, ranging from analyzing world problematique decision-making to industrial planning [17-20]. The most important property of the DEMATEL method used in the MCDM field is to construct interrelationships between the criteria. After the interrelationships between criteria were determined, the result derived from the DEMATEL method could be used with the fuzzy integral to measure the super-additive effectiveness value, or for the Analytic Network Process method (ANP)[11, 21, 22], to measure dependence and feedback relationships between criteria. When the DEMATEL method is used as a part of a hybrid MCDM model, the result of the DEMATEL will influence the final decision.
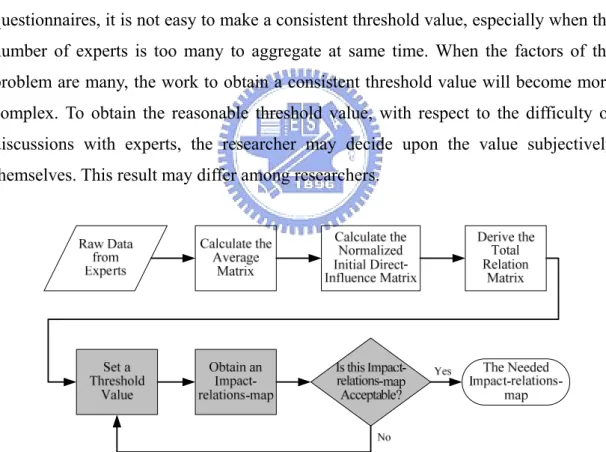
The DEMATEL method consists of four steps: Step 1: Calculate the average matrix, Step 2: Calculate the normalized initial direct-influence matrix, Step 3: Derive the total relationship matrix, and Step 4: Set a threshold value and obtain the
impact-relationship-map (In Figure 1-1, we divided step 4 into two steps).
In Step 4, an appropriate threshold value is necessary to obtain a suitable impact-relationship-map and adequate information for further analysis and decision-making. The original method for setting a threshold value was determined by discussions with experts. The researcher sets an adequate threshold value and then outlines an impact-relationship-map for discussing whether the map is suitable for the structure of the problematique. If not, the threshold value will be replaced by another value and obtain another impact-relationship-map until a consistent opinion is decided upon. Sometimes, after the researcher obtains the input data for Step 1 from questionnaires, it is not easy to make a consistent threshold value, especially when the number of experts is too many to aggregate at same time. When the factors of the problem are many, the work to obtain a consistent threshold value will become more complex. To obtain the reasonable threshold value, with respect to the difficulty of discussions with experts, the researcher may decide upon the value subjectively themselves. This result may differ among researchers.
Figure 1-1. The steps of the DEMATEL method.
Different from the traditional method, which confronts the loop from “set a threshold value” to obtain “the needed impact-relationship-map,” in this dissertation, we propose the Maximum Mean De-Entropy (MMDE) algorithm to obtain a threshold value for delineating the impact-relationship-map. This algorithm, based on the entropy approach, can be used to derive a set of dispatch-nodes, the factors which
strongly dispatch influences to others, and a set of receive-nodes, which are easily influenced by other factors. According to these two sets, a unique threshold value can be obtained for the impact-relationship-map.
1.3 Framework and Methods
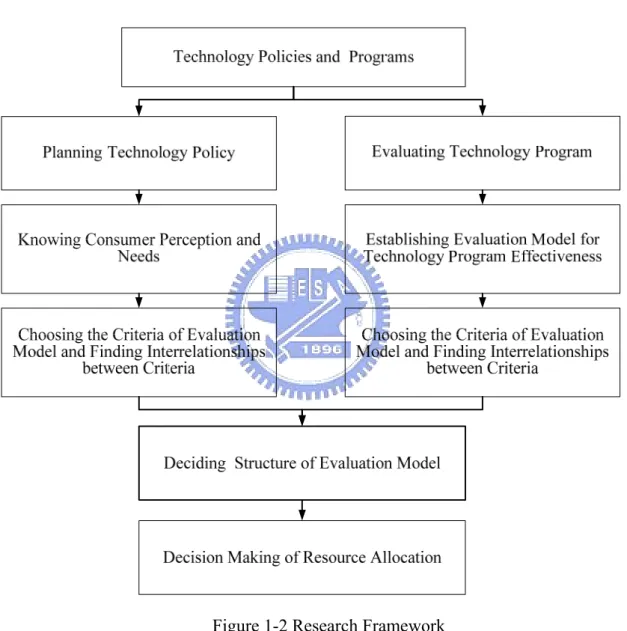
Figure 1-2 Research Framework
The framework in this dissertation is illustrated in Fig 1-2. It will be important to identify the criteria and determine their relationships for the planning or evaluation phases of the technology policy that we will be researching. For a planning problem, knowing customer’s needs and perceptions, and determining the key factors for customers is vital for a technology policy. For an evaluating problem, choosing the adequate criteria and delineating the relationships between them is necessary for a
structured and effectiveness evaluation model. The method this dissertation proposes can be use to enable the derivation of the interrelated services and the structural interrelationships between them. Using the DEMATEL method and deciding the threshold value by MMDE can effectively be used to describe the structure of a
problematique.
In the numerical example, two real cases will be evaluated: one for the application in the field of the planning problem and another for the application of a program evaluation. The first case is the Semiconductor Intellectual Property (SIP) Mall case. It is an example of a planning problem required to discover and illustrate the key services needed to attract SIP users and SIP providers to an SIP Mall. By using the proposed the MMDE algorithm to determine the threshold value, we derived the same impact-relationship-maps from traditional methods and the algorithm, although the analytical procedures used were different.
The second case is the E-Learning case, which is an example of the evaluation problem. It is analyzed to establish a new e-learning evaluation model to determine e-learning program effectiveness with consideration to intertwined relationships and synthetic utility between the criteria. In this case, we used the MMDE algorithm to determine the interrelationships between the criteria for evaluating effects in E-learning programs. We aim to demonstrate that MMDE is a suitable method that can be used to determine a threshold value in the first step, or the final step, to discuss the adequacy of the impact-relationship map.
1.4 Assumptions of Dissertation
The assumptions of this study are as follows:
(1) Before using the structural model, or algorithm, this dissertation proposed, the criteria used to plan a policy or evaluate a program must been chosen.
(2) The criteria used to plan a policy, or evaluate a program, must have at least one interrelationship. In other words, the criteria are not independent.
(3) The surveyed population is assumed to be homogenous and have a basic understanding of the questions in the questionnaires.
1.5 Outline of Dissertation
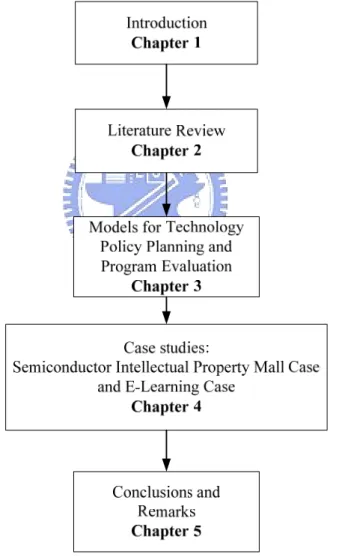
The outline of this dissertation is illustrated in Figure 1-3. The research motivation, background, purpose, framework and methods are described in Chapter 1. Chapter 2 presents the literature review where related studies of structural models for planning problems, evaluation problems, and the DEMATEL method, are reviewed. The steps of the proposed maximum mean de-entropy algorithm will be described, explained, and discussed in Chapter 3. Chapter 4 illustrates the two practical cases. We analyze the results of these two case studies and derive conclusions and recommendations in Chapter 5.
Chapter 2 Literature Review
Technology managers increasingly face problems of scale and complexity in research, development and alliance efforts in emerging technology fields. Information technology, biotechnology and nanotechnology are good examples of sectors with complex coordination problems. Choices which technology managers have to make include the selection of projects, the choice of investment alternatives, and the formation of technology licensing agreements [23, 24].
Methods used for exploring the complexity of societal problems have focused on idea management. In the domain of decision analysis, the decision-makers have to consider the viewpoints of all alternatives to solve the decision problems. With regard to the analysis of decision problems, we should consider the following research directions:
(1) For an accurate analysis, examine and grasp the characteristics of problems. Methodologies in the domain of the data approach of multi-variance statistic analysis should be studied further and developed to find a suitable method to handle such problems;
(2) Methodologies in the domain of Design/Planning should be developed to solve practical multi-aspect problems. The best alternatives can be determined found or programmed;
(3) The last direction is the evaluation of alternatives. The Evaluation/choice multi-attribute evaluation method should be adopted.
MCDM is considered to be a complex and dynamic process in which one managerial level and one engineering level can be distinguished [25]. The managerial level defines the goals and chooses the final “optimal” alternative; the multi-criteria nature of decisions is emphasized at this level, in which public officials, or “decision-makers,” have the power to accept or reject the solution proposed by the engineering level. The decision-makers, who provide the preference structure, are “offline” of the optimization procedure completed at the engineering level. In addition the preference structure is often based on political, rather than technical, criteria. In such cases, a system analyst can aid the decision-making process by conducting a comprehensive analysis and by listing the important properties of non-inferior and/or
compromising solutions.
Among the numerous approaches available for conflict management, MCDM is one of the most widely used. In this approach, practical problems are often characterized by several non-commensurable and competing (conflicting) criteria, with no solution satisfying all the criteria simultaneously. Thus, a compromising solution for problems with conflicting criteria should be determined to help decision-makers reach a final decision. The MCDM procedure applied in this dissertation consists of the following steps:
(1) Establishing system evaluation criteria (multiple) that relate system capabilities to goals;
(2) Developing (designing) alternative systems for attaining the goals (generating alternatives);
(3) Evaluating alternatives in terms of criteria (the values of the criterion functions); (4) Applying a normative multi-criteria analysis method (such as compromise
ranking) to evaluate alternatives;
(5) Accepting one alternative as ‘‘optimal’’ (preferred); and
(6) If the final solution is not accepted, then gather new information and proceed to the next iteration of multi-criteria optimization.
Steps (1) and (5) are performed at the decision (upper) level, where decision-makers have a central role. Other steps are mostly mechanical tasks. Alternatives can be generated and their feasibility can be tested using mathematical models, physical models, and/or by experiments in the existing system, or other similar systems. Generating alternatives may be a very complex process, there is no general procedure or model for it, and no mathematical procedure could replace human creativity in generating and evaluating alternatives. Constraints are seen as high-priority objectives, and must be considered and satisfied in the alternatives generating process. Assuming that each alternative is evaluated according to each criterion function, the compromised ranking method could be applied to determine a compromised solution, helping the decision-makers to reach a final decision.
The main field of MCDM includes two aspects, multi-objective design/planning and multi-criteria evaluation/choice. Based on these aspects, the systematic research in
methodologies and their applications can be put into practice.
2.1 Methods for Technology Policy Planning
Technology policy is defined as government measures or programs to promote the innovation and adoption of new technologies in key industries. Technology policies include government sponsorship of research consortia, support for research and development (R&D), trade measures, and special antitrust exemptions for joint R&D efforts among firms. Planning technology policy is rarely post-modern. Its goal is the improvement of policy and organizations based on an understanding of the underlying scientific and technological constraints and potential.
Policy planning is methodologically diverse using both qualitative and quantitative methods, including case studies, survey research, statistical analysis, and model building among others. One common methodology involves defining the problem and evaluation criteria, identifying all alternatives and evaluating them, and recommending the best policy agenda. Multi-objective decision-making (MODM) methods have became more important for solving practical planning problems.
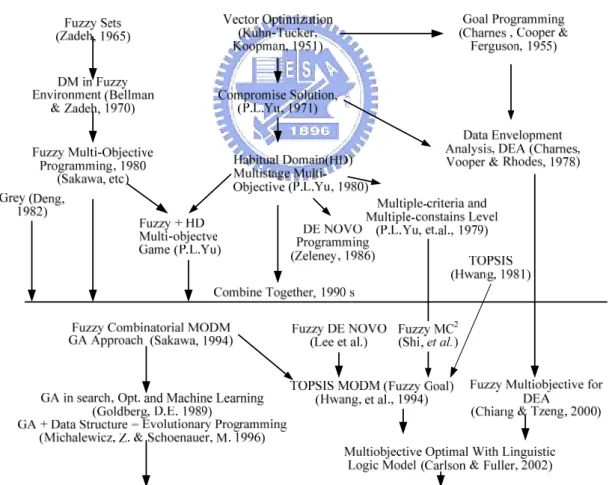
Methods for solving single objective mathematical programming problems have been studied extensively over the past 40 years. However, single objective decision-making methods reflect an earlier and simpler era. Multiple objective problems have become more important in real-world problems. The concept of Pareto optimization has appeared in classic economics, developing rapidly since Kuhn-Tucker [26] and Koopman introduced vector optimization. The related methods are shown in Figure 2-1 and can be categorized as discussed below.
The trade-off problem is that, since a final optimal solution should generally be given through mathematical programming, multiple objectives must be transformed into a weighted single objective. Therefore, a process of obtaining the trade-off information for the considered objectives should first be identified. Note that if the trade-off information is unavailable, Pareto solutions should be derived. The scaling problem, as the number of dimensions increases beyond capacity, suffers from the problem of the dimensionality curse, i.e., the computational cost increases tremendously. Yu [27] proved the theory of compromise solution, and decision-makers can use this concept to choose the best one from the set of efficient solutions [28]. For
the past few decades, a great number of theories and methodologies have been developed based on this concept, and have been applied to various real-world problems such as scheduling, production planning, portfolio selection, capital budgeting, and transportation [28-31].
Charnes, Cooper, and Ferguson introduced data envelopment analysis (DEA) to handle the problem of inconsistent goal units [32]. The DEA approach can combine multiple output and input variables to assess an enterprise’s operating performance. One of the goals of the current study is to understand which geographical area exhibits better productivity efficiency. DEA is now one of the most popular approaches for evaluating the performance of non-profit and business units. The inputs and outputs are usually measured by exact values on a ratio scale.
De Novo programming was proposed by Zeleny [33, 34] to redesign or reshape given systems in order to achieve an aspiration/desired level. The original idea was that productive resources should not be engaged individually and separately, because resources are not independent. By releasing various constraints, De Novo programming attempts to break limitations in order to achieve the aspiration/desired solution. This method makes the programmer think in an opposite direction from the traditional methods which fixed constrains.
Instead of building complex utility functions, outranking methods compare the preference relations among alternatives to acquire information on the best alternative. Although outranking methods were proposed to overcome empirical difficulties experienced with the utility function in handling practical problems, the main criticisms of outranking methods are related to the lack of axiomatic foundations. Hwang et al. introduced TOPSIS (technique for order preference by similarity to an ideal solution) method to solve the alternative ranking problems. The TOPSIS method is presented in Chen and Hwang [35], with reference to Hwang and Yoon [36]. The basic principle is that the chosen alternative should have the shortest distance from the ideal solution and the farthest distance from the negative-ideal solution. This method was applied to handle multi-objective programming problems, a process called TOPSIS MODM.
According to the properties of collected data, the fuzzy set, grey, and rough set theories can be used with the MODM models. Fuzzy set theory [37, 38] was originally proposed to deal with problems of subjective uncertainty. Subjective uncertainty results
from using linguistic variables to represent the problem or event. A linguistic variable is a variable which is expressed by verbal words or sentences in a natural or artificial language to indicate the membership functions of the expression values. The adoption of linguistic variables is now widespread, and the method is used to assess the linguistic ratings given by evaluators. Furthermore, linguistic variables are employed as a way to measure the achievement of the performance value for each criterion. Fuzzy set theory has been embodied in disciplines such as artificial intelligence, pattern recognition, and information systems in which representation issues are a major concern, forming what can be called information sciences and information engineering [39]. Sakawa [40] combined this concept with Bellman and Zadeh’s [41] idea of decision making in a fuzzy environment to develop fuzzy multi-objective programming.
Grey theory, as proposed by Deng [42], can be used to perform grey relation analysis by dealing with finite and incomplete output data[43]. The analysis is used to solve uncertainty problems with discrete data and is basically a robust but simple and straightforward multi-criteria decision-making technique. It is able to handle both incomplete and imprecise information, especially in situations where there is not enough data and the sample distribution pattern is unknown [44].
Rough set theory, originally proposed by Pawlak [45], is a mathematical tool used to deal with vagueness or uncertainty. Compared to fuzzy sets, there are some advantages to rough set theory [46]. One main advantage is that rough sets do not need any pre-assumptions or preliminary information about the data, such as the grade of membership function in fuzzy sets [47]. Rough set theory provides an effective tool for extracting knowledge from data tables and can be applied to solve MCDM problems by Pawlak and Slowinsk [48]. For MODM problems, rough set theory can induce a set of decision rules from exemplary decisions provided by decision makers. The induced decision rules play the role of a comprehensive preference model and can provide recommendations in a new decision-making environment.
A considerable amount of work for solving MODM problems has been done on various applications such as transportation investment and planning, econometric and development planning, financial planning, business planning and investment portfolio selecting, land-use planning, water resource management, public policy and environmental issues, and so on. The work is extended from simple to multilevel and multistage MODM for confronting the more complicated real-world problems.
Recently, many evolution algorithms, such as genetic algorithms [49], genetic programming [50], and evolution strategy [51], have been suggested to solve the various MODM problems.
For MODM problems, structuring complex problems through graphical representations and analyzing causal influences can illuminate complex issues, systems, or concepts. Finding adequate, central criteria to represent the effectiveness of factors/aspects and avoiding “overloading” in regards to planning are important issues. In some cases, delineating the interrelationships between the criteria is the first step in planning a policy. In this dissertation, we use the DEMATEL method to structure the problems of policy planning [52]. The related research on DEMATEL will be reviewed in Section 3.2.
Source: Gwo-Hshiung Tzeng, 2009.
2.2 Methods for Technology Program Evaluation
Program evaluation is a systematic method for collecting, analyzing, and using information to evaluate projects, policies, and programs. In the fields of technology management, program evaluation is usually used for choosing government/firm R&D projects, improving technology policies, or evaluating program effectiveness as related to government/firm investments.
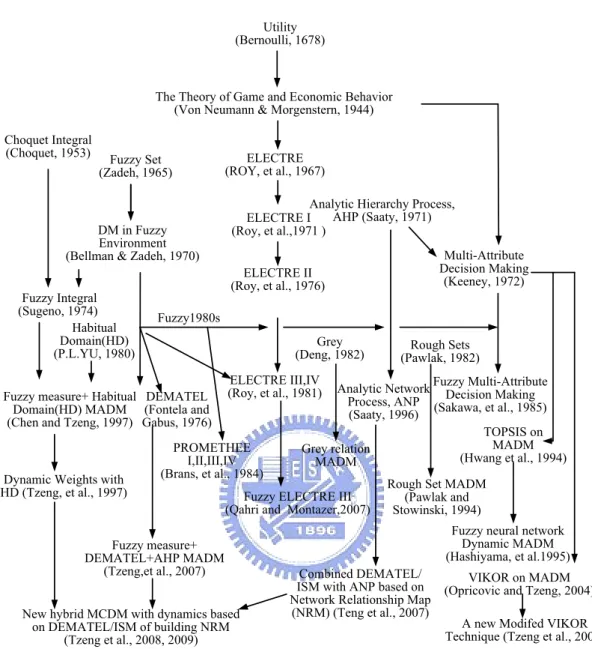
Program evaluations can involve quantitative methods of social research, qualitative methods, or both. The main methods of multi-criteria evaluation/choice problems, also known as multi-attribute decision making (MADM) problems, are shown in Figure 2-2. The concept of the evaluation system begins with the concept of utility introduced by Bernoulli, who argued that humans do not pursue the maximum benefit but maximum utility. “The Theory of Game and Economic Behavior,” written by Von Neumann and Morgen [53], is widely considered the groundbreaking text that created the interdisciplinary research field of game theory. In the game of life, the stakes are not necessarily monetary; they may be merely utilities. In discussing utilities, the authors found it advisable to replace the questionable marginal utility theory by a new theory which is more suitable to their analysis and aroused the development of utility theory. Keeney and Raiffa [54] improved the additive multi-attribute utility into a multiplicative measure, and the fuzzy integral brought up by Sugeno [55] changed the concept of additive multi-attribute utility and evaluation.
ELECTRE is a family of multi-criteria decision analysis methods. The ELECTRE method was developed to choose the best action(s) from a given set of actions, but it was soon applied to three main problems: choosing, ranking, and sorting. Roy first introduced ELECTRE in 1967. ELECTRE I was developed in 1971 (the alternatives are divided into good or bad), with ELECTRE II developed in 1976 having the ability to rank the alternatives. The development of fuzzy theory then gradually matured. ELECTRE III and IV, introduced in 1984, contain the concept of fuzzy membership.
The technique for order preference by similarity to ideal solution (known as TOPSIS) is a modification of compromise programming. This method was developed based on the concept that, using Euclidean distance, the chosen alternative should have the shortest distance from the ideal solution and the farthest distance from the negative-ideal solution [36, 56]. This method has been expanded to fuzzy TOPSIS.
Wolters and Mareschal [57] considered new types of stability analysis for additive MCDM methods, including the additive utility function and outranking methods such as PROMETHEE [58, 59].
The analytic hierarchy process (AHP) was introduced by Saaty in 1971. AHP was originally applied to uncertain decision problems with multiple criteria, and has been widely used for ranking, selection, evaluation, optimization, and prediction decisions. The analytic network process (ANP) was proposed by Saaty [11, 60] to overcome the problem of interdependence and feedback between criteria or alternatives, and is the general form of AHP which has been used in MADM to release the restriction of hierarchical structure. ANP has been applied to project selection [61, 62], product planning, strategic decision [63, 64], optimal scheduling [65], and so on. The procedures of AHP will be discussed in Section 3.4.
The VIKOR method was developed as a MCDM method to solve a discrete decision problem with noncommensurable, conflicting criteria [66]. This method focuses on ranking and selecting from a set of alternatives, and determines compromise solutions for a problem with conflicting criteria, which can help the decision-makers to reach a final decision. Here, the compromise solution is a feasible solution which is the closest to the ideal, and a compromise means an agreement established by mutual concessions.
According to the properties of collected data, the fuzzy set, grey, and rough set theories can also be used with MADM models. With successful applications in the field of automatic control, fuzzy sets have been incorporated into MADM to deal with MADM problems under the situation of subjective uncertainty. Grey relation analysis can be used to evaluate the original data directly and does not need additional interactions during the process. Since its inception, grey relation analysis has been widely used in fields concerning performance evaluation [67]. When rough set theory is applied to MADM, it is crucial to deal with preference-ordered attribute domains and decision classes [68, 69].
Multiple Attribute Decision Making (MADM)
Utility (Bernoulli, 1678)
The Theory of Game and Economic Behavior (Von Neumann & Morgenstern, 1944)
Multi-Attribute Decision Making (Keeney, 1972) TOPSIS on MADM (Hwang et al., 1994) Fuzzy Multi-Attribute Decision Making (Sakawa, et al., 1985)
Fuzzy neural network Dynamic MADM (Hashiyama, et al.1995) Analytic Hierarchy Process,
AHP (Saaty, 1971)
Rough Sets (Pawlak, 1982)
Rough Set MADM (Pawlak and Stowinski, 1994) Grey (Deng, 1982) Grey relation MADM ELECTRE (ROY, et al., 1967) ELECTRE I (Roy, et al.,1971 ) ELECTRE II (Roy, et al., 1976) ELECTRE III,IV (Roy, et al., 1981)
Dynamic Weights with HD (Tzeng, et al., 1997)
Choquet Integral
(Choquet, 1953) Fuzzy Set (Zadeh, 1965) DM in Fuzzy Environment (Bellman & Zadeh, 1970)
Fuzzy measure+ Habitual Domain(HD) MADM (Chen and Tzeng, 1997)
Habitual Domain(HD) (P.L.YU, 1980) Fuzzy1980s PROMETHEE I,II,III,IV (Brans, et al., 1984) Fuzzy Integral (Sugeno, 1974) VIKOR on MADM (Opricovic and Tzeng, 2004) Analytic Network
Process, ANP (Saaty, 1996)
Fuzzy ELECTRE III (Qahri and Montazer,2007) DEMATEL (Fontela and Gabus, 1976) Fuzzy measure+ DEMATEL+AHP MADM (Tzeng,et al., 2007)
A new Modifed VIKOR Technique (Tzeng et al., 2008) Combined DEMATEL/
ISM with ANP based on Network Relationship Map
(NRM) (Teng et al., 2007) New hybrid MCDM with dynamics based
on DEMATEL/ISM of building NRM (Tzeng et al., 2008, 2009)
Source: Gwo-Hshiung Tzeng, 2009.
Figure 2-2. Development of Multiple Attribute Decision Making
2.3 SIP Mall Policy Planning
The SIP Mall is designed to provide the services needed for SIP providers and SIP users to reduce the time, risk and cost of chip design, and to allow chip design companies to have sufficient and reliable key components for marching into the worldwide chip design market. Although the functions of the SIP Mall are helpful for customers and could accelerate the growth of the SIP market, there are still some obstacles for the development of the SIP Mall. In this section, we will explain the functions and the locus
of the SIP Mall, describe the favorable conditions for the development of the SIP Mall, and conclude with a series of issues which issues the SIP Mall confronts and seeks to resolve.
2.3.1 The functions of an SIP Mall
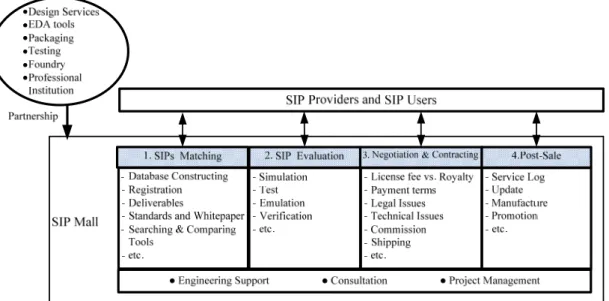
An SIP Mall is a service center to provide customers with a one stop shopping environment for chip design—from mixing-and-matching intellectual properties to manufacturing. As illustrated by the SIP trade flow diagram (see Figure 2-3), an SIP Mall provides services for each step: from SIPs matching to post-sale. The revenue of an SIP Mall comes from the trade commission, service fees as well as a share of the licensing income from co-owner SIPs. Possible benefits of an SIP Mall for customers include enhancing chip design techniques and greater competitiveness in the global market.
Two main roles that an SIP Mall plays in the SIP trade process are the role of an SIP information center and an SIP trade center. As an SIP information center, the main functions of an SIP Mall include SIP collecting, searching, and matching. Most chip design companies are like avant-garde artists that fight alone in a market without adequate information, smooth marketing channels, complete SIP verification, or quality assurance. The numerous types of products, the uncertain development situations of SIPs, and the differing business models, make finding suitable SIPs difficult.
Some SIP vendors have set up websites to provide customers with a broad range of SIP information that is needed for chip design*. However, because an SIP Mall also provides expertise in chip design and production, it is not just a searchable SIP database [70]. The websites information, such as the taxonomic schema[71], the SIP providers’ credit and the grade of an SIP, is as important as a functional description of SIPs, but is seldom provided by these companies or websites.
The second role of the SIP Mall is of an SIP trading center. As an SIP trading center, the SIP Mall focuses customer’s attention on the value added by unique technology, applications expertise, support services, and the ease of evaluating, buying and integrating the product. In addition to the services provided by other SIP vendors, an SIP Mall also provides a complete package of services for producing and marketing chips after they have been designed. This full range of services allows the SIP Mall to cover all phases of SIP trade flow. The value of an SIP product varies on customer utilization [72, 73] and the market share of the SIP product. The SIP Mall can reduce a customer’s time to market by allowing them to obtain all these services from a single source.
Beside the roles of information center and trade center, some SIP Malls also act as SIP start-up incubators. Compared with foundries or IDMs, the total assets of most chip design companies are much smaller than other players in the semiconductor industry. In the semiconductor industry, the ability of some firms to capitalize on their ability to learn more rapidly than others may contribute to strong performance in specific areas [74]. Because of the variety of production, multiplicity of technology standards, and the miniaturization of chip design companies, the SIP Mall will expand as new SIP start-ups gain momentum. An SIP Mall, especially one established by a semiconductor foundry or sponsored by a government, not only acts as an SIP vendor, but also plays the role of a venture capitalist. To strengthen customers’ attraction and the potential impact on the industry, foundries invest and help design houses by focusing on small and medium chip design companies or start-ups, via an SIP Mall. This kind of SIP Mall can build up a comprehensive portfolio through their R&D efforts and bring together the critical parts of design and manufacturing into streamlined and specially optimized
* The websites of companies such as Virtual Component Exchange (VCX) and Design and Reuse (D&R) provide SIP catalogs,
processes. When this SIP is used in an application and mass produced, the producer, who embeds this SIP in a system, will certainly be a customer of the foundry.
Until now, the main roles of an SIP Mall primarily depended on the intentions of the SIP Mall founder. For example, VCX (http://www.thevcx.com), a company initially funded by the Scottish government but became a private company in 2003, derives revenues from SIP providers and users mainly by licensing software products to allow users to search for SIPs, store information, set requirements, control access to deliverables, control and track requests for information and feed SIP data into internal catalogs. The main role that VCX plays in this instance is an SIP information center. The goals of the Taiwan government are to nurture design houses, most of which are Small to Medium sized Enterprises (SMEs), and to enhance Taiwan's semiconductor industry, from foundry to chip design. The SIP Malls sponsored by the Taiwan government focus on the role of incubator and extend the SIP trade to production as a trading center.
2.3.2 Factors Contributing to the Development of the SIP Mall
Initially, in the SIP industry, only a few companies, such as ARM and MIPS, specifically designed SIPs and licensed them for royalties or a lump sum as their major source of income. Now, the roles of the major players in the SIP industry have been extended to the whole supply chain of the semiconductor industry and successfully pioneered a networked model based on licensing markets. To better support the needs and requirements of customers, SIP companies, such as VCX and Reusable Application-Specific Intellectual Property Developers (RAPID), have created well-established technology alliances with partner companies. These alliances benefit customers by providing access to more complete solutions, accelerating design time, and improving the ease of manufacturing. These platform alliances help to unify a vision for the semiconductor industry and the technical standards required to enable the most critical component of the vision—the mixing and matching of SIPs from multiple sources. The business models of these allied companies familiarize customers with the third-party one-stop service platform the SIP Mall provides.
Some industry consortia, consisting of representatives from the systems, semiconductor, SIP, and Electronic-Design-Automation (EDA) segments of the
industry, have also worked for the development of chip design. These consortia are industry bodies focused on the definition and adoption of SIP technical standards and interfaces 1 and educational initiatives for the design community. Companies which utilize SIPs for faster entry into the market, usually license the needed SIP from these individual companies based on the information and standards specified by these consortia. Information about SIP development can be also obtained by monitoring the progress of industry consortia, standard bodies, initiatives and working groups active in SIP issues, such as Hard SIP quality, SIP portability, business models, licensing and other topics for current or future needs [75, 76]. The open standards and specifications created by these consortia also facilitate the integration of SIPs from multiple sources for the SIP Mall and its customers. Additionally, support from the government will also enforce the growth of the SIP market and the services provided by SIP Malls.
Semiconductor manufacturing has become a global enterprise. An SIP Mall would connect SIP designers and users in various locations of the global market and provide them with a chance to enforce the competition of design companies and the semiconductor industry in the country to which they belong. The growing market of the SIP industry attracts the involvement of foundries and governments to look for opportunities to purchase or license SIPs for chip design.11 Many countries, including Japan, South Korea, France, Scotland, and Taiwan, have rolled out SIP Mall programs
[19]. The experience and technological capabilities provided by the foundries, and the institutional, technological, and competitive environment of the country, will influence foreign investment decisions [77]. The smaller firms and start-ups have allied to take advantage of perceived opportunities [73] and the government policies can facilitate the initial market entry of SMEs and promote continual upgrades and creation of knowledge [78, 79]. The resources from the government will help the companies which are inclined to join the burgeoning SIP industry to bear more risk in the initial stages of development.
2.3.3. Issues Faced by SIP Malls
In the process of chip design, from clarifying the functional specifications of the requirements to verifying the functions of the chips, it is found to be difficult for designers to incorporate SIPs into a single design because companies have different SIP
design specification requirements. Chip design, especially in future SOC design, will contain several reused functional blocks from internal and external sources. SIPs with certain functionalities from different providers are more easily integrated into a product if a standard has been developed.
The Virtual Socket Interface Alliance (VSIA) is the primary organization developing standards to enhance the productivity of chip design. However, VSIA does not develop standards relating to the internal design of SIPs, functional architecture of subsystem components, fabrication processes, and techniques for EDA tools. Most SIP providers license configurable and preconfigured SIP solutions that enable their customers to design products, but lack standards for the processes of testing and verifying components. The SIP provider’s licensable technology is usually focused on a specific architecture to dominate the specific application markets. To make an SIP standard architecture, a vast ecosystem of companies must support the SIP provider, but it is difficult for SMEs and new companies entering the market to attract powerful players’ support to create a new standard architecture because the players dominate the technology and market.
SIP providers and users also meet with more difficult integration situations in the trading environment. Legal provisions[80, 81], application platform development, SIP development, and other services related to the trading procedure [82] should also be considered before SIP trading. Significant Internet-related obstacles, including SIP ownership conflicts, design support disputes that reflect interdependencies among individual design blocks, and disagreements over pricing and royalties [83] also should be considered. Currently, most contracts are negotiated, signed and completed only between the licensor and the licensee. A design that incorporates multiple SIP products may involve several SIP providers and more than one source of manufacturing. As a result, SIP users have to manage multiple providers in the supply chain, each with different business models and technical capabilities. Even though the SIP business models tend to be more complex, an intermediary, or agent such as the SIP Mall, does not play a major role in the process. The situations make customers consider outsourcing jobs to an agent, but make them doubt that the SIP Mall can resolve these problems.
foundries and governments† to search for opportunities to purchase or licence SIPs for chip design, the primary concern for an SIP Mall is how to attract SIP providers and SIP users. While SIP Mall founders must determine which services are most conducive to operating an attractive SIP Mall, these issues have rarely been studied. In this research, we interviewed chief-executive officers, senior technical personnel, and marketing managers from twenty-four SIP licensee and licensor companies to determine which services (customer’s needs) were required for establishing a successful SIP Mall. The SIP Mall is designed to provide the services needed for SIP providers and SIP users to reduce the time, risk and cost of chip design, and to allow chip design companies to have sufficient and reliable key components for marching into the worldwide chip design market. Taiwan is the world’s largest semiconductor foundry and second largest fabless IC design provider. To maintain the leading position, competitiveness and the value added of Taiwan’s foundry, fabless, and thus the IC industry in the SOC era, the Taiwanese government stepped in. The Si-Soft Project [84], launched by the Taiwan government in 2000, was aimed at enhancing Taiwan’s capabilities in (1) innovative SOC product designs; (2) silicon SIP development; (3) EDA flow integration; (4) SIP Malls; and (5) SOC design services. Even though the Taiwanese government has exerted considerable effort into developing the SIP and SIP Mall industries over years, Taiwanese SIP Malls are still in their exploratory phase. SIP sources are limited and few SIP transactions are made. As can be seen, users and providers in the SIP industry still experience the difficulties of this maturation. Although the functions of the SIP Mall are helpful for customers and could accelerate the growth of the SIP market, there are still some obstacles for the development of the SIP Mall. An important issue for an SIP Mall is how to attract SIP providers and SIP users to trade it.
†
Exchange (VCX) Software Ltd. was established and funded by the Scottish government, Unichip, and Faraday Technology and were established by the TSMC (Taiwan Semiconductor Manufacturing Co. Ltd.) and UMC (United Microelectronics Corporation) foundries. The China Software and Integrated Circuit Public Service Platform (CSIP) were set up by the People's Republic of China government (http://www.csip.cn). Chartered, a Singapore foundry, collaborates with the VCX to provide SIP licensing business.
2.4 E-Learning Programs Evaluation
2.4.1 Introduction
Internet has significantly impacted the establishment of Internet-based education, or e-learning. Internet technology evolution and e-business has affected all industrial and commercial activity and accelerated e-learning industry growth. It has also fostered the collaboration of education and Internet technology by increasing the volume and speed of information transfer and simplifying knowledge management and exchange tasks. E-learning could become an alternative way to deliver on-the-job training for many companies, saving money, employee transportation time, and other expenditures. An e-learning platform is an emerging tool for corporate training, with many companies developing their own e-learning courses for employee on-the-job training. Employees can acquire competences and problem solving abilities via Internet learning for benefits among business enterprises, employees, and societies while at work.
Although e-learning has been developing for several years, evaluating e-learning effectiveness is critical as to whether companies will adopt e-learning systems. A considerable number of studies have been conducted emphasizing the factors to be considered for effectiveness evaluation. Several evaluation models are considered with specific aspects. The criteria used for e-learning effectiveness evaluation are numerous and influence one another.
The evaluation models however, are deficient and do not have an evaluation guideline. Effectiveness evaluation criteria must integrate learning theories, relative web site design, course design, and learning satisfaction theories to form an integrated evaluation model [6, 85-87]. Since e-learning can be evaluated according to different aspects and criteria, the MCDM approach is suitable for e-learning evaluation.
E-learning combines education functions into electronic form and provides instruction courses via information technology and Internet in e-Era. The most popular definition of e-learning as defined by the American Society for Training and Development (ASTD) is a wide set of applications and processes, such as Web-based learning, computer-based learning, virtual classrooms, and digital collaboration. E-learning is not an innovative education idea, since Computer-Aided Training (CAT),
Computer-Based Training (CBT), and distance learning have been used as elements of e-learning for more than ten years. Research shows that students can be effective learners over the Web, and learn as much, if not more, than in traditional courses.
E-learning is currently a burgeoning educational and training tool because of its cost saving advantages, institution reusability, and learner flexibility. World governments emphasize e-learning for social and public education, and want to enlarge it as a branch of education. The European Union in 2000, proposed the e-Europe project, promoting an information society for all. Moreover, the Japanese government has proposed the e-Japan project, making e-learning one of seven main application development items. E-learning has also been used with university and enterprise education. Enterprises can introduce e-learning courses and systems into the firm, which can then be used by the human resources or research development department to do on-the-job training. When companies induce e-learning courses into their organization, they can save money otherwise used for guest lecturers, and employees can learn on demand.
Each e-learning procedure, from course design to learner response or behaviour measurement, will affect course performance. According to previous research, instructional system design process models are process-oriented rather than product-oriented and include built-in evaluation and revision systems [88]. Systematic instructional system designs follow five learner need stages: (1) analysis, (2) design, (3) development, (4) implementation, and (5) evaluation, or the ADDIE acronym model [89]. The ADDIE is usually used in mentoring as an intervention that can be linked to three primary functions: (1) organization, (2) training and development, and (3) career development [90].
The basic reason for e-learning evaluation is to find out the effectiveness, efficiency, or appropriateness of a particular course of action. E-learning effectiveness evaluation intends to highlight good or bad practice, detect error and correct mistakes, assess risk, enable optimum investment to be achieved, and allow individuals and organizations to learn [91]. Evaluation can be most effective when it informs future decisions [92]and is better used to understand events and processes for future actions, whereas accountability looks back and properly assigns praise or blame.
find the dimensions or factors to be considered in evaluation effectiveness, however, with a specific perspective. Kirkpatrick proposed four levels of training evaluation criteria: (1) reactions, (2) learning, (3) behaviour, and (4) results [93, 94]. Garavaglia [95] proposed five dimensions to evaluate e-learner change: (1) supervisory report, (2) on- the-job peer surveys, (3) action plan reports, (4) observation, and (5) self-report. Among these five methods, the observation method can avoid the possible bias a supervisor may have when reporting on a subordinate. The self-report method involves either interviews or surveys distributed or conducted two to three months after the learning session. Phillips [96] formed a logical framework to view ROI (Return on Investment) both from a human performance and business performance perspective. Urdan [97] proposed four measure indicators, learner focused measures, performance focused measures, culture focused measures, and cost-return measures, to evaluate corporate e-learning effectiveness. Since web-based instruction has become the most engaging type for learning, four factors that affect the e-learning environment should also be identified: (1) efficacy studies, (2) technological advances, (3) pressures of competition and cost containment, and (4) professional responses to market influences [98].
2.4.2 Methods for Evaluating E-Learning Course Effectiveness
Formative evaluation and summative evaluation are two common methods for evaluating e-learning course effectiveness in recent decades. Formative evaluation is used at the onset of new instructional program implementation to assess the needs and learning goals of an organization, or for program evaluation following training to revise existing programs. Several familiar formative evaluation models prescribe a four-part evaluation procedure employing expert reviews, one-to-one evaluations, small group evaluation, and field trials [99]. Formative evaluation is typically categorized according to different processes such as design-based, expert-based, and learner-based for assessment, although.
Summative evaluation, one of the most popular methods focused on outcomes and used in classroom education. For example, the CIRO (Contents/Contexts, Inputs, Reactions and Outcomes) model which measures learning/training effectiveness by CIRO elements, both before and after training, is currently widely used in business
[100]. The strength of the CIRO model is consideration of objectives (contexts) and training equipment (inputs). The main emphasis of CIRO is measuring managerial training program effectiveness, but it does not indicate how measurement takes place. Adopting measures during training provides the training provider with important information regarding the current training situation, leading to improvements [101]. Summative evaluation models lack consideration of other factors, such as individual characteristics, e-learning interface design, instructional system design, and course design, which may influence e-learning effectiveness.
Most evaluation models however, do not measure e-learning effectiveness from an overall perspective and ignore the interrelation among criteria. Most evaluation models concentrate on finding factors, aspects, or casual relationships between them. Quantitative study models mainly use traditional statistic methods or linear models (e.g. ANOVA, factor analysis and structural equation model) to find learner satisfaction or dissatisfaction via questionnaires or facial communications [102-106]. Typically, e-learning program effectiveness is evaluated by multiple intertwined and inter-affected criteria, and the perceptions of utility for learners are not monotonic. Establishing a model to evaluate all available criteria and to determine central criteria, learner utility perception about these criteria, and the future improvement direction for the programs is necessary.
Chapter 3 Models for Technology Policy Planning and
Programs Evaluation
This chapter presents the models, which used for policy planning and policy evaluating, include factor analysis, DEMATEL method, fuzzy measure and fuzzy integral, and the analytical hierarchy procedure. These models are used to explore the structure of criteria for planning problem and to establish a hybrid model for policy evaluation. Five methods are illustrated from Section 3.1 to 3.4, respectively. Then, the MMDE algorithm is described in Section 3.5.
3.1 The Factor Analysis
Factor analysis is a dimension reduction method of multivariate statistics, which explores the latent variables from manifest variables. Two methods for factor analysis are generally in use, principal component analysis, and the maximum likelihood method. The main procedure of principal component analysis can be described in the following steps when applying factor analysis:
(1) Find the correlation matrix ( )R or variance-covariance matrix for the objects to be
assessed;
(2) Find the eigenvalues ( ,λk k=1, 2,..., )m and eigenvectors
1
(βk =[βk,...,βik,...,βpk]) for assessing the factor loading (aik = λ βk ik)and the
number of factors ( )m ;
(3) Consider the eigenvalue ordering (λ1> >... λk > >... λ λm; m > to decide the 1)
number of common factors, and pick the number of common factors to be extracted by a predetermined criterion;
(4) According to Kaiser [107], use varimax criteria to find the rotated factor loading matrix, which provides additional insights for the rotation of factor-axis;
When a large set of variables are factored, the method first extracts the combinations of variables, explaining the greatest amount of variance, and then proceeds to combinations that account for progressively smaller amounts of variance. Two kinds of criteria are used for selecting the number of factors: latent root criterion and percentage of variance criterion. The former criterion is that any individual factor should account for the variance (Var Y( )k = ) of at least a single variable if it is to be λk retained for interpretation. In this criterion only the factors having eigenvalues greater than 1 (i.e. λk ≥ 1, are considered significant. The latter criterion is based on achieving a specified cumulative percentage of total variance extracted by successive factors. Its purpose is to ensure the extracted factors can explain at least a specified amount of variance. Practically, to be satisfactory the total amount of variance explained by factors should be at least ninety-five per cent in the natural sciences, and sixty per cent in the social sciences. However, no absolute threshold has been adopted for all applications [108].
1, 2,..., )
k = m
3.2 The DEMATEL Method
The DEMATEL method is based on graph theory, enabling us to plan and solve problems visually, so that we may divide the relevant factors into cause and effect groups in order to better understand causal relationships. The methodology can confirm interdependence among variables and aid in the development of a directed graph to reflect the interrelationships between variables.
The end product of the DEMATEL process—the impact-relations map—is a visual representation of the mind by which the respondent organizes his or her own action in the world. This organizational process must occur for the respondent to keep internally coherent and to reach his or her personal goals. The steps of the DEMATEL method [20] are described as follows:
(1) Find the average matrix
Suppose there are h experts available to solve a complex problem and there are n factors to be considered. The scores given by each expert give us a n × n non-negative answer matrix Xk, with 1 ≤ k ≤ h. Thus X1, X2,…, Xh are the answer matrices for each
of the h experts, and each element of Xk is an integer denoted by k ij
x . The diagonal
elements of each answer matrix Xk are all set to zero. We can then compute the n × n average matrix A by averaging the h experts’ score matrices. The (i, j) element of matrix A is denoted by aij , 1 1 h k ij ij k a h = =
∑
x A . (3-1)In application, respondents were asked to indicate the direct influence that they believe each factor exerts on each of the others according to an integer scale ranging from 0 to 4. A high score from a respondent indicates a belief that greater improvement in i is required to improve j. From any group of direct matrices of respondents, it is possible to derive an average matrix A.
(2) Calculate the normalized initial direct-relation matrix
We then create a matrix D by using a simple matrix operation on A. Suppose we create matrix D and D= ⋅s where
n n 1 1 1 1
1
1
,
max
ijmax
ij i n j n j is Min
a
≤ ≤ = ≤ ≤ =⎡
⎤
⎢
⎥
=
⎢
⎢
⎥
⎣
∑
∑
a
⎦
⎥
i j d i j d . (3-2)Matrix D is called the normalized initial direct-relation matrix. The (i, j) element
dij denotes the direct influence from factor x i to factor xj. Suppose di• denotes the row
sum of the i-th row of matrix D.
1 n i j d• = =
∑
(3-3)The di• shows the sum of influence directly exerted from factor xi to the other
factors. Suppose d•j denotes the column sum of the j-th column of matrix D.
1 n j i d• = =
∑
(3-4)Then d•j shows the sum of influence that factor xj received from the other factors.