Proceedings of the 20th Annual Znternational Conference of the ZEEE Engineering in Medicine and Biology Society, Vol. 20, No 6,1998
POWER DISTRIBUTION ANALYSIS
OF
CUTANEOUS
ELECTROGASTROGRAPHY USING DISCRETE WAVELET TRANSFORM
Han-Chang Wu', Student Member, Kuang-Ching Wang', Student Member,
Ya-Wen Chang', Full-Young Chang2,
M.D., Shuenn-Tsong Young3, and Te-Son Kuo'
Department of Electrical Engineering, National Taiwan University
*Division
of
Gastroenterology, Veterans General Hospital-Taipei
31nstitute
of
Biomedical Engineering, National Yang-Ming University
E-mail:wuman@tptsl .seed.net.tw
1
Abstract
The electrogastrography (EGG) is considered more and more important due to its non-invasive measurement. Some parameters have been used to assess the EGG signals and the Short Term Fourier Transform (STFT) was the most commonly used tool to evaluate these parameters. However, FFT is used to analyze stationary signals, while non-stationary signals such as EGG may be distorted. A new method based on discrete wavelet transform (DWT) was achieved to analyze the power distribution of the EGG signals.
1. Introduction
Gastric activities recorded cutaneously on upper abdomen are called electrogastrography (EGG)[ 1,2]. The EGG signal is more and more attractive because of its non-invasive characteristics. Many efforts were expended on finding the relationship between the gastric signals and activities of the stomach. Unlike other physiological signals, the EGG had few clinical applications. The major problems of the EGG signal were its low signal-to-noise ratio (SNR) and lack of standard parameters. The parameters often used to evaluate the EGG signal were frequency, amplitude, phase lag and waveform, while frequency was the only parameter that could be quantitatively analyzed[3]. Running spectral analysis (RSA) using Short Term Fourier Transform (STFT) is commonly used to extract information of frequency dynamics recently. Although STFT is simple to implement, it still has some problems such as averaging effect and trade-off between time and frequency resolution. To avoid these effects, Chen proposed auto-regressive moving average modeling (ARMA) adaptive spectral analysis[4]. Although ARMA method was effective in frequency analysis, amplitude of the EGG signal was distorted. A power distribution method based on discrete wavelet transform was proposed in this study and more meaningful parameters were achieved by this method.
2. Methods Experiment:
Three surface electrodes were placed on the fundic, stomach body, and antral positions for 30 minutes recordings in both
fasting and postprandial states. 300Kcal food was taken after the first 30 minutes. We used the EGG recording monitor designed in our laboratory. We used a 12-bit resolution
Sampling Rate
analog-to-digital converter (ADC) with 1Hz sampling rate. The EGG signals were acquired and stored in the PC. The data was then analyzed with MATLABTM software.
Power Distribution Analysis[ 5,6] :
The cubic spline wavelet was applied to the decomposition using the Mallat algorithm. The low pass filter
H ( # )
and high pass filterG(
w)
were:iw # -
~ ( w )
=e
2COS-)^
2
iw 9w
~ ( 0 ) =4el(sin-)
2
The wavelet transform of the signal f(n) at scale 2'was equivalent to passing it through the digital filters. It can be considered as an equivalent filter Q j
(w
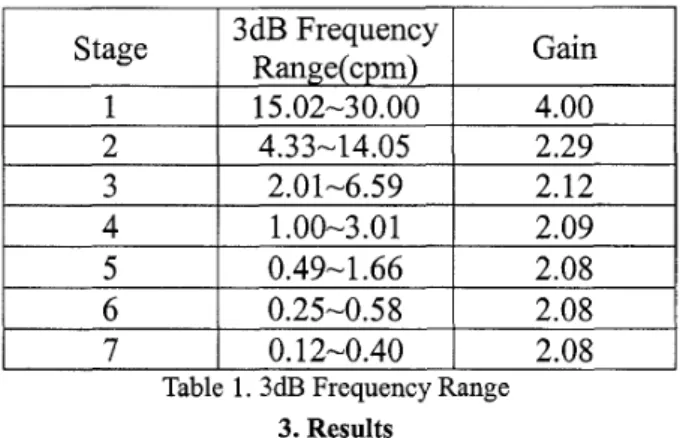
) :The frequency response of each stage is shown in fig.1, and the 3dB frequency range is illustrated in table 1.
3dB
Frequency
Range(cpm)
Stage
The number of points and gain of each stage were different, so we used the following equation to figure out the power ECj) of each stage and to normalize the power:
Gain
where Nj was the number of points at stage j, Gj was the gain coefficient of filter Q.
2
3
4.33-14.05
2.29
2.0
1-6.59
2.12
1
I
15.02-30.00
I
4.00
4
5
1.00-3
.O
1
2.09
0.49-1.66
2.08
I
6
I
0.25-0.58
I
2.08
I
7
I
0.12-0.40
1
2.08
Table 1.3dB Frequency Range 3. Results
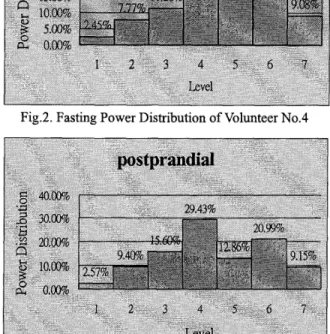
The power distribution diagrams of the EGG signal of a normal male volunteer are shown in fig.2 and fig.3, in fasting and postprandial states respectively. Because 2.4-3.6 cpm is mostly considered as a normal EGG slow frequency, compared to table 1, we selected stage 4 as the normal stage. Besides, stage 5 could be considered as bradygastria condition, and stage 2 as well as stage 3 could be considered as tachygastria condition. Both fig.2 and fig.3 were in the normal stage. We chose the percentage power of each stage instead of absolute power. The relative ratios of fasting and postprandial periods are illustrated in table 2. Both absolute and percentage power were greater than 1. Table 3 was achieved by another volunteer and we could see that although absolute power was smaller than 1, power percentage still presented greater than 1.
4. Discussion
In this study, the power distribution was segmented into 7 frequency bands, and some bands could be mapped to the normal or abnormal frequency conditions as described in the results. For a normal volunteer, this method could clearly identify the normal condition with the largest percentage of stage 4 in fasting or postprandial period. The increase of the EGG signal power could be explained as more gastric activities recorded, but it can be easily affected by other reasons, say the positions of electrodes. Therefore we use the percentage of power of each stage to present the increase of gastric activities. As shown in table 3, the absolute power decreased after the meal; however, the percentage of the normal stage still increased. We believe that the percentage of
power would be more suitable to compare the relative gastric activities between testing meals.
5. Conclusion
The EGG signals are hard to evaluate in time domain waveform, so frequency domain parameters are utilized to assess the information of the EGG signals. However, it is intrinsically noisy, and conventional methods can only access relative maximum of power and frequency in every time- window. It may give out incorrect results under some situations. In this study, we presented a new method of evaluating the noisy EGG signals with discrete wavelet transform, and the parameters were more meaninghl and easier to be understood.
Acknowledgement
Special thanks to Full-Young Chang, M.D., Chief of GI Division, VGH- Taipei, for his support of EGG experiments.
Reference
1. Alvarez WC, “The electrogastrogram and what is shows”, JAMA 1922,78, pp. 1116-1119.
2. Chen J, McCallum RW, “Electrogastrography: Measurement, analysis and prospective applications”, Medical & Biological Engineering & Computing, 1991,29,pp 339-50.
3. Mintchev MP, Bowes KL, “Extracting quantitative information from digital electrogastrograms”, Medical &
Biological Engineering & Computing, 1996,34, pp. 244-8 4. Chen J, Vandewalle J, Sansen W, et al, “Adaptive spectral analysis of cutaneous electrogastric signals using autoregressive moving average modelling”, Medical &
Biological Engineering & Computing, 1990,28, pp. 53 1-6.
5. C. Li, C. Zheng, C. Tai, “Detection of ECG characteristic points using wavelet transforms”, IEEE Trans. on Biomedical Engineering, 1995,42, pp. 21-28.
6. Cuiwei Li, Vladimir Shusterman, et al.Wavelet decomposition of nonstationary heart rate variability. Proceedings- 19” Intemational conference, IEEE- BMES, pp.
85-88, 1997.
Fig.2. Fasting Power Distribution of Volunteer No.4
Power
Percentage
Fig.3. Postprandial Power Distribution of Volunteer No.4
Fasting
Postprandial
Ratio
1282.6
3410.6
2.66
27.48%
29.43%
1.06
Power
1022.5
755.5
0.74
,Percentage
21.25%
29.38%
1.38
Table 2. Relative Ratio of Volunteer No.4
1
Fasting IPostprandial( Ratio
Table 3. Relative Ratio of Volunteer No.6