A DWT-based Watermarking Scheme with Multi-bands’ Detection
25
0
0
全文
(2) 1. Introduction. Invisible robust watermarks are most valuable in various watermark applications [1]. It is a mark inserted into an image without creating visible artifacts on normal inspection. It must be very resistant to destruction under any image processing involving pixel value manipulation. It is useful in verifying ownership of an image suspected of misappropriation.. There were many researches in this area. Some of them used the methods in spatial domain [2, 3, 4]. Some of the others used the methods in frequency domain. In frequency domain, two major transforms have been frequency used. One is DCT [5, 6, 7], the other is used Wavelet [8, 9, 10]. Due to the standard of JPEG2000 is designed in wavelet domain [11], there are more and more researches on watermarking using wavelet coefficients. However, most of the previous researches on wavelet watermarking embedded watermarks by directly modifying the wavelet coefficients without concerning the capacity of the coefficient being changed. They did not concern about how the attacks influence the coefficients either.. In this paper, the capacity of wavelet coefficient that could be changed was computed by the proposed watermarking scheme according to the observation on wavelet coefficients. The behavior of different kinds of attacks is analyzed as well.. 2.
(3) This paper is organized as follows. Section 2 addresses an observation on wavelet coefficients. The proposed wavelet-based watermarking scheme is introduced in section 3. Section 4 demonstrates and analyzes the simulation results in different attacking conditions. Finally, the conclusion and future works are given in section 5.. 2. Observation on DWT coefficients. In general, the Haar DWT is applied in most of the previous researches. It has the advantage of easy implementing and lossless inverse DWT. Some details should be concerned when modifying the DWT coefficients. Due to the fact that the previous DWT-based watermarking techniques did not pay attention to the influence of modification on DWT coefficients when applying DWT on watermarking. We make observations when implementing DWT on digital images. The observation results include the range of DWT coefficients within each subband, the base amount of modification for coefficients within each subband, and the modifiable capacity of coefficients within each subband. All of them are described in the following paragraphs. The proposed watermarking scheme is designed partly based on this observation.. 2.1 The Range of Haar DWT Coefficients. Due to the range of pixel value is from 0 to 255, the ranges of 3 level’s DWT coefficients are {high band of level1: 2*255~-2*255, level2: 8*255~-8*255, level3:. 3.
(4) 32*255~-32*255, low band: 64*255~0}. The modification should not make the coefficients out of range. Otherwise, it will change the pixel value a lot after IDWT, for example, 0 becomes 255.. 2.2 Base Amount of Modification. Here we make observations on a group of coefficients with size 2*2. According to observation, in order not to influence the other coefficients of the same group, the amount of modification for one single coefficient is at least 4. Besides, the sum of DWT coefficients within the same group is multiple of 4.. It is an important point that when we modify a DWT coefficient, it should not be changed after the processes of IDWT and second time’s DWT. In the proposed watermarking scheme, the coefficients in the same group are modified simultaneously. Therefore it must be careful not to make the modifications influence each other.. Due to our observations mentioned above, we conclude that: for one level DWT, the base amount of modification of each coefficient is 4. No matter what magnitude the amount of modification is, it must be multiple of 4.. We continuously observe the 2 level DWT and 3 level DWT, it is concluded that: the base amounts of each level’s coefficients of 3 level’s DWT are {level1: 4, level2: 16, level3: 64}. No matter what magnitude the amounts of modification are, they must 4.
(5) be multiples of those base amounts of modification.. 2.3 Modifiable Capacity of Coefficients Observation: DWT Coeficients LL. HL. LL. HL. 0. 4. 20. 4. 8. 16. 8. 16. LH. HH LH. LL. 8. -3. -5. 1. Adjust. HL 992 4. 16. LH. DWT. 7. LL. 1020 4. HH. IDWT. HL. 8. 16. HH LH. IDWT. HH DWT. 12. 2. 262 252. 255 245. 0. 6. 250 256 Adjust. 243 249. out of range. out of range Spatial Domain Pixel Values. As mentioned in section 2.1, modifications of coefficients should not make the original pixel values out of range. Let’s make an observation on a group of 1 level DWT coefficients with size 2*2. It is found that if we want to maintain the high frequency coefficients as original, there exist a lower bound and an upper bound for low frequency coefficient. This is the capacity of coefficients that they could be modified. The computations of lower bound and upper bound of each subband’s coefficients are in the following:. Given a group of first level’s low band coefficients, the ranges of coefficients are {(L1a, U1a), (L1b, U1b), (L1c, U1c), (L1d, U1d)}. 5.
(6) DWT a. b. c. d. LH1. LL2 HL2. HL1. HL1. LH2HH2 HH1. LH1. HH1. For LL2: Lower Bound : LL2 − 4 × min( a − L1a , b − L1b , c − L1c , d − L1d ) Upper Bound : LL2 + 4 × min( U1a − a, U1b − b,U1c − c ,U1d − d ). (2.1). For LH2, HL2, HH2:. Lower Bound : if {LH 2, HL 2, HH 2} > 0 HL 2 − 4 × min( a − L1a , c − L1c , U1b − b,U1d − d , HL 2 ) LH 2 − 4 × min( a − L1a , b − L1b ,U1c − c ,U1d − d , LH 2 ) HH 2 − 4 × min( a − L1a , d − L1d , U1b − b,U1c − c, HH 2 ) else if {LH 2, HL 2, HH 2} < 0 HL 2 − 4 × min( U1a − a, U1c − c, b − L1b , d − L1d , HL 2 ) LH 2 − 4 × min( U1a − a, U1b − b, c − L1c , d − L1d , LH 2 ). (2.2). HH 2 − 4 × min( U1a − a,U1d − d , b − L1b , c − L1c , HH 2 ) Upper Bound : LH 2 + 4 × min( U1a − a, a − L1a ,U1b − b, b − L1b ,U1c − c, c − L1c , U1d − d , d − L1d ) HL 2 + 4 × min( U1a − a, a − L1a ,U1b − b, b − L1b ,U1c − c, c − L1c , U1d − d , d − L1d ) HH 2 + 4 × min( U1a − a, a − L1a ,U1b − b, b − L1b ,U1c − c, c − L1c , U1d − d , d − L1d ). The results of computations above is for the coefficients at level 2, we could infer the upper bounds and the lower bounds of coefficients at other levels from those results.. 6.
(7) It is found that for low band coefficients, the modifiable capacity of theirs is weaker at locations of edges. On the other hand, for high band coefficients, the modifiable capacity of theirs is weaker at locations of edges and locations where pixel va lues of original image near 0 or 255. For present structure of invisible robust watermarking, the watermark is embedded in the location where the modifiable capacity of coefficients at that location is weaker. Therefore, it is an obvious tradeoff between visual quality and the amount of watermark embedded. Like previous researches, in the proposed watermarking scheme, we embed watermark in the locations of edges in order not to be noticed by eyes. However the amount of modification is slightly so as to have a good quality of watermarked image.. 3. The Proposed Watermarking Scheme. In this section, we will describe the proposed watermarking scheme. The watermark used here is a visually recognizable binary image rather than a randomly gene rated sequence of bits. Thus, human eyes can easily identify the watermark.. The proposed scheme first randomly permutes the watermarks in order to prevent from tampering and unauthorized access. Then, it selects wavelet coefficients after DWT transformation based on the energies’ sum of coefficients within each high frequency subband. After the embedding positions are found, the proposed scheme. 7.
(8) adjusts those coefficients according to the capacity that they could be changed.. Due to previous observation on wavelet coefficients, the trend of all coefficients’ sum within each subband is more stable than a single coefficient in most conditions. Although the proposed scheme modifies all coefficients within each subband simultaneously, the amount of modification to each single coefficient is relatively small tha n other techniques. In fact, the visual quality of the watermarked image is good enough compared with original image.. In the watermark extraction step, the proposed scheme detects watermarks from each subband and trends of different levels, which result in a watermark set. The idea of the proposed scheme is that: There are many kinds of attacks on digital images, if it is impossible to predict how those attacks influence the image, why not we detect the watermark from the locations that the watermark may survive? The key steps of the proposed scheme are described in next sub-sections. 3.1 Watermark Embedding Algorithm The watermark embedding steps are similar to other techniques. It uses DWT coefficients and embeds watermark to the positions that are not easily noticed by eye. However the selection of embedding position and the method of watermark insertion are different from other techniques. The summary of steps in the proposed embedding. 8.
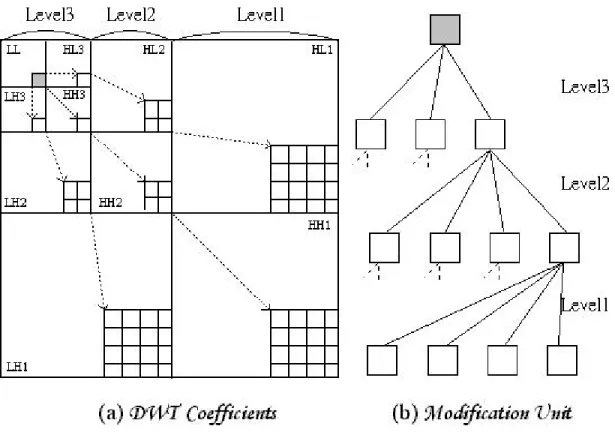
(9) approach are listed in the following:. STEP1. Pseudo-random permutation of the watermark.. STEP2. Discrete Wavelet Transform.. STEP3. Selection of modification units.. STEP4. Watermark insertion.. STEP5. Inverse DWT transform.. The key detail steps are described as follows.. Discrete Wavelet Transform. The original image is first decomposed by 3 levels Haar discrete wavelet transformation (DWT). The wavelet framework consists of a three- level decomposition as illustrated in Fig. 3.1 (a). Note that, the block at upper left corner corresponds to the low frequency band, and the others are high frequency bands in different directions and different levels. After transformation, a subband set {LL, LH3, HL3, HH3, LH2, HL2, HH2, LH1, HL1, HH1}is formed. In addition, the capacity of each coefficient that could be modified also needs to be computed in DWT domain due to previous discussion in section 2. The watermark detection is processed on those elements of the subband set. It is described later in watermark extracting section. A single modifica-. 9.
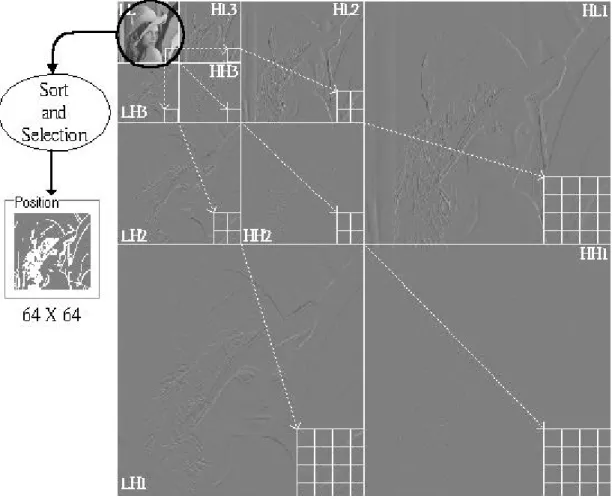
(10) tion unit is defined as Fig. 3.1 (b). The amount of modification units equals to the size of low subband. Not all units have to be modified. If one unit needs to be modified, all coefficients that belong to this unit within each high subband are simultaneously modified to be smaller or larger than original. The selection of those units that have to be modified is described in next step.. Figure 3.1 DWT Coefficients and the Modification Unit. Selection of modification units. In this step, the modification units are sorted at first. The sorting process is based on the sum of all absolute va lues of high frequency coefficients that belong to one modification unit. If the modification unit is stronger (larger), it has more potential for embedding watermarks without influencing visual quality. After the sorting process, 10.
(11) the modification units that have to be changed are selected. The amount of modification unit that have to be changed is approximately limited to 1/4 of the size for low band in general case. Therefore the size of watermark equals to this amount. Fig. 3.2 illustrates an example of this step. The white points in position image are the modification units that have to be modified.. Figure 3.2 Selection of Modification Units. Watermark insertion. The proposed scheme modifies the trend of the modification units instead of single one coefficient. According to the bits of watermark stream, the coefficients within 11.
(12) one modification unit are simultaneously modified to be smaller or larger than original. For a single coefficient I within a modification unit, the pseudo code of modification on I is shown as below: If watermark bit = 1 { If I − L > 0 { 2 * B I M = 1 * B I I − L I + M I* = I − M. , if I − L > 2 * BI , if I − L > 1 * BI , otherwise , if I > 0. (3.1). , if I < 0. } } else If watermark bit = 0 { If U − I > 0 { 2 * B I M = 1 * B I U − I . , if U − I > 2 * BI , if U − I > 1* B I. I − M I* = I + M. , if I > 0. , otherwise , if I < 0. } }. I* is the modified coefficient of the original I. BI is the base amount of modification of I. L is the lower bound that |I| could be decreased. U is the upper bound that |I| could be increased. M is the final modification amount of I. As the pseudo code shows, not every coefficient that has to be adjusted is modified. In order not to influence the. 12.
(13) visual quality much, there will not have any change to the coefficient that has no capacity to be modified. The modification amount is at least 2 times of base amount of modification for I due to the same reason.. 3.2 Watermark Extracting Algorithm. To verify the existence of watermark in an image, the original image is required. Both original image and tested image are transformed to DWT coefficients at first. The watermark embedding position is computed from original image. A detection unit relates to a modification unit at the same position. Due to the idea of the proposed scheme described at first paragraph of this chapter, the watermark is “embedded” in all subbands to tolerate different kinds of attacks. Therefore, the extraction step is to detect the trends of subbands’ locations. Besides, different methods of detection would make different extraction results. There are two different definitions of trend detection proposed in this paper. The definition of trend detection is flexible, which means there still have capacity to be improved for the proposed scheme. The summary of extracting steps is listed as follows:. STEP1. The original and watermarked images are DWT transformed.. STEP2. The watermark embedding positions are computed from the DWT coefficients of original image.. 13.
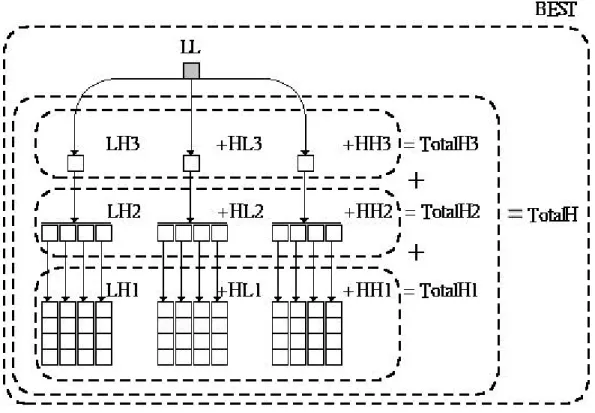
(14) STEP3. Extract the set of watermark bits from the different locations by different definitions.. STEP4. Reverse the pseudo-random permutation of the watermark bits.. The key detail steps are described as follows.. Watermark set A watermark set is defined as Fig. 3.3.. Figure 3.3 The Detection Unit and The Structure of Watermark Set. {LL, LH3, HL3, HH3, LH2, HL2, HH2, LH1, HL1, HH1} are the trends of each single sub band. {Total H3, Total H2, Total H1} are the trends of each level of high frequency subbands. Total H is the trend of high frequency subbands. BEST is the best of all elements in a watermark set. 14.
(15) The trends of each element of a watermark set are computed by comparing the sums of the coefficients that relate to the element of the watermark set within all detection units. The two proposed different comparing definitions are described as fo llows:. Watermark Set Extracted by Comparing Directly with Value. Suppose that a sum of the coefficients’ absolute value that relate to the element of the watermark set within all detection units is S. A bit of watermark is detected as below:. 0, if ST − S O < 0 a watermark bit = 1, if S T − S O >= 0. (3.2). ST is S of tested image. SO is S of original test image.. Watermark Set Extracted by Comparing with Proportional Value. A bit of watermark is detected as below:. 0, if ( S T ÷ S T , L , D ) − ( S O ÷ S O, L, D ) < 0 a watermark bit = 1, if ( S T ÷ S T , L , D ) − ( S O ÷ S O, L , D ) >= 0. (3.3). ST, L, D is the sum of all modified coefficients’ absolute value within the subband that is from direction D at level L in tested image. SO, L, D is those in original image.. Using different extracting method from different subband, the proposed scheme 15.
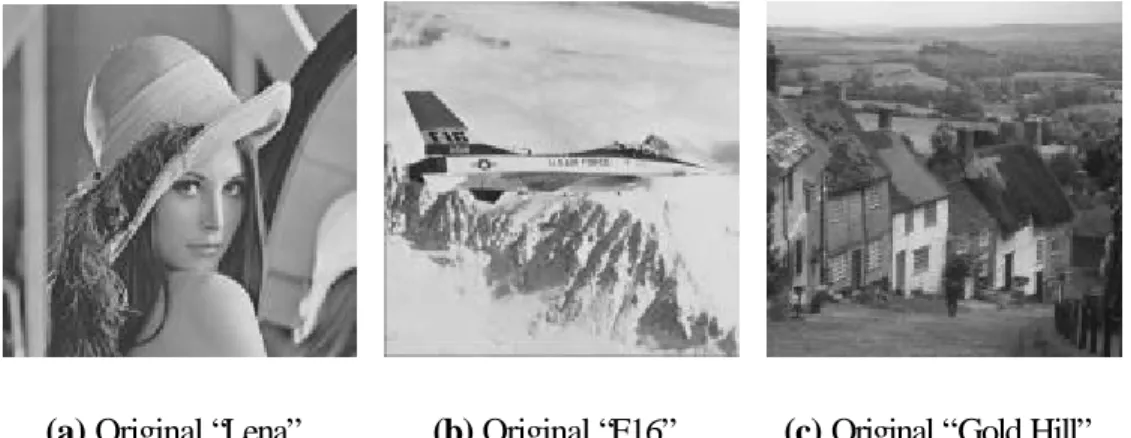
(16) tolerates most of the attacks on digital image. The behavior of various attacks, the robustness and limitation of the proposed scheme are analyzed on next section.. 4. Experiment Analysis. To measure the feasibility of the proposed watermarking scheme, we have conducted a series of experiments. The watermark is a visual recognizable binary image with the size of 32x32 pixels. It is shown in Fig. 4.1.. Figure 4.1 Original Watermarks.. The first test is the visual image quality after watermarks embedded. The host images “Lena”, “F16” and “Gold Hill” are shown in Fig. 4.2.. (a) Original “Lena”.. (b) Original “F16”.. (c) Original “Gold Hill”.. Figure 4.2 Test Images.. Image qualities of embedded images are shown in table 4.1. 16.
(17) PSNR. Lena. F16. God Hill. 38.6117. 38.6504. 38.6311. Table 4.1 Image Qualities of Watermarked Images.. In addition, the watermarked image and the watermark extracted from “Lena” are shown in Fig. 4.3. It shows that not every watermark extracted from each subband is clear. This is because not all coefficients in each subband have sufficient capacity to be modified.. (a) Watermark Embedded “Lena”, PSNR: 38.6117.. (b) Watermarks Extracted by Comparing Directly with Value.. (c) Watermarks Extracted by Comparing with Proportional Value.. Figure 4.3 Watermark Embedded and Extracting Test.. 17.
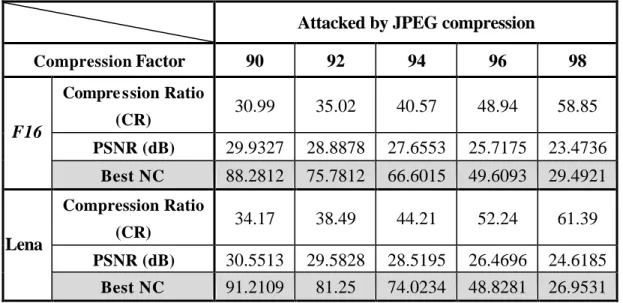
(18) To simulate different kind of attacks, we use almost all major functions of two famous image processing software: Paint Shop Pro and Photoshop. Most of the attacks can be tolerated by proposed watermark scheme. The attacks that have been tested are compression, noises, blur, sharpening and histogram distribution. It will be analyzed one by one category later.. In order to measure the quantitative similarity of watermarks, the Normalized Cross-Correlation (NC) is used in this paper. In addition, the Peak Signal to Noise Ratios (PSNR) is used to evaluate the quality of the watermarked image.. 4.1 JPEG Compression. Attacked by JPEG compression Compression Factor. 90. 92. 94. 96. 98. 30.99. 35.02. 40.57. 48.94. 58.85. PSNR (dB). 29.9327. 28.8878. 27.6553. 25.7175. 23.4736. Best NC. 88.2812. 75.7812. 66.6015. 49.6093. 29.4921. 34.17. 38.49. 44.21. 52.24. 61.39. 30.5513 91.2109. 29.5828 81.25. 28.5195 74.0234. 26.4696 48.8281. 24.6185 26.9531. Compre ssion Ratio. F16. (CR). Compression Ratio. Lena. (CR) PSNR (dB) Best NC. Table 4.2 The Best NC Value under Different JPEG Compression Ratio. Table 4.2 shows the numerical results of proposed watermarking method with both host image “F16” and “Lena” after JPEG compression with different compression factors. The experiment directly began from compression factor 90 in order to. 18.
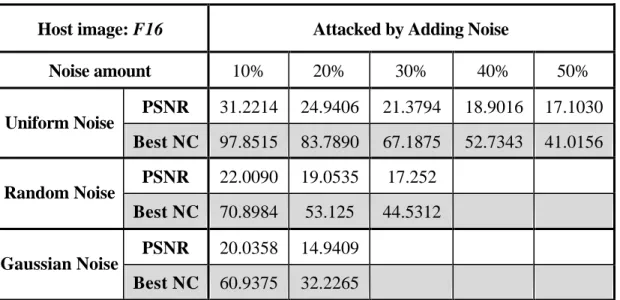
(19) test robustness of proposed scheme in high compression condition.. It is obvious that the scheme is resistant to JPEG compression. The NC value remains high if the compression factor is below 94. The compression attack’s beha vior is like to thresho ld the high frequency coefficients. Due to the structure of proposed scheme, the watermarks embedding step is to modify the stronger (larger when compared the absolute value) coefficients, which are not easy to be thresholded by compression process. Therefore the proposed scheme can tolerate compression attack much. In addition, the best location to extract watermark under JPEG attack in most conditions is total high bands’ trend (Total H).. 4.2 Noise. Host image: F16 Noise amount Uniform Noise. Random Noise. Gaussian Noise. Attacked by Adding Noise 10%. 20%. 30%. 40%. 50%. PSNR. 31.2214. 24.9406. 21.3794. 18.9016. 17.1030. Best NC. 97.8515. 83.7890. 67.1875. 52.7343. 41.0156. PSNR. 22.0090. 19.0535. 17.252. Best NC. 70.8984. 53.125. 44.5312. PSNR. 20.0358. 14.9409. Best NC. 60.9375. 32.2265. Table 4.3 The Results of Watermarking Under Adding Noise Attacks. There are three major kinds of noise that would influence image quality. They are Uniform, Random and Gaussian noises. It is shown that the Gaussian noise does. 19.
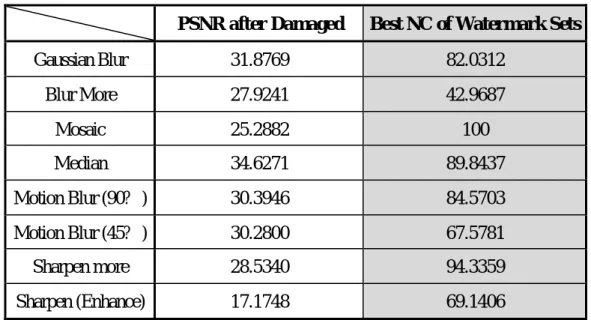
(20) attack the image quality a lot. That is because both Uniform and Random noises’ behavior are more likely disturbing the original wavelet coefficients. However Gaussian noises’ behavior is more likely adding another amount on original coefficients, and this would cause tremendous damage on original wavelet frequencies’ distribution. Table 4.3 shows the numerical test results of those three attacks. The best locations to extract watermark under noises adding in most conditions are lower bands’ trend (LL and Total H3).. 4.3 Blur and Sharpen PSNR after Damaged. Best NC of Watermark Sets. Gaussian Blur. 31.8769. 82.0312. Blur More. 27.9241. 42.9687. Mosaic. 25.2882. 100. Median. 34.6271. 89.8437. Motion Blur (90? ). 30.3946. 84.5703. Motion Blur (45? ). 30.2800. 67.5781. Sharpen more. 28.5340. 94.3359. Sharpen (Enhance). 17.1748. 69.1406. Table 4.4 The Results of Watermarking Under Blur and Sharpen Attacks. Blur is a kind of attack that makes the image looked like more smooth. It makes those coefficients at higher subband smaller. There are many different blur ways that make different visual effects. Opposite to blur, sharpen makes those coefficients at higher subband larger. The sharpened image looks like harsher than original one. Ta20.
(21) ble 4.4 shows the numerical results of those tests under different conditions.. The best locations to extract watermark under blurring in most conditions are lower bands’ trend (LL and Total H3). The best locations to extract watermark under sharpening in most conditions are higher bands’ trend (Total H, Total H1, Total LH1, Total HL1 and Total HH1).. In most of these series test, extracted watermarks by comparing with proportional value are better than those directly with value. That is because that, although most of high frequency coefficients within the same subband are simultaneously smaller (larger) than original, the proportional relations between one single coefficient and all detection units are same in most situations. In addition, the proposed scheme shows again the ability of extracting watermarks that sur vived attacks from different direction in motion blur test. 4.4 Histogram Distribution PSNR after Damaged Best NC of Watermark Sets Darker. 27.3198. 100. Brighter. 29.0572. 100. Low Contrast. 32.4559. 100. High Contrast. 32.6037. 100. Color Quantizing (16 colors). 31.9220. 95.8984. Equalization. 11.4924. 41.4625. Equalization (Scene). 23.2669. 89.8437. Table 4.5 The Results of Watermarking Under Histogram Adjustment. 21.
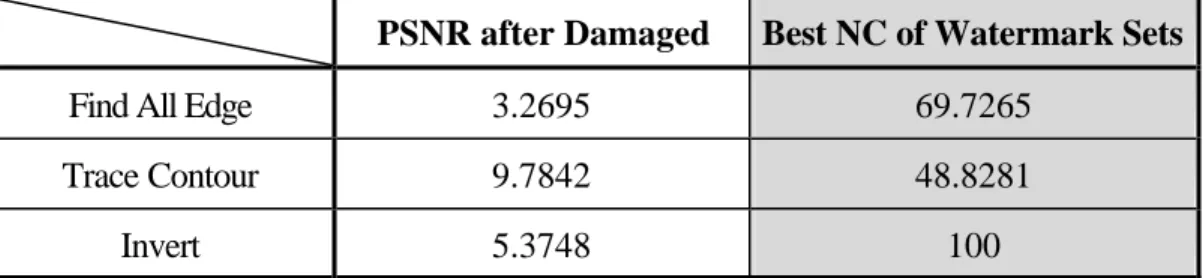
(22) This kind of imaging processing step in software are usually color adjustment such like brightness, contrast, color quantizing and equalization. Table 4.5 shows the numerical results of this series’ test. This kind of attacks changes the coefficients in low frequency subband a lot.. The proposed scheme is good enough to tolerate most of those attacks. But it is an exception under equalization condition. The ability of watermark extracting from equalized image is very image dependent. If the histogram distribution of original image is more balance (average), the histogram distribution of equalized image will not change a lot.. The best locations to extract watermark under histogram modification are diffe rent in different situations. The same point is that the watermark extracted from LL band is much weaker. This is because that this kind of attack is effect on whole image at once. It changes the trend of all image pixel values.. 4.5 Edge Detections and Invert PSNR after Damaged. Best NC of Watermark Sets. Find All Edge. 3.2695. 69.7265. Trace Contour. 9.7842. 48.8281. Invert. 5.3748. 100. Table 4.6 The Results of Watermarking Under Edge Preserving. This series tests shows promising results. Due to the propose scheme, like other 22.
(23) similar techniques, modify the stronger high frequency sub bands’ coefficients, which are group almost around image object’s clearer edges. Therefore, there still have some information survive after this kind of attacks. Table 4.6 shows the numerical results of these tests. The best locations to extract watermark under this kind of attack are surely higher bands’ trend due to the reason mentioned above.. As shown in previous experiment, the idea of the proposed scheme is accurate. The various attacks influence the different subbands’ trend of image’s DWT coefficients. Therefore the watermark may survive at the subbands that may not be damaged. Besides, the different definitions of watermark extraction step would make the different results. Generally, watermarks extracted by comparing with proportional value are better than watermarks extracted by comparing directly with value. The best and worst results of former are more average than those of later.. 5. Conclusion and Future Works. In this paper, a feasible DWT-based frequency-domain watermarking scheme has been proposed. This scheme is designed based on aspect of implementation and observation of DWT on digital image. The idea is to extract watermark from those stable trends of DWT subbands, where the watermarks is embedded by modifying all coefficients of each subband according to their capacity to be modified. Experimental re-. 23.
(24) sults demonstrate that the proposed method is robust enough to tolerate most of image-processing operations.. It is also mentioned that how different attacks influence the ability of watermark schemes under similar structure. There are still have a lot of improvable capacity. It is shown in this paper that even we modify the same amount on coefficients, different watermarks extracting strategy could make different results. We only propose two strategies to extract watermarks. To improve the proposed watermarking scheme is always possible. Besides, it is also a discussable topic about automatically searching for the best locations of watermark extraction.. Reference [1]. F. Mintzer, G. W. Braudaway and M. M. Yeung, "Digital Watermarking for High-quality Imaging", IEEE First Workshop on Multimedia Signal Processing, PP. 357-362, 1997.. [2]. C. T. Hsu and J. L. Wu, "Hidden Digital Watermarks in Images", IEEE Trans. Image Processing, Vol. 8, No. 1, PP. 58-68, 1999.. [3]. W. N. Lie and L. C. Chang, "Spatial-Domain Image Watermarking By Data Embedding At Adaptive Bit Positions", 12th IPPR Conference on Computer, Vision, Graphics and Image Processing, PP. 16 -21, 1999.. [4]. S. C. Pei, Y. H. Chen and R. F. Torng, "Digital Image and Video Watermarking Utilizing Just-Noticeable-Distortion Model", 12th IPPR Conference on Com-. 24.
(25) puter Vision, Graphics and Image Processing, PP. 174 -182, 1999. [5]. M. Piva, F. Barni and V. Cappellini, "DCT Based Watermarking Recovering without Resorting t the Uncorrupted Original Image", Proc. of IEEE Inter. Conf. on Image Processing, Vol. 1, PP. 520-523, 1997.. [6]. W. C. Cheng, C. W. Chu and J. S. Wang, "A Robust Watermarking Method on Discrete Cosine Transform Domain", 12th IPPR Conference on Computer Vision, Graphics and Image Processing, PP. 191 -198, 1999.. [7]. S. D. Lin and C. F. Chen, "A Robust DCT-based Watermarking for Copyright Protection", Consumer Electronics, IEEE Trans. Vol. 46, PP. 415 -421, Aug. 2000.. [8]. J. Onishi and K. Matsui, "A Method of Watermarking with Multiresolution Analysis and PN Sequence", Trans. of IEICE (D-II), Vol. J80-D-II, No.11, PP. 3020, 1997.. [9]. H. Inoue, A. Miyazaki, A. Yamamoto and T. Katsura, "A digital watermark based on the wavelet transform and its robustness on image compression", ICIP 98, Proceedings, Vol. 2, PP.391 -395, 1998.. [10]. Chun-Shien Lu, Shih-Kun Huang, Chwen-Jye Sze, and Hong-Yuan Mark Liao, "Cocktail Watermarking for Digital Image Protection", IEEE Transactions on Multimedia, Vol. 2, No. 4, PP. 209 -224, Dec. 2000.. [11]. D. Chai and A. Bouzerdoum, "JPEG2000 Image Compression: An Overview", 7th Australian and New Zealand Intelligent Information Systems Conference, Nov. 2001.. 25.
(26)
數據
+6
相關文件
To facilitate the Administrator to create student accounts, a set of procedures is prepared for the Administrator to extract the student accounts from WebSAMS. For detailed
According to Ho (2003), Canto Pop “has developed since the early 1970s with a demand from Hong Kong audiences for popular music in their own dialect, Cantonese. Cantonese is one
Debentures are (3) loan capital and are reported as (4) liabilities part in the statement of financial position. No adjustment is required. If Cost > NRV, inventory is valued
Reading Task 6: Genre Structure and Language Features. • Now let’s look at how language features (e.g. sentence patterns) are connected to the structure
Using this formalism we derive an exact differential equation for the partition function of two-dimensional gravity as a function of the string coupling constant that governs the
National Central University (NCU) welcomes students with a range of qualifications from all over the world. Eligibility requirements vary according to
Which of the following is used to report the crime of damaging the Great Wall according to the passage.
Given a connected graph G together with a coloring f from the edge set of G to a set of colors, where adjacent edges may be colored the same, a u-v path P in G is said to be a
