國
立
交
通
大
學
應 用 化 學 系
博
士
論
文
分子束多原子分子之紫外光光電子影像
Vacuum ultraviolet photoelectron imaging of polyatomic
molecules in supersonic molecular beams
研 究 生:廖雪兒
指導教授:李遠鵬 教授
鈴木俊法 教授
分子束多原子分子之紫外光光電子影像
Vacuum ultraviolet photoelectron imaging of polyatomic molecules in supersonic
molecular beams
研 究 生:廖雪兒 Student:Suet-Yi Liu
指導教授:李遠鵬博士 Advisor:Yuan-Pern Lee
鈴木俊法博士 Toshinori Suzuki
國 立 交 通 大 學
應 用 化 學 系
博 士 論 文
A ThesisSubmitted to Department of Applied Chemistry College of Science
National Chiao-Tung University in partial Fulfillment of the Requirements
for the Degree of Ph.D. in
Applied Chemistry February 2011
Hsinchu, Taiwan, Republic of China
i
Abstract
I have constructed a He(I) ultraviolet photoelectron spectrometer using a supersonic molecular beam and a two-dimensional position-sensitive detector of photoelectrons. The photoelectron imaging (PEI) spectrometer enabled measurements of photoelectron spectra and photoelectron angular distributions with an efficiency considerably higher than a conventional spectrometer using a hemispherical energy analyzer. The most crucial factor for this achievement was to overcome high susceptibility of PEI to background electrons generated by scattered He(I) radiation. I examined various designs of electrodes experimentally and computationally and identified the main source of the background photoemission as the repeller plate used for acceleration of electrons. I designed a new electrostatic lens that intercepts background photoelectrons from the repeller plate traveling toward the imaging detector. High energy resolution (E/E) of 0.735 % was achieved at E = 5.461 eV with He(I) radiation that has rather poor beam characteristics. The photoelectron angular anisotropies as a function of photoelectron kinetic energies are presented for jet-cooled benzene and pyridine. The PEI spectrometer was also employed in photoionization experiments using a vacuum ultraviolet free electron laser (VUV-FEL) at SPring-8 in Japan as a light source. A time-resolved photoelectron imaging using a femtosecond ultraviolet (UV) laser as a pump pulse and the VUV-FEL as a probe pulse is presented. Ultrafast internal conversion and intersystem crossing in pyrazine in a supersonic molecular beam were clearly observed. The VUV radiation allowed us to observe the entire Franck-Condon envelope in photoionization from a transient electronic state, which was not possible in UV-DUV experiment in the laboratory.
ii
謝誌
終於畢業了。回想十年前還在念大一的我,當時還在怕連大學也畢不了業,真沒想 到今天竟然博班畢業了。從小城市的澳門跑到台灣念書,在這裡生活了七年多,從剛開 始的膽膽驚驚,到現在已經把這裡當作我第二個家了。老實說,雖然在澳門念了十幾年 書,但對尋求知識的態度,真的是在台灣的時候才學會。很感謝我的指導教授李遠鵬老 師,他的物化課讓我開竅,也讓我從拾讀書的信心。他的實驗室也提供了最好的儀器設 備以及學習環境,讓我可以打穩基礎。還有他細心的指導,訓練我的邏輯思考。更感謝 他讓我在日本學習三年,讓我有機會廣闊自己的視野。另外,也要感謝口試委員王念夏 老師,林志民老師和李英裕老師對論文的指導和鼓勵。 在大學跟研究生的生涯裡,很感謝實驗室的學長姊們在我實驗上的教導,有 cool cool 的鐘昭宇學長,文靜的劉靜澕學姊,親和力十足的佳燕學姊,做事很有效率的呂志 偉學長,帥氣跟智慧並重,人見人愛車見車載的朱小花教授,理論計算顧問吳宇中學長, 外冷內熱的陳慧芬學姊,喜歡幫人的楊勝凱學長,以及跟我一起常熬夜的 Mo Mo 等等。 另外,也要感謝秘書莊媽一直以來的照顧。還要感謝實驗室裡活力十足的學弟妹跟伙伴 們:愛帥愛吵愛冷笑話,但又親切又好玩的鄭大頭,好玩好笑好可愛的郁旋,傻傻的俞 範,還有韓慧玲,傅龍,洋洋,姚姚,黃上臻,陳勁達,書毓,建亨等等。有你們的陪 伴,讓我在實驗室每天都過得很開心。 另外也要感謝鈴木俊法老師,他在研究上給予我十足的自由度跟資源,讓我很放心 的實行自己在實驗上的想法,也陪養了我的獨立思考能力。還有實驗室裡的每一位優秀 的 博 後 研 究 員 : Kohguchi-san, Nishizawa-san, Fuji-san, Ohshimo-san, Ogi-san,Horio-san, Mizuno-san, Tang-san, Niu-san, Pei-san, Zuo-san,很感謝你們每一位在我實
驗上的協助跟指導,每天午餐時段的閒聊,舒緩了我不少壓力。還有秘書 Matsumoto-san 熱心的幫忙,幫我解決了不少生活上的麻煩。在日本這三年,我體會很深,真真正正地 感受到獨立生活的孤獨,還有語言不通的麻煩。不過,與此同時,這些日子也讓我成長
iii
不少,讓我更有信心去迎接以後的挑戰。另外,很想感謝一個日本朋友,Hosonuma-sensei, 她的熱情招待,每次都讓我很窩心,同時她也讓我接觸到很多日本的文化跟食物。 最後,要感謝我的家人無限量的支持和男朋友無限次的體諒,讓我可以無顧慮地完 成我的學業。我以此論文獻給我所有親愛的親友們。iv
Table of contents
Abstract……….i Acknowledgements………ii Table of Content……….iv List of Figures………..vii List of Tables………xv Chapter 1. Introduction 1.1 Ultraviolet photoelectron spectroscopy (UPS)…………..……….…………..………11.2 The angular distribution of photoelectrons………..……….….…..….3
1.3 Conventional ultraviolet photoelectron spectroscopy………..…..…………...……4
1.4 Analysis of unresolved band………...6
1.5 Motivation………..…………...8
1.6 Thesis outline……….…...…9
1.7 References………...16
Chapter 2. Experimental methods 2.1 History of photoion imaging……….……….…….18
2.2 Image reconstruction……….………….….19
2.2.1 Inversion Abel Transformation……….….20
2.2.2 BASEX and p-BASEX method……….….21
2.3 Experimental setup……….…….……22
2.3.1 He(I) discharge lamp……….…….……22
(A) He(I) with polarizer……….……….…23
(B) He(I) without polarizer……….…23
2.3.2 Vacuum chamber………...23
v
(B) A new vacuum chamber………...25
2.4 Data analysis………..26
2.4.1 Image center calibration………..26
2.4.2 Calibration of photoelectron kinetic energy (PKE) distribution………...…..27
2.4.3 Photoelectron angular distribution (PAD)……….…28
2.5 References………...39
Chapter 3. Designing a PEI spectrometer for He(I) light source 3.1 He(I) PEI experiment using an old vacuum chamber……….…40
3.1.1 Reduction of background noise……….…..41
3.1.2 He(I) photoelectron images of supersonic beams of Ar, Kr and N2………...42
(A) Determination of polarization degree of He(I) radiation……….….42
(B) Examination of cluster formation in supersonic beams……….….42
(C) Results……… ..……….….43
3.2 He(I) PEI experiment using a new vacuum chamber………..………..……….44
3.2.1 Testing three electrode design by Eppink and Parker………..………..……..….….44
3.2.2 A new electrostatic lens………..………46
3.2.3 Molecular beam diameter and velocity resolution……….47
3.2.4 Distortion of the photoelectron image……….48
3.2.5 The final design of electrostatic lens………...….…..49
3.2.6 Chromatic aberration……….……….…50
3.2.7 He(I) PEI of rare gases with a new lens set……….……51
(A) Velocity resolution……….………….…..51
(B) Photoelectron angular distribution……….……….…..52
3.3 Conclusion………...……….…..52
3.4 References………...85
Chapter 4. He(I) photoelectron imaging of benzene and pyridine 4.1 He(I) ultraviolet photoelectron imaging of benzene……….…….86
4.1.1 Introduction……….………..86
vi
4.1.3 Results……….……88
4.2 He(I) ultraviolet photoelectron imaging of pyridine………….………..89
4.2.1 Introduction……….……….…..89
4.2.2 Results………...90
4.3 Conclusion………..91
4.4 References……….….104
Chapter 5. Time-resolved PEI of pyrazine using a fs-UV laser and a VUV-FEL 5.1 Introduction……….……….…….107
5.2 One-photon ionization by SASE-FEL……….….109
5.2.1 Spring-8 compact SASE source……….……….…….109
5.2.2 Suppression of background photoemission using newly designed electrode system……….…110
5.2.3 Comparison of PEI with He(I) and SASE-FEL……….………..111
5.3 (1+1’) pump-probe experiment of pyrazine……….……….……112
5.3.1 Introduction……….……….112
5.3.2 Experimental setup……….……….….113
5.3.3 Spatial overlapping between UV and VUV FEL……….………115
5.3.4 Results……….…..116
(A) S1–S0 Internal conversion (IC)……….……….…..116
(B) S1–T1 Intersystem crossing (ISC)………..117
5.4 Conclusion……….………....118
5.5 References……….131
Chapter 6. Summary……….….…133
vii
List of Figures
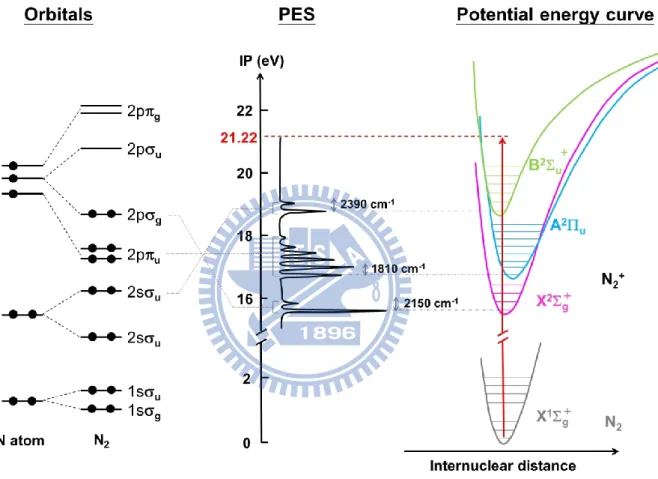
Figure 1.1 The schematic drawing of orbital, photoelectron spectrum and potential energy
curve of nitrogen……….…..10
Figure 1.2 Schematic drawing of UPS and XPS………11
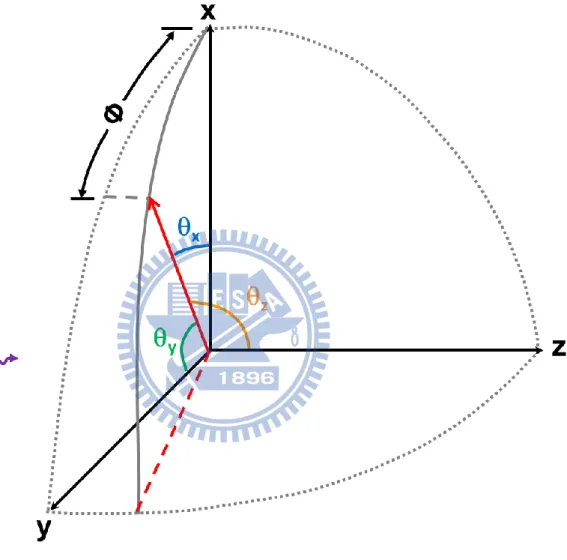
Figure 1.3 Orientation of the photoelectron with respect to the x, y and z axis. The photon h
is incident along the z axis………....12
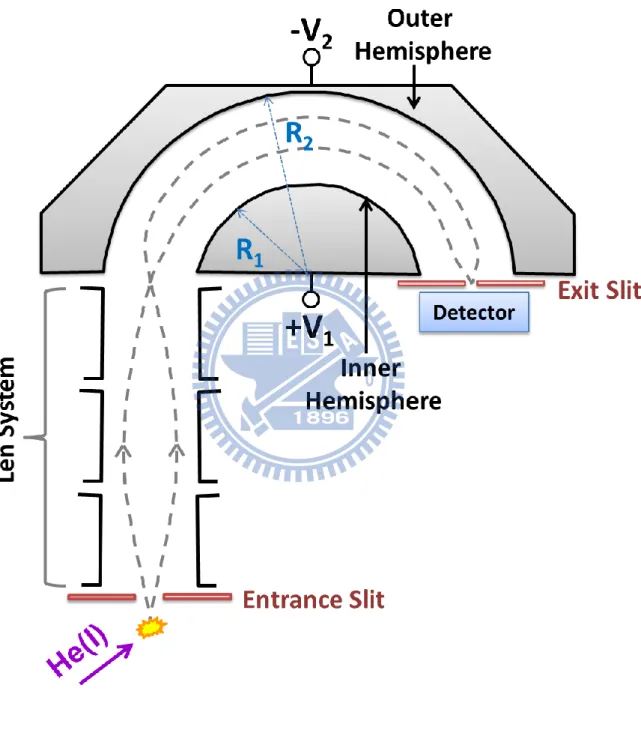
Figure 1.4 Schematic drawing of hemispherical energy analyzer……….13
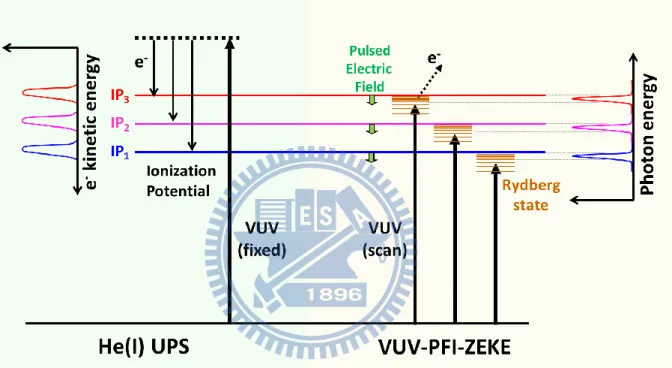
Figure 1.5 The schematic drawing of He(I) UPS using He(I) radiation (21.22 eV) and
PFI-ZEKE photoelectron spectroscopy, photoelectrons are detected by a pulsed electric field……….……..14
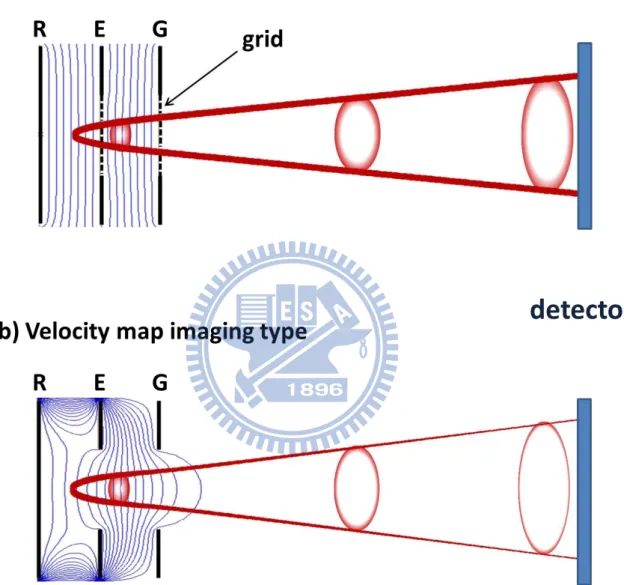
Figure 2.1 (a) W-M type electrode consists of one flat plate and two flat grids. (b) Velocity
mapping type electrodes are the W-M type electrodes with annular holes instead of grids.…30
Figure 2.2 The schematic diagram of image analysis………31
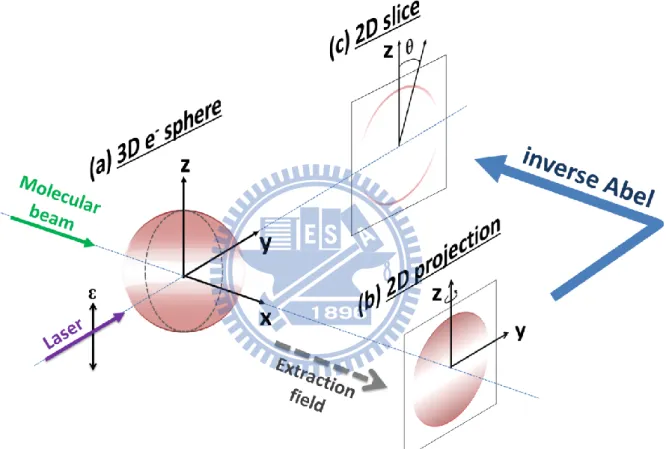
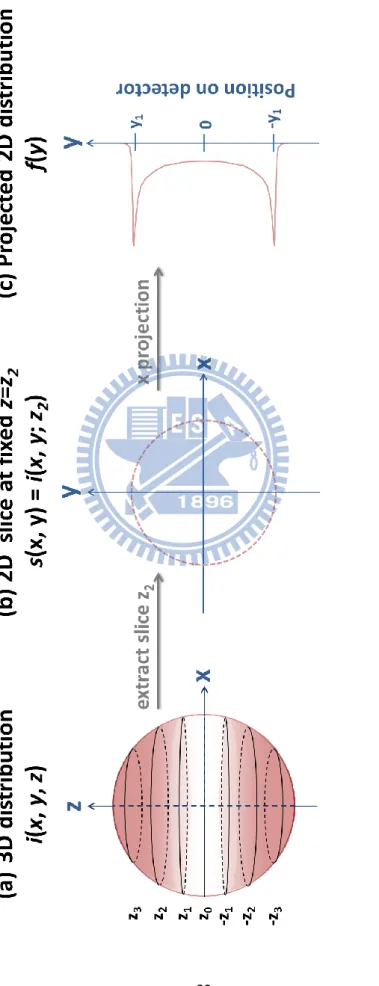
Figure 2.3 (a) Slice pattern of 3D distribution through fixed z in xy-plane. (b) 3D slice image
at z2. (c) The projection of (b) maps the electrons onto a line on the detector……….…32
Figure 2.4 (a) The raw projection image of N2. (b) The 3D slice image after inverse Abel
transformation. (c) The 3D slice image after p-BASEX reconstruction……….33
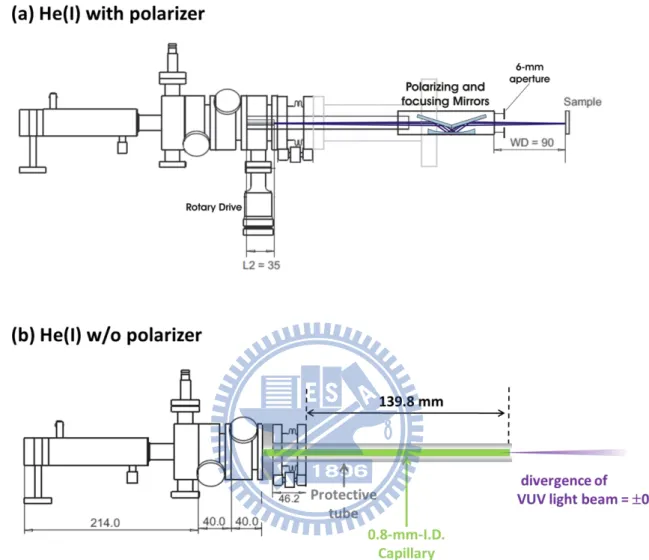
Figure 2.5 The schematic drawing of He(I) discharge lamp: (a) with a linear polarizer; (b) the
linear polarizer was replaced by 0.8mm-diameter capillary……….34
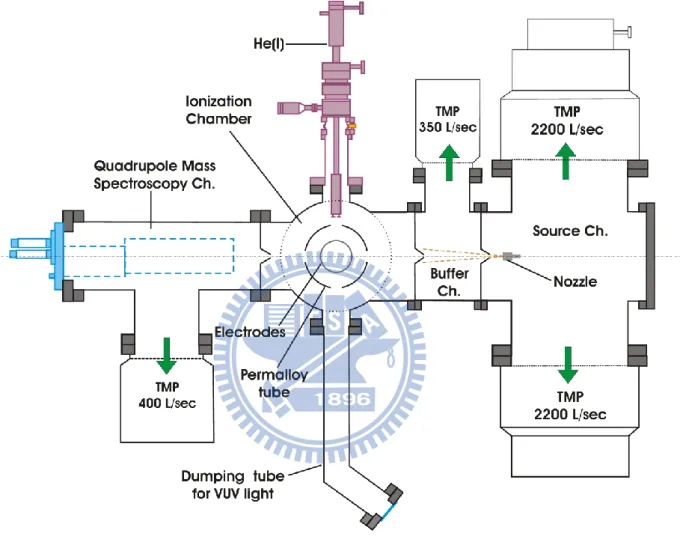
Figure 2.6 The schematic drawing of the entire vacuum chamber which is originally designed
for droplet experiment……….…..35
Figure 2.7 (a) The cross-sectional view of the ionization chamber and the imaging system. (b)
The cross-sectional view and field lines for the electrostatic lens system. The electrode gap between repeller and extractor electrode is denoted as d. In the original design, d = 6 mm…36
viii
Figure 2.8 The schematic view of the new vacuum chamber……….…….37
Figure 2.9 (a) and (c) are the PEI of Kr obtained for free electron laser and He(I),
respectively: the left half is the raw image and the right half is the slice image obtained by taking the inverse Abel transform. (b) and (d) are the polar plots of slice images obtained from (a) and (c), respectively………38
Figure 3.1 Photoelectron images observed by He(I) photoionization of a supersonic beam of
Ar: (a) 6 mm aperture of He(I) light source was used. (b) 2 mm aperture of He(I) light source was used………...…..54
Figure 3.2 (a)-(c) Intensity-integrated raw photoelectron images of Kr at a stagnation pressure
of 2.2 MPa at different electrode gap distance of 6 mm, 9 mm and 12 mm. (d denotes the electrode gap distance, apt denotes the aperture diameter of He(I) light source). denotes the directions of the polarization vectors of the VUV beam……….………..55
Figure 3.3 Difference between the anisotropy parameter calculated for Kr (2P3/2) by
assuming different polarization degrees of light and the literature value 1.24.[ref. 1] The polarization degree of 74 % provides the best agreement………...……….56
Figure 3.4 Photoelectron kinetic energy distributions in He(I) photoionization of supersonic
beams of Ar generated at different stagnation pressures of 0.4 (solid), 1.1 (dash dot), and 2.2 (dash) MPa………..…..57
Figure 3.5 (a)–(c) Intensity-integrated raw photoelectron images observed by He(I)
photoionization of a supersonic beam of pure Ar, Kr and N2, respectively. (d)–(f)
Photoelectron images of Ar, Kr and N2 after background subtraction. (g)–(i) 2D slice images
of Ar, Kr and N2 obtained with the modified p-BASEX reconstruction. denotes the directions of the polarization vectors of the VUV beam……….….58
Figure 3.6 (a) Photoelectron kinetic energy distribution in He(I) photoionization of
supersonic beams of Ar. (b) Photoelectron kinetic energy distribution in He(I) photoionization of supersonic beams of Kr. The inset shows an expanded view in the PKE region between 6.0 and 8.0 eV. The solid red line indicates the best-fit Gaussian to the observed data; it has a
ix
FWHM of 246 meV at 7.22 eV……….59
Figure 3.7 (a) Photoelectron kinetic energy distribution in He(I) photoionization of
supersonic beams of N2. The spectral feature agrees reasonable well with the literature [Ref.
3]. (b) Expanded view of He(I) photoelectron spectrum of N2 in the A band region. The solid
red and dotted green lines show the overall distribution and individual Gaussian components obtained by least-squares fitting………...60
Figure 3.8 (a) 2D representation of the cylindrically symmetric potential in the VMI spectrometer. (b) Experimental geometry for photoelectron imaging experiment. The molecular beam and time-of-flight axis are located along the x axes; VUV light beam is located along y axis………...………61
Figure 3.9 The simulated velocity resolution (/)y (black solid square) and (/)z (red
solid circle) as a function of electrode spacing (upper panel) and the resolution difference [(/)y - (/)z] (lower panel)………62
Figure 3.10 The simulated velocity resolution (/)y (black solid square) and (/)z (red
solid circle) as a function of hole diameter (upper panel) and the resolution difference [(/)y - (/)z] (lower panel)………..63
Figure 3.11 Cross-sectional view of the electrostatic lens system using three-electrode
configuration (all units in millimeters). A molecular beam is introduced from the bottom and is irradiated by He(I) radiation at the position indicated by the cross ()……….64
Figure 3.12 Velocity resolution simulated by performing trajectory calculation with 3D
Simion software as a function of Vext/Vrep: (a) He(I) experiment condition: light beam diameter
= 4.2 mm. (b) FEL experiment condition: light beam diameter = 0.1 mm………65
Figure 3.13 (a)-(c) Photoelectron images of Ar using the three-electrode configuration with
solid repeller electrode. (d)-(f) Photoelectron images of Ar after replaced the solid repeller electrode to mesh repeller electrode……….….66
Figure3.14 Cross-sectional view of the electrostatic lens system (all units in millimeters). A
x
position indicated by the cross (). An example of the voltage setting in the measurement of photoelectron image of Kr is also shown in the figure……….………67
Figure 3.15 (a) Simulated trajectory (red, blue and orange) of electrons emitted from the
mesh electrode and photoelectrons from the photoionization point (black). The equipotential lines are also shown (light brown). (b) 2D representation of the cylindrically symmetric potential Φ(x,y) of (a)……….68
Figure 3.16 Velocity resolution simulated by performing trajectory calculation with 3D
Simion software as a function of (molecular beam dia./VUV beam dia.) ratio and VUV beam diameter is fixed at 4.3 mm. Noted that solid symbol indicated the ionization volume aligned along the VUV beam axis (Y axis), open symbol indicated the ionization volume aligned along the molecular beam axis (X axis), as indicated at the top of the figure………..…....69
Figure 3.17 Velocity resolution simulated by performing trajectory calculation with 3D
Simion software as a function of Vext/Vrep: He(I) experiment with light beam diameter of 4.2
mm are indicated as solid symbol. FEL experiment with light beam diameter of 0.1 mm are indicated as open symbol………..70
Figure 3.18 Photoelectron images of Ar using a new design electrode. (a) before background
subtraction. (b) background image observed without the sample gas. (c) after background subtraction. The distortion of the image was observed……….……71
Figure 3.19 (b) and (d) are photoelectron images of Ar measuring with electrode (a) and (c),
respectively……….72
Figure 3.20 (a) The configuration of the spectrometer including a charged insulator in 3D
drawing. (b) The images simulated in three conditions: (i) no charged insulator (black), (ii) charged insulator with -800V (red) and (iii) charged insulator with -50 V (blue)………73
Figure 3.21 (a) The configuration of the spectrometer including a charged insulator in 3D
drawing. (b) The images simulated in three conditions: (i) no charged insulator (black), (ii) charged insulator with -800V (red) and (iii) charged insulator with -50 V (blue)………74
xi
in millimeters). A molecular beam is introduced from the bottom and is irradiated by He(I) radiation at the position indicated by the cross ().An example of the voltage setting in the measurement of photoelectron image of Kr is also shown in the figure……..……….75
Figure 3.23 Velocity resolution simulated by performing trajectory calculation with 3D
Simion software as a function of Vport/Vrep and Vext/Vrep………...76
Figure 3.24 (a) The geometries of the simplified electrodes. (b) Calculated velocity resolution
as a function of the number of lens electrodes behind the extractor. The ionization volume was assumed to be 3.4 ϕ 4.2 mm……….…….77
Figure 3.25 Photoelectron images of Ar using a new design electrode with shielding all
insulators. (a) before background subtraction. (b) background image observed without the sample gas. (c) after background subtraction. No distortion of the image was observed…….78
Figure 3.26 Simulated energy resolution (E) as a function of photoelectron kinetic energy using our newly designed electrode with different number of lens electrodes. The result of conventional three-electrode design is also shown (open green triangle) in the figure………79
Figure 3.27 PKE distributions determined by He(I) PEI of supersonic beams of Kr using a
(512 512 pixels) CCD camera. The inset shows an expanded view in the PKE region between 6.0 and 8.0 eV. The solid red line indicates the best-fit Gaussian to the observed data; it has a FWHM of 210 meV at 7.22 eV………80
Figure 3.28 Velocity resolution evaluated using photoelectron imaging of Kr as a function of
Vext/Vrep. A low-resolution (512 512 pixels) CCD camera was used without image
processing. Due to insufficient resolution of the camera, the focusing curve is dull. The inset shows velocity resolution evaluated using photoelectron imaging of Ar with super-resolution (4096 4096 pixels) imaging system. The focusing curve becomes much sharper and the resolution varies as a V-shape for the Vext/Vrep ratio. The error bar corresponds to the fitting
error (fwhm)………..81
Figure 3.29 PKE distributions determined by He(I) PEI of supersonic beams of Ar using a
xii
the PKE region between 5.1 and 5.6 eV. The solid red line indicates the best-fit Gaussian to the obeerved data; it has a FWHM of 40 meV at 5.461 eV………82
Figure 3.30 The definition of the individual four quadrants of the image is shown in the inset.
The observed PAD of (a) 2P1/2 and (b) 2P3/2 of Kr, obtained from each quadrant and the
corresponding least-squares fits are shown with open circles and solid lines. The determined anisotropy parameters, the average and the standard deviation obtained in each quadrant are also shown………..83
Figure 4.1 (a) Photoelectron image of a continuous supersonic beam of 8% benzene seeded in
He (the background image has been subtracted). (b) Ion image with the supersonic molecular beam. (c) Ion image without the molecular beam. The arrow indicates the propagation direction of the He(I) radiation……….………93
Figure 4.2 (a) Symmetrized photoelectron image of a pulsed supersonic beam of benzene. (b)
the slice image obtained from (a). (c) The energy-dependent anisotropy parameters (upper panel, solid circle) and photoelectron spectra (lower panel) obtained from (b). Data from [ref. 12], [ref. 19] and [ref. 11] are given as open squares (□), open triangles () and open inverted triangles (), respectively. The assignments of the ionized orbitals are indicated at the vertical ionization point [ref. 19]. The error bars are the fitting errors………..94
Figure 4.3 (a) Symmetrized photoelectron image of a pulsed supersonic beam of 10%
pyridine seeded in He (left half) and the slice image taking the inverse Abel transform (right half). (b) The energy-dependent anisotropy parameter (upper panel, solid circles) and photoelectron spectra (lower panel) obtained from (a). Data from [ref. 42] and [ref.41] are given as open squares (□) and open triangles (), respectively. The assignments of the ionized orbitals are indicated at the vertical ionization point [ref. 44]. The error bars are the fitting errors……….………95
Figure 5.1 Schematic illustration of the principle of a pump-probe experiment with ionization
for probing. The pump pulse excites an electronic state and after some delay (eg. t1, t2) the
probe pulse ionizes the excited neutral molecule………..119
xiii
Figure 5.3 Photoelectron image observed for photoionization of a pulsed supersonic beam of
Kr at a stagnation pressure of 0.1 MPa with FEL (60 nm) using a conventional three-plate electrostatic lens: (a) before and (b) after background subtraction. (c) Photoelectron image of Kr measured with newly-design electrostatic lens. No background image was subtracted…121
Figure 5.4 Comparison of PKE distributions of Kr in photoionization by He(I) radiation
(solid) and FEL radiation (wavelength: 58.4 nm) (dashed)……….…..122
Figure 5.5 (a) Symmetrized photoelectron image observed for photoionization of a pulsed
supersonic beam of 10 % pyridine seeded in He with FEL ( = 58.4 nm). The left half is the raw image, whereas the right half is the slice image obtained by taking the inverse Abel transform. (b) Comparison of the photoelectron spectra extracted from the image obtained using FEL in Fig. 8(a) (dash) with the photoelectron spectrum obtained using He(I) (solid) measured with a 512 512 pixels CCD camera………..123
Figure 5.6 Schematic energy diagram of (a) S2–S1 internal conversion (IC) and (b) S1–T1
intersystem crossing (ISC) in pyrazine………124
Figure 5.7 The setup for pump-probe experiment using a fs UV laser and a VUV free-electron
laser………..125
Figure 5.8 Mass spectrum of pyrazine obtained from: (a) 2-photon ionization by 161-nm
FEL; (b) 2-photon ionization by 260-nm UV laser……….126
Figure 5.9 Ion image of 10% pyrazine seeded in He observed by: (a) FEL radiation; (b) UV
radiation………..127
Figure 5.10 (a) (1+1’) REMPI signal with 260-nm pump and 161-nm probe light. (a) Time
profile of the pyrazine ion signal and least-squares fit of a single exponential decay curve. (b) Observed photoelectron image at the delay time of about 5 ps. A one-color background signal was already subtracted from the image……….128
Figure 5.11 (a) Photoelectron kinetic energy distribution in He(I) photoelectron spectroscopy
of the ground-state pyrazine (black) (ref. 37), 264-nm UV pump and 198-nm DUV probe experiment (red) (ref. 27) and 260-nm UV pump and 161-nm VUV probe (blue) (this work).
xiv
(b) Schematic energy diagram of ionization process. UV absorption spectrum of pyrazine vapor at room temperature and time-spectrum of VUV FEL are shown as insets…………129
Figure 5.12 (a) (1+1’) REMPI with 324-nm pump and 161-nm probe. (a) Time profile of
pyrazine ion signal and least-squares fit of a single exponential decay curve. (b) Photoelectron kinetic energy distribution observed at various time delays. The inset shows the corresponding photoelectron (Abel-inverted) images………..130
xv
List of Tables
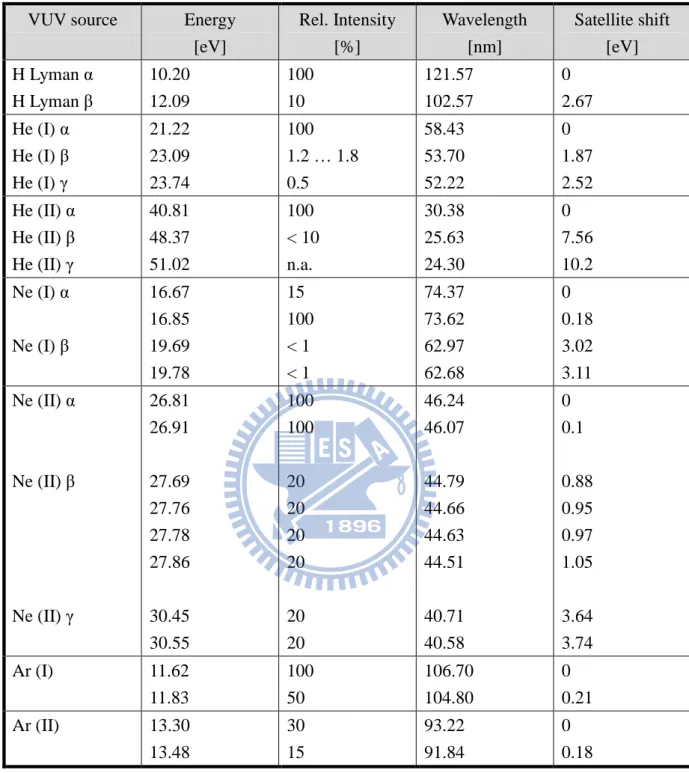
Table 1.1 Lines from discharges in gases other than helium………..15
Table 3.1 Anisotropy parameter β for krypton as obtained in this work in comparison with the
literature values……….………84
Table 3.2 Anisotropy parameter β for argon as obtained in this work in comparison with the
literature values………..84
Table 4.1 Electron binding energy (in eV) and anisotropy parameters () for benzene….….96
1
Chapter 1
Introduction
1.1 Ultraviolet Photoelectron Spectroscopy (UPS)
Photoelectron spectroscopy is based on Einstein's photoelectric effect.1 When the energy of a photon (h) exceeds the binding energy of an electron in a molecule (M), the electron will be ejected.
M + hν → M+ (𝐸
𝑖𝑛𝑡) + 𝑒− (1-1)
in which M+(Eint) is the molecular ion with internal energy Eint which includes the electronic,
vibrational and rotational energy. Since the mass of an electron is less than one thousandth that of the molecule, the electron carries essentially all the recoil kinetic energy between the ion and the electron. Therefore the kinetic energy of the photoelectron (PKE) is given by
PKE = hν − eBEa − 𝐸𝑖𝑛𝑡 (1-2)
where eBEa is the adiabatic electron binding energy. According to Koopmans’ theorem2, the electron binding energy is equal to the orbital energy. Thus, the photoelectron spectrum of a molecule is directly related to the molecular orbital energies within the approximation of the Koopmans’ theorem.
The experimentally observed PKE distribution is called a photoelectron spectrum. For a given photon energy, various PKE are possible, since Eint generally has a distribution. The
shape of each band, so-called the Franck-Condon envelope, provides valuable information to assign each band to a molecular orbital from which ionization occurs.3 Let us take N2
molecule as an example. The photoelectron spectrum of N2 using He(I) radiation (21.22 eV)
2
correspond to the ionization occurs from g, u and u molecular orbitals, respectively, as
shown in Fig. 1.1. These three progressions exhibit vibrational structures with different frequencies. The vibrational frequency represents the strengths of the NN bond in each electronic state of N2+. If a bonding electron is removed, the force constant of the ion becomes
smaller, so that the vibrational frequency decreases. Therefore, the first band in the photoelectron spectrum of N2 corresponds to a removal of nonbonding (weakly bonding)
electron, because the vibrational frequency decreases slightly from 2345 cm-1 in the ground state of N2 to 2150 cm-1. Similarly, the second band corresponds to a removal of bonding
electron, because the vibrational frequency decreases drastically from 2345 to 1810 cm-1, and the third band corresponds to a removal of nonbonding electron (weakly anti-bonding) because the vibrational frequency due to this band increases slightly from 2345 to 2390 cm-1. This criterion of the change in vibrational frequency can be applied to assign the ionized orbitals to nonbonding, bonding, and anti-bonding character, respectively. The Franck-Condon factor is given by,
𝑞𝜐′𝜐" = |∫ 𝜓𝜐′𝜓𝜐"𝑑𝜏|2 (1-3)
which is the square of the overlap integral of vibrational wavefunctions between the neutral ground-state and the ion. In the photoelectron spectrum of nitrogen, the A2u state shows a
long vibrational progression while the X2g+ state and B2u+ state shows intense origin bands.
It implies that the u-1 state has a different equilibrium N-N bond length, while those of the
g-1 and u-1 states are similar to that in the neutral ground state.
The lowest atomic and molecular orbital that can be probed with PES depends on the photon energy, as shown in Fig. 1.2. In general, ultraviolet radiation sources (with photon energy of 10–45 eV) are used to ionize electrons from the valence molecular orbitals that mainly constitute the chemical bonds, while X-ray sources (with photon energy of 200–2000 eV) are used for probing core electrons that are characteristic of the element, and chemical environment. In this thesis, I discuss ultraviolet photoelectron spectroscopy (UPS).
3
1.2 The Angular Distribution of Photoelectrons
Upon photoionization, the photoelectrons are not emitted equally in all directions, and their angular distributions vary when different ionic states are produced. For one photon ionization with polarized light, the photoelectron angular distribution (PAD) expected for randomly oriented atoms or molecules can be expressed by
𝐼(𝜃) = 4𝜋𝜎 *1 + 𝛽2 (3 cos2𝜃 − 1)+ (1-4)
where is the total cross-section, and is the angle between the direction of the ejected electron and the polarization of the incident light. β is the asymmetry parameter, of which value in photoionization of an atom is given by the Cooper-Zare formula,4
𝛽 = 𝑙(𝑙−1)𝑟𝑙−12 +(𝑙+1)(𝑙+2)𝑟𝑙+12 −6𝑙(𝑙+1)𝑟𝑙+1𝑟𝑙−1cos(𝛿𝑙+1−𝛿𝑙−1)
3(2𝑙+1)[𝑙𝑟𝑙−12 +(𝑙+1)𝑟𝑙+12 ] (1-5)
where l is the orbital angular momentum of the electron before ionization, rl1 are the
transition dipole matrix elements for the l1 components of outgoing photoelectron wavefunctions, and l1 denote the phases of these waves. Here β ranges from +2 (cos2
distribution) to -1 (sin2 distribution). For the ionization of an s-type electron from an atom, as in H-, the outgoing electron wave must be a p wave (recall the l = 1 selection rule for an electronic transition in a hydrogen atom). Since l = 0 for an s electron, equation (1-5) yields β = 2. On the other hand, ionization from a p orbital creates both s and d outgoing waves that interfere with each other; therefore, the magnitude of β becomes small.
For unpolarized light, the general expression of PAD can be derived from equation (1-4). Samson and Starace5 showed the expression of PAD for partially polarized light,
𝐼(𝜃) = 𝐼𝑥 𝐼0 𝜎 4𝜋*1 + 𝛽 2(3cos 2𝜃 𝑥− 1)+ +𝐼𝐼𝑦 0 𝜎 4𝜋*1 + 𝛽 2(3cos2𝜃𝑦− 1)+ (1-6)
where (Ix/I0) and (Iy/I0) describe the fraction of light intensity polarized along the x and y axis
(Ix +Iy = I0). The definitions of x, y and z axis are shown in Fig. 1.3. We define the
4
p ≡ 𝐼𝑦−𝐼𝑥
𝐼𝑥+𝐼𝑦 (1-7) By using the geometric relation
𝑐𝑜𝑠2𝜃
𝑥+ 𝑐𝑜𝑠2𝜃𝑦+ 𝑐𝑜𝑠2𝜃𝑧 = 1 (1-8)
the equation (1-6) can be rewritten as 𝐼(𝜃) = 4𝜋𝜎 ,1 −𝛽4[(3cos2𝜃
𝑧− 1) − 3𝑝(cos2𝜃𝑦− cos2𝜃𝑥)]- (1-9)
For unpolarized light, p = 0, then
𝐼(𝜃𝑧) = 4𝜋𝜎 *1 +𝛽2(32𝑠𝑖𝑛2𝜃𝑧− 1)+ (1-10)
Therefore, for unpolarized light, the angle z is measured from the propagation direction,
rather than the polarization direction.
1.3 Conventional Ultraviolet Photoelectron Spectroscopy
Since the pioneering works by Vilesov et al.6 and Tuner et al.7 nearly 50 years ago, ultraviolet photoelectron spectroscopy (UPS) has been playing a central role in experimental studies of the electronic structures of molecules.
The most widely used light source in UPS is a discharge lamp using pure helium, which gives the He(I) resonance line at 58.4 nm (21.22 eV) or the He(II) resonance line at 30.38 nm (40.81 eV). This light source provided an intense and nearly monoenergetic line with high photon energy, allowing ionization from most or all valence orbitals. The gas discharge lamps may be operated with gases other than helium to produce lower photon energies. Some resonance lines are given in Table 1.1. Another useful continuum VUV source for PES is synchrotron radiation that produces a continuum radiation from VUV to X-ray with almost 100 % polarization. The intensity of synchrotron radiation can easily reach 1011 photons per second per Angstrom. However, it is a large-scale facility and is not readily accessible,
5
therefore it cannot be used as conveniently as the discharge lamp in the laboratory.
When a pulsed laser is used in PES, the time-of-flight (TOF) method is advantageous for the analysis of electron kinetic energy owing to its inherent multiplex detection capability of the electrons. Furthermore, magnetic bottle TOF spectrometer developed by Kruit and Read8 improved significantly the collection efficiency in a standard TOF method. They utilized a diverging magnetic field to collect photoelectrons produced in a small photoionization volume and guide the electrons into a flight tube for TOF analysis. With this method a 50 % collection efficiency (acceptance angle 2 sr) of the photoelectrons was achieved. However, the drawback is that this method provides no angular resolution and it cannot be coupled with a continuous light source. In PES with a continuous light source, a hemispherical energy analyzer has been widely used to measure electron energies. This spectrometer consists of two concentric hemispheres of radius R1 (inner hemisphere) and R2 (outer hemisphere), as shown
in Fig. 1.4. Potentials -V1 and -V2 are applied to the inner and outer hemispheres, respectively,
with V2 greater than V1. The potential difference between the hemispheres defines the median
equipotential surface (Vo). The electrons entering through the entrance slit with the kinetic
energy E = eVo will follow the trajectory along this median equipotential surface and will be
focused at the exit slit. When the electrons travel too fast, they will impinge on the outer hemisphere. In contrast, if their kinetic energy is too low, they will be attracted to the inner hemisphere. Thus only electrons of a very narrow energy region will pass through the analyzer to the detector. UPS with a high-performance hemispherical electron energy analyzer and an intense He(I) lamp using the electron cyclotron resonance has achieved a high spectral resolution of 5 meV that is limited mainly by the linewidth of the He(I) radiation.9 For the analysis of photoelectron angular distribution (PAD), the electron signals are measured at different angles by moving either the analyzer or the light beam. The main limitation with a hemispherical analyzer is its poor collection efficiency (< 1 %) of electrons due to its small acceptance solid angle. Therefore, most ultraviolet photoelectron spectra so far have been
6
measured at room temperature.
1.4 Analysis of Unresolved Band
Photoelectron spectrum of polyatomic molecules typically exhibit overlapping bands of which spectral assignments are difficult. One reason for the band overlap is that most polyatomic molecules possess several electronic orbitals that are nearly degenerate in energy. Another reason is that, at room temperature, occurrence of hot bands of low-frequency vibrations made the spectra highly congested. Supersonic beam technique is a useful tool to cool down the gaseous sample and simplify the spectrum. Shirley et al. employed molecular beam photoelectron spectroscopy10 (MBPES) to resolve the vibrational structure of small molecules and applied it to molecules such as ethylene (C2H4),10 carbon disulfide (CS2),11
methyl chloride (CH2Cl2),12 ketene (C2H2O).13 Recently, Oku et al.14 reported He(I) UPS of
jet-cooled pyrazine (C4H4N2) and demonstrated that the spectrum of jet-cooled samples
exhibit much finer structures than those obtained for the vapor at room temperature. So far MBPES has been applied to only a limited number of systems. A major difficulty in MBPES is its low number density (1012–1013 cm-3) of molecules in the ionization region as compared with that in a gas cell (1014–1015 cm-3). Another experimental problem is that the conventional hemispherical energy analyzer employed by UPS has a poor electron collection efficiency. Consequently the signal has to be integrated for hours to achieve satisfactory signal to noise ratio. The pulsed-field-ionization zero-kinetic-energy photoelectron spectroscopy (PFI-ZEKE-PES)15,16 provides another experimental method to observe photoelectron spectra of jet-cooled molecules with high resolution ( 1 cm-1).17,18 In PFI-ZEKE-PES, molecules are not directly ionized, but excited to the high-n (n 150) Rydberg states just below the ionization threshold. A time-delayed pulsed field is then applied to field-ionize the molecules
7
and extract the Rydberg electrons. Figure 1.5 shows the schematic drawings of He(I) UPS and PFI-ZEKE. Therefore, PFI-ZEKE observes the resonances of the photon energy with the rovibronic energies of Rydberg states associated with each cation state.19 It utilizes the fact that a Rydberg state with a high principal quantum number is structurally identical with a cationic state owing to negligible influence on the molecular geometry of the ion core. However, PFI-ZEKE cannot substitute conventional UPS because it encounters difficulties when the Rydberg states rapidly dissociate or autoionize. Oku et al.14 found that the D1 band
is missing in the VUV-PFI-PE measurement of pyrazine, which they ascribed to fast electronic autoionization of high-n Rydberg (ZEKE) states from the D1 ion core to the D0
continuum.
Another method for disentangling overlapping photoelectron bands is measurements of the photoelectron angular distribution (PAD). Carlson and Anderson20 performed He(I) UPS of benzene and found that each photoelectron band exhibits characteristic angular anisotropies (β). They used the β values to analyze the overlapping bands in the spectrum. The measurement of the photon-energy dependence of PAD is even more useful for assignments. Piancastelli et al.21 measured the β parameter of a series of nitrogen-containing aromatic systems as a function of photon energy for using synchrotron radiation (SR) to distinguish the nonbonding n and orbital; The assignment in the azabenzenes have not been straightforward with He(I) UPS at a fixed photon energy. Due to a low collection efficiency of hemispherical energy analyzer, it is time-consuming to observe PAD with conventional photoelectron spectrometers. For example, measurement of the angular distribution (40 to 120 in 10 increments) of 1,5-hexadiene in the full spectrum range (9.0 – 20.0 eV) using a hemispherical energy analyzer required three days.22 Although it is anticipated that PAD can be quantified more easily using SR facility with photon densities higher than a He(I) light source, SR is not readily available in the laboratory. In addition, PES using SR is always performed at moderate resolution in the range of 0.1-0.3 eV, which does not allow for detailed vibrational analysis.
8
This is because the slit width of monochromator for SR is typically wide in order to achieve reasonable signal intensity.
Both MBPES and PAD are clearly useful in analyzing the unresolved bands in photoelectron spectra. However, conventional MBPES and PAD measurement suffer from a poor electron collection efficiency associated with hemispherical energy analyzer. This difficulty may be overcome by applying the photoelectron imaging (PEI) technique.
1.5 Motivation
The photoion imaging developed by Chandler and Houston,23 and improved by Eppink and Parker24 has been extended to photoelectron imaging (PEI). PEI spectrometer provides the ultimate collection efficiency of photoelectrons of 4 steradians and simultaneous measurement of photoelectron kinetic energy distribution (PKED) and photoelectron angular distribution (PAD).25 It allows use of He(I) UPS to measure PAD routinely for analyzing the spectra of jet-cooled molecules, making PEI-He(I) UPS a more powerful spectroscopic method. Compare with a hemispherical energy analyzer, 2D detector using in PEI is expected to provide lower energy resolution. Nevertheless, with ongoing advances in MCP and CCD camera technology, the resolution of PEI has been improved dramatically. Ogi et al.26 reported a super-resolution imaging system that provides 64 megapixel resolution (8192 8192 pixels) and a photoelectron kinetic energy resolution of 0.2 % at 1.696 eV (FWHM: 3.1 meV). One disadvantage of PEI compared with a hemispherical energy analyzer, is its relatively high susceptibility to background photoemission induced by scattered He(I) radiation. Base on a poor characteristic of incoherent He(I) radiation, the PEI apparatus developed for He(I) radiation is certainly applicable to photoelectron spectroscopy with coherent VUV light sources such as a free electron laser and high harmonics produced by
9
ultrashort pulsed lasers.
We also aim at PEI experiments using a vacuum ultraviolet free electron laser (VUV FEL). VUV FEL is an intense ultrashort laser with photon energy of 20.69–24.83 eV (60–50 nm) which is useful for pump–probe photoelectron spectroscopy to observe ultrafast electronic dynamics and the subsequent photochemical reactions involving ground-state products.27 Owing to a lasing wavelength of the FEL at SPring-8 in Japan is 50-60 nm that coincides with the He(I) line (58.4 nm), He(I) PEI experiment also serves as a test for photoelectron imaging using VUV FEL.
1.6 Thesis Outline
As far as I know, PEI experiment combined with He(I) radiation presented in this thesis is the first attempt reported so far. The reminder of this dessertation consists of six chapters. Chapter 2 describes the principle of photoelectron imaging and the data analysis. Chapter 3 discusses the design concept and construction of our He(I)-PEI apparatus. Owing to a poor characteristic of He(I) radiation, various modifications were made to velocity mapping spectrometer. Chapter 4 presents the He(I) photoelectron image of benzene and pyridine in supersonic molecular beams to demonstrate the performance of our He(I)-PEI. Chapter 5 describes photoelectron imaging experiments using FEL including one- and two-photon ionization experiments. The time-resolved PEI of using a femtosecond UV laser and a VUV free-electron-laser with our VMI spectrometer is reported. Ultrafast internal conversion and intersystem crossing in pyrazine in a supersonic molecular beam are discussed. Chapter 6 presents a summary of this dissertation and future directions based on my study.
10
Figure 1.1 The schematic drawing of orbital, photoelectron spectrum and potential energy
11
12
Figure 1.3 Orientation of the photoelectron with respect to the x, y and z axis. The photon h
13
14
Figure 1.5 The schematic drawing of He(I) UPS using He(I) radiation (21.22 eV) and
15
Table 1.1 Lines from discharges in gases other than helium
VUV source Energy [eV] Rel. Intensity [%] Wavelength [nm] Satellite shift [eV] H Lyman α H Lyman β 10.20 12.09 100 10 121.57 102.57 0 2.67 He (I) α He (I) β He (I) γ 21.22 23.09 23.74 100 1.2 … 1.8 0.5 58.43 53.70 52.22 0 1.87 2.52 He (II) α He (II) β He (II) γ 40.81 48.37 51.02 100 < 10 n.a. 30.38 25.63 24.30 0 7.56 10.2 Ne (I) α Ne (I) β 16.67 16.85 19.69 19.78 15 100 < 1 < 1 74.37 73.62 62.97 62.68 0 0.18 3.02 3.11 Ne (II) α Ne (II) β Ne (II) γ 26.81 26.91 27.69 27.76 27.78 27.86 30.45 30.55 100 100 20 20 20 20 20 20 46.24 46.07 44.79 44.66 44.63 44.51 40.71 40.58 0 0.1 0.88 0.95 0.97 1.05 3.64 3.74 Ar (I) 11.62 11.83 100 50 106.70 104.80 0 0.21 Ar (II) 13.30 13.48 30 15 93.22 91.84 0 0.18
16
1.7 References
1
Einstein, A. Ann. Phys. 1905, 17, 549.
2
Koopmans, T. Physica 1933, 1, 104.
3
Eland, J. H. D. Photoelectron Spectroscopy, Butterworth, 1974.
4 Cooper, J.; Zare, R. N. J. Chem. Phys. 1968, 48, 942.
5 Samson, J. A. R.; Starace, A. J. Phys. B, At. Mol. Opt. Phys. 1975, 8, 1806. 6
Vilesov, F. I.; Kurbatov, B. C.; Terrenin, N. Soviet Phys. (Doklady) 1961, 6, 490.
7
Turner, D. W.; Al-Jobory, M. I. J. Chem. Phys. 1962, 37, 3007.
8
Kruit, P.; Read, F. H. J. Phys. E: Sci. Instrum. 1983, 16, 313.
9
Baltzer, P. et al. Rev. Sci. Instrum. 1993, 64, 2179.
10
Pollard, J. E. et al. Rev. Sci. Instrum. 1981, 52, 1837.
11
Wang, L. S.; Reutt, J. E.; Shirley, D. A. J. Electron Spec. Rel. Phen. 1988, 48, 167.
12
Pradeep, T.; Shirley, D. A. J. Electron Spec. Rel. Phen. 1993, 66, 125.
13
Niu, B.; Bai, Y.; Shirley, D. A. J. Chem. Phys. 1993, 99, 2520.
14
Oku, M. et al. J. Phys. Chem. A 2008, 112, 2293.
15
Jarvis, G. K. et al. J. Chem. Phys. 1999, 111, 9568.
16
Merkt, F. et al. J. Phys. B, At. Mol. Opt. Phys. 1998, 21, 1705.
17
Dietrich, H. J.; Muller-Dethlefs, K.; Baranov, L. Y. Phys. Rev. Lett. 1996, 76, 3530.
18
Palm, H.; Merkt, F. Chem. Phys. Lett. 1997, 270, 1.
19
Schlag, E. W. Zeke Spectroscopy: Cambridge niversity Press: Cambridge, 1998.
20
Carlson, T. A.; Anderson, C. P. Chem. Phys. Lett. 1971, 10, 561.
21
Piancastelli, M. N. et al. J. Am. Chem. Soc. 1983, 105, 4235.
22
Douglas, C. et al. Rev. Sci. Instrum. 1977, 48, 926.
23
17
24
Eppink, A. T. J. B.; Parker, D. H. Rev. Sci. Instrum. 1997, 68, 3477.
25 Suzuki, T. Annu. Rev. Phys. Chem. 2006, 57, 555. 26
Ogi, Y. et al. J. Phys. Chem. A 2009, 113, 14536.
27
18
Chapter 2
Experimental Methods
2.1 History of photoion imaging
Photoelectron imaging (PEI) is a variant of photoion imaging that has been developed earlier. In this section, I briefly describe the historical background of photofragment imaging. The photoelectron and photoion imaging are sometimes more generally called charged particle imaging.
The first photofragment ion imaging was performed by Chandler and Houston in 1987 on photodissociation of methyl iodide (CH3I).1 The ion imaging apparatus is essentially the
same as the Wiley-McLaren time-of-flight (TOF) mass spectrometer,2 except that a 2D position-sensitive detector is used instead of an ion detector. The Wiley-McLaren spectrometer employs one flat electrode and two flat grids to create accerelation electric fields along the TOF axis, as shown in Fig. 2.1(a). The flat equipotential surface of the electric fields do not affect the tangential velocities of the charged particles. Therefore the arrival position of an ion with a particular mass on the detector will be proportional to the tangential velocity. However, since the arrival position varies linearly with the initial position in the ionization volume, the observed ion image is always blurred by the finite area of this volume, which limited velocity resolution. The velocity resolution was greatly improved by Eppink and Parker using the velocity map imaging (VMI) technique in 1997.3 VMI uses open annular electrodes instead of grids to create curved equipotential surfaces that acts as an electrostatic lens. Thus, as shown in Fig 2.1(b), the lens focusses the ion trajectories with the same initial velocity to the same arrival position on the detector plane regardless of their initial position in
19
the ionization volume. The speed resolution was enhanced at least by a factor of 10, and diffraction of ions at the grids was eliminated. Wrede et al.4 have modified the electrodes further to minimize chromatic and spherical aberrations in ion trajectories, improving the imaging resolution. In photoion/photoelectron imaging, a camera-based system and a delay line detector are commonly used as 2D position-sensitive detectors. A camera-based system consists of MCP, phosphor screen and CCD (or CMOS) camera, and only the particle arrival positions are recorded. In a delay line detector, finely spaced wires are placed behind the MCP to register both the arrival position and time. The drawback of the delayline detector is that it can handle only up to 4 to 5 hits in a response time of approximately 10 ns. Furthermore, the position (imaging) resolution is inferior to a camera-based system at this point. Considering the count rate and resolution, we use a camera-based system as a detector in the present study.
2.2 Image reconstruction
The recorded images mentioned above are the two-dimensional (2-D) projections of the three-dimensional (3-D) velocity distribution of photoelectron. Figure 2.2 shows the schematic diagram of image analysis. At the detector, the 3-D photoelectron cloud is flattened, resulting in a 2-D projection image. If the initial 3-D distribution has cylindrical symmetry, it can be reconstructed from a 2-D projection image by mathematical methods, such as inverse Abel transformation,5 onion-peeling,6 BASEX7 and p-BASEX8 etc., and the reconstructed 3-D distributions are generally displayed (as in this thesis) by showing the intensity cross section through the center of the initial 3-D electron cloud. In this thesis, only inverse Abel transformation and p-BASEX method are used for data analysis and will be described in the following section.
20
2.2.1 Inversion Abel Transformation
The 3-D velocity distribution of photoelectrons can be expressed in Cartesian coordinate centered on the point of photoionization as i(x, y, z). Take z to be the symmetry axis (i.e. the laser polarization vector), y to be the direction of light propagation, and x to be the direction of an extraction field that accelerates the photoelectrons. Then the measured distribution on the detector as shown in Fig. 2.2(b) can be expressed as
𝑝(y, z) = ∫ 𝑖(𝑥, 𝑦, 𝑧)𝑑𝑥
−∞∞(2-1)
At z = z0, a row of the image, f(y, z0), taken along the y axis can be expressed as
𝑝(y, 𝑧
0) = 𝑓(𝑦) = ∫ 𝑠(𝑥, 𝑦)𝑑𝑥 = 2 ∫ 𝑠(𝑥, 𝑦)𝑑𝑥
−∞∞ 0∞(2-2) where s(x, y) is a slice through the 3-D distribution perpendicular to the symmetry axis (z) taken at z0. Figure 2.3 shows an example of the function f(y) for a slice taken at z = z2. Since
s(x, y) is cylindrically symmetric, equation (2-2) can be expressed in polar coordinates using
r = √(𝑥
2+ 𝑦
2)
𝑓(𝑦) = 2 ∫
𝑠(𝑟)𝑟√𝑟2− 𝑦2
𝑑𝑟
∞
𝑥 (2-3)
This is the Abel transformation, and s(r) will be obtained from the measurement of f(y) by the inverse Abel transform
𝑠(𝑟) =
𝜋1∫
𝑟∞√𝑦𝑑𝑓/𝑑𝑦2−𝑟2𝑑𝑦
(2-4) Utilizing this derivation equation, we can recover the original distribution s(r) from the experimentally measured projection f(y). However, solving equation (2-4) is difficult in practice. In order to remove this difficulty, the most commonly used method for calculating the inverse Abel transform is the Fourier–Hankel method,9 the original distribution s(r) can then be transformed to
𝑠(𝑟) = 2𝜋 ∫ 𝑞𝐽
0∞ 0(2𝜋𝑟𝑞)[∫ 𝑓(𝑥) exp(−2𝜋𝑥𝑞) 𝑑𝑦
−∞∞]𝑑𝑞
(2-5)21
𝐽
0(𝑧) =
12𝜋
∫ exp(−𝑖𝑧𝑐𝑜𝑠𝜗) 𝑑𝜗
2𝜋
0
(2-6)
The drawback of using Fourier-Hankel algorithm to solve the inverse Abel integral is that the noise of the image is magnified and accumulates toward the center line, as shown in Fig. 2.4(b).
2.2.2 BASEX and p-BASEX method
Compare to inverse Abel transformation, BASEX (Basis Set Expansion) method involves simulation and fitting of a set of “basis images” to the experimental images in order to extract the parameters of interest. The experimental projection data are expanded over a set of basis functions that are analytical projections of known well-behaved functions, Gaussian-like function. The original 3-D image is then reconstructed as a linear combination of these well-behaved functions.
As mentioned in the previous section, the projection image onto the (y, z) detector plane can be described by the Abel integral (see Eq. 2-3)
𝑃(𝑦, 𝑧) = 2 ∫
|𝑦|∞√𝑟𝐼(𝑟,𝑧)𝑟2− 𝑦2𝑑𝑟
(2-7) In the imaging experiment, this projection function is binned on the CCD, which has a size of Ny Nz pixels, leading to the digitized projection function P
𝐏
𝑖𝑗= 2 ∫
ℎ
(𝑦 − 𝑦
𝑖, 𝑧 − 𝑧
𝑖)𝑑𝑦𝑑𝑧 ∫
|𝑦|∞√𝑟𝑟𝐼(𝑟,𝑧)2− 𝑦2𝑑𝑟
(2-8) where h(y, z) defines an instrumental function. Now, consider a set of 2D function in the image space {fk(r, z)} (k = 0,…,K-1) and their corresponding projection basis set {Gk}. Theyare related via equation (2-7)
𝐆
𝑘𝑖𝑗= 2 ∫
ℎ
(𝑦 − 𝑦
𝑖, 𝑧 − 𝑧
𝑖)𝑑𝑦𝑑𝑧 ∫
𝑟𝑓𝑘(𝑟,𝑧)√𝑟2− 𝑦2
∞
|𝑦|
𝑑𝑟
(2-9)If both sets (fk(r, z) and Gk) are well-behaved under the Abel trasform, the 3-D velocity
22
the same expansion coefficients (Ck)
𝐼(r, z) = ∑
𝐾−1𝐂
𝑘𝑓
𝑘(𝑟, 𝑧)
𝑘=0 (2-10)
𝐏
𝑖𝑗= ∑
𝐾−1𝐂
𝑘𝐆
𝑘𝑖𝑗𝑘=0 (2-11)
In the matrix form
𝐏 = 𝐂𝐆
(2-12)𝐂 = 𝐆
−1𝐏
(2-13)with the coefficients vector C = (C0,…,CK-1) and the basis transformation matrix G = (G0,…,
GK – 1)T. Noted that the basis set matrix G is inverted by the Tikhonov regularization
method.10 Because the basis set matrix does not depend on the data matrix, they could be computed once and used afterward for the retrieval of the expansion coefficients C by relatively fast matrix multiplication.
Compare to the original BASEX method which uses Cartesian basis set function, the polar modified BASEX (p-BASEX) transform the image from the Cartesian coordinates of the detector to polar coordinates prior to the inversion. This transformed image is then fitted with {r, } basis functions where the angular terms are restricted to just those Legendre polynomial functions. The advantage of operating on the image in {r, } space is that it minimizes the CPU time compare to in Cartesian space, and the noise is accumulated toward a central spot which is usually never used for the data analysis, as shown in Fig. 2.4(c).
2.3 Experimental setup
2.3.1 He(I) discharge lamp
He(I) radiation (21.22 eV) was generated using a commercial discharge lamp11 (Omicron, HIS13), it can couple to a linear polarizer to generate a polarized photon source or a capillary to derive the unpolarized VUV light into the ionization chamber.
23
(A) He(I) with polarizer
Figure 2.5(a) shows the He(I) lamp with a continuously rotatable three-mirror linear polarizer. The polarizer consists of three gold coated mirrors with the special feature of additional focusing via a toroidal mirror,12 the beam diameter is around 1.5 mm at the sample position, the polarization direction can be rotated 360 degree on VUV light path axis by adjusting the rotary drive (see Fig. 2.5), the maximum polarization efficiency is 88 % at the He(I) wavelength of 58.4 nm (21.22 eV). Due to the transmission of the polarizer is 4 %, photon flux was reduced from 1.0 1013 photons/sec to 4.0 1011 photons/sec if the reflectivity of the polarized is perfect. A 6 mm aperture was installed at output of the polarizer to block the external light spot, which is caused by the misalignment inside He(I) lamp.
(B) He(I) without polarizer
Figure 2.5(b) shows the He(I) lamp after removed the polarizer. In this case, 0.8-mm-inner diameter capillary was used to derive the VUV light beam into the ionization chamber and the photon source is unpolarized light. Accordingly to the manual, the beam divergence is estimated to be 0.8, and the beam diameter at the sample position can be estimated by the following equation
Beam dia. = 0.0272 L + (capillary inner dia.) (2-14) where L is the capillary–sample distance. Without the loss of photon flux caused by a reflective polarizer and an aperture in the photon beam, the photon flux is estimated to be 1.3
1012 photons/sec.
2.3.2 Vacuum chamber
The research works reported in this thesis were performed in two different vacuum chambers. In the beginning, the He(I)-PEI was tested with a vacuum chamber that was originally designed for laser spectroscopy of liquid droplets in our laboratory. However, after
24
some experiments, we confirmed that the electrostatic lens should be redesigned but that the size of this vacuum chamber geometrically restricts the modification. Therefore, we decided to use another vacuum chamber, with a larger inner space, designed for photoelectron imaging using a vacuum ultraviolet (VUV) free electron laser. In fact, the present work aimed at development of a PEI spectrometer that can be used with a VUV free electron laser, and this chamber was available for research and development of He(I) PEI for a plenty of time, since the beam time of the VUV laser was highly limited owing to time-sharing by the users. The use of this chamber turned out to be highly successful.
(A) The old vacuum chamber for laser spectroscopy of liquid droplet
As shown in Fig. 2.6, the apparatus consists of four vacuum chambers: a molecular beam source, a buffer, an ionization and a quadrupole chamber. A continuous supersonic jet was generated by expanding a sample gas through a 25-m-diameter orifice at 294 K in the source chamber that was evacuated by two turbo molecular pumps (2 2200 L/sec, BOC Edwards, F2203C). The supersonic jet was skimmed by a conical Al skimmer (2 mm ) in the source chamber, and collimated by the second conical Al skimmer (5 mm ) in the buffer chamber evacuated by a turbo molecular pump (350 L/sec, Leybold, TurboVAC361). The molecular beam thus generated was introduced into an ionization chamber evacuated by a 2650 L/sec turbo molecular pump (BOC Edwards, XA2703C), it travels parallel to the face of the imaging detector and intersected perpendicularly with He(I) radiation at 380 mm downstream from the nozzle. The differential pumping vacuum system provides the inside pressures of 3.1
10-5 Torr, 3.9 10-6 Torr and 3.5 10-8 Torr in the source, buffer and ionization chambers, respectively, during stagnation pressure of 0.9 MPa of Ar is operated.
Figure 2.7(a) shows a cross section of the ionization chamber. The He(I) discharge lamp with a polarizer was used. (see Sec. 2.3.1 A) The electrons generated by the photoionization of atoms or molecules in a beam were accelerated in static electric fields and projected onto a
25
2D position sensitive detector. The acceleration field was created using stacked circular ring electrodes and the field gradient was carefully adjusted to achieve a velocity mapping condition.3 This electrodes stack consist of eight stainless steel rings, which are spaced by 3 mm ruby balls, and connected to each other by 1M resistors, as shown in Fig. 2.7(b). The whole regions of photoionization, acceleration, and flight for photoelectrons were shielded against an external magnetic field with a permalloy tube. After photoionization, the photoelectrons are accelerated perpendicular to both the propagation directions of a molecular beam and the VUV light, and detected by the position sensitive detector, consists of a dual microchannel plate (Hamamatsu F1942-04, 25 m pore size, 25 m pitch length, and 77 mm effective area), a phosphor screen (Hamamatsu P43), and a CCD camera (Hamamatsu i-CCD, 25 Hz, 768 572 pixels). Room light is blocked from the collection zone between phosphor screen and CCD camera.
(B) A new vacuum chamber
Figure 2.8 shows the schematic of the new vacuum chamber. The apparatus consists of two vacuum chambers, a molecular beam source and an ionization chamber. We used a continuous or pulsed molecular beam depending on the experiment. In the former case, a continuous supersonic jet was generated by expanding a sample gas from a 25-m-diameter orifice at 294 K. The jet was skimmed with a 2.0-mm-diameter skimmer and introduced into an ionization chamber, and a molecular beam is travelling parallel to the flight tube axis. The source and ionization chambers were pumped by turbomolecular pumps with pumping rates of 2000 L/s (N2) and 820 L/s (N2), respectively. When Ar was continuously expanded at a
stagnation pressure of 1 atm, the ionization chamber pressure was ca. 7.3 10-8 Torr. The polarizer of He(I) was removed (see Sec. 2.3.1 B), the end of the capillary was located ~125 mm from the ionization point. Consequently, the diameter of the He(I) radiation is estimated to be 4.2 mm at the ionization point by utilizing equation (2-14) and the photon flux is 9.4
26
1010 photons/s/mm2 at 21.22 eV (58.4 nm). Electrons generated by photoionization of a sample were accelerated along the molecular beam propagation axis and projected onto a 2D position-sensitive detector. The details of the electrodes are described later (see. chapter 3). The entire regions of photoionization, acceleration, and flight of the electrons were shielded against external magnetic fields by a permalloy tube. The position-sensitive detector consists of a chevron-type (dual) microchannel plate assembly (Hamamatsu, F1942-04; pore diameter: 25 m; diameter: 77 mm) backed by a phosphor screen (P43) and a CCD camera (Andor, iXonEM DCL897; 512 512 pixels).
In the time-gated experiments, 10–20% sample gases seeded in He were expanded from a pulsed valve (General Valve; orifice diameter: 100 m) with a stagnation pressure of about 0.2–0.55 atm. The front surface of the MCP assembly was maintained at the ground potential and the voltage applied to the rear side was switched between 900 and 1400 V using a high voltage pulser (DEI, GRX-3.0K-H; voltage amplitude: 3.0 kV) to time gate the MCP synchronously with a pulsed gas nozzle. The timing of the trigger pulses for the gas nozzle, MCP, and CCD camera were controlled with a digital delay generator (Stanford Research Systems, DG535)
2.4 Data analysis
2.4.1 Image center calibration
In general, the center of the recorded image is offset in the frame of the camera. Therefore, before the reconstruction of the full 3D distribution, the center of the recorded image must be found. This is first checked by eye or by overlaying a circle on the raw image to determine the center pixel. After an initial center is found, the pixels surrounding this center are also utilized as a center to reconstruct the full 3D distribution. Consequently, the corresponding radial distributions could be obtained from the angle integration of their 2D