Research Article
Applying a Hybrid MCDM Model for Six Sigma Project Selection
Fu-Kwun Wang,
1Chen-Hsoung Hsu,
1and Gwo-Hshiung Tzeng
2,31Department of Industrial Management, National Taiwan University of Science and Technology, Taipei, Taiwan 2Graduate Institute of Urban Planning, College of Public Affairs, National Taipei University, New Taipei, Taiwan 3Institute of Management of Technology, National Chiao Tung University, Hsinchu, Taiwan
Correspondence should be addressed to Fu-Kwun Wang; [email protected]
Received 27 September 2013; Revised 17 November 2013; Accepted 19 November 2013; Published 26 February 2014 Academic Editor: Hao-Chun Lu
Copyright © 2014 Fu-Kwun Wang et al. This is an open access article distributed under the Creative Commons Attribution License, which permits unrestricted use, distribution, and reproduction in any medium, provided the original work is properly cited. Six Sigma is a project-driven methodology; the projects that provide the maximum financial benefits and other impacts to the organization must be prioritized. Project selection (PS) is a type of multiple criteria decision making (MCDM) problem. In this study, we present a hybrid MCDM model combining the decision-making trial and evaluation laboratory (DEMATEL) technique, analytic network process (ANP), and the VIKOR method to evaluate and improve Six Sigma projects for reducing performance gaps in each criterion and dimension. We consider the film printing industry of Taiwan as an empirical case. The results show that our study not only can use the best project selection, but can also be used to analyze the gaps between existing performance values and aspiration levels for improving the gaps in each dimension and criterion based on the influential network relation map.
1. Introduction
Six Sigma is a business strategy that seeks to identify and eliminate the causes of errors or defects, which are defined as any factors that could lead to customer dissatisfaction or failures in business processes, by focusing on outputs that
are critical to customers [1–3]. Six Sigma has been widely
implemented in the manufacturing sector to reduce product costs, improve quality, shorten delivery times, and increase customer satisfaction. Moreover, the Six Sigma movement is also gaining acceptance in healthcare, marketing, engineer-ing, and financial and legal service organizations in addition
to achieving major benefits in the manufacturing sector [4].
Project selection (PS) plays a vital role in the effective
introduction and implementation of Six Sigma [5]. Pande et
al. [6] suggested the following mantra for PS: meaningful and
manageable. However, this then raises the question of how to create a meaningful and manageable PS, which will become the key issue facing the organization when conducting Six Sigma projects. This question is the essential reason for our focus on PS in Six Sigma. Also, PS is a type of multiple-criteria decision-making (MCDM) problem. Banuelas et al.
[7] reported that several approaches including cost-benefit
analysis, cause and effect matrices, Pareto analysis, priority indices, analytic hierarchy process (AHP), the theory of
constraints (TOC), and quality function deployment (QFD) have been applied to the selection of Six Sigma projects by various organizations in the UK. Other methods such
as the Balanced Scorecard method [8], data envelopment
analysis (DEA) [9], a multiobjective model [10], a fuzzy-AHP
with goal programming approach [11], and a hierarchical
criterion evaluation process based on national quality award
criteria [12] were used to select Six Sigma projects. Recently,
B¨uy¨uk¨ozkan and ¨Ozt¨urkcan [13] developed a novel approach
based on decision-making trial and evaluation laboratory (DEMATEL) technique and an analytic network process (ANP) to help logistics companies to identify and prioritize
Six Sigma projects. Perc¸in and Kahraman [14] integrated
three methods including a modified Delphi method, an AHP, and a fuzzy technique for the selection of Six Sigma projects.
Tk´ac¸ and Ly´ocsa [15] proposed a new model based on a real
options approach for evaluating Six Sigma projects, which involves the stochastic nature of project outcomes, costs, and uncertainty regarding payoffs and managerial options.
Vinodh et al. [16] and Boran et al. [17] applied a fuzzy-ANP
method for the selection of agile concept in a
manufactur-ing company. Padhy and Sahu [18] proposed a two-stage
methodology based on (i) real options analysis for evaluating the value of the project to improve the managerial flexibility and (ii) a zero-one integer linear programming model for
Volume 2014, Article ID 730934, 13 pages http://dx.doi.org/10.1155/2014/730934
selecting and scheduling an optimal project portfolio. Saghaei
and Didehkhani [19] applied a fuzzy-weighted additive goal
programming model for the evaluation and selection of Six Sigma projects. Unfortunately, these researches only provide the prioritization of Six Sigma projects. To evaluate the difference among Six Sigma projects is an important task for quality improvement. Thus, a new approach for Six Sigma project selection is needed.
We present a hybrid MCDM model to assess performance not only in ranking and selection, but also in improving and making Six Sigma project strategies for reducing gaps of each dimension/criterion to be perfect, and promote Six Sigma projects for satisfying the user needs to be number one. These processes not only can help Six Sigma project managers to understand users’ wants and needs, but also can assist them with how to improve Six Sigma projects to reduce performance gaps for achieving aspiration level (see the appendix) of user satisfaction by building effective Six Sigma project strategies. An empirical study of film printing industry of Taiwan as an empirical Six Sigma projects case is illustrated to show the hybrid MCDM model for selection and improvement.
The remainder of this paper is organized as follows.
Section 2 presents the PS criteria in Six Sigma. A hybrid
MCDM model is developed inSection 3.Section 4highlights
the managerial implications generated by the case analysis. Finally, we offer a conclusion.
2. Research Problem
A project is defined as a unique set of coordinated activ-ities, with defined starting and finishing points, which is undertaken by an individual or an organization to meet specific performance objectives within a defined schedule
and within defined cost and performance parameters [20].
The objectives of a project must be clear, succinct, achievable, realistic, and measurable, with a high probability of success
[6,21]. Antony and Fergusson [21] described how the project
selection process may begin by creating a simple customer expectations-process matrix that focuses on critical business performance characteristics including quality, cost, delivery, and responsiveness.
Projects must be aligned with a strategic business plan
and with organizational goals. Kendrick and Saaty [8]
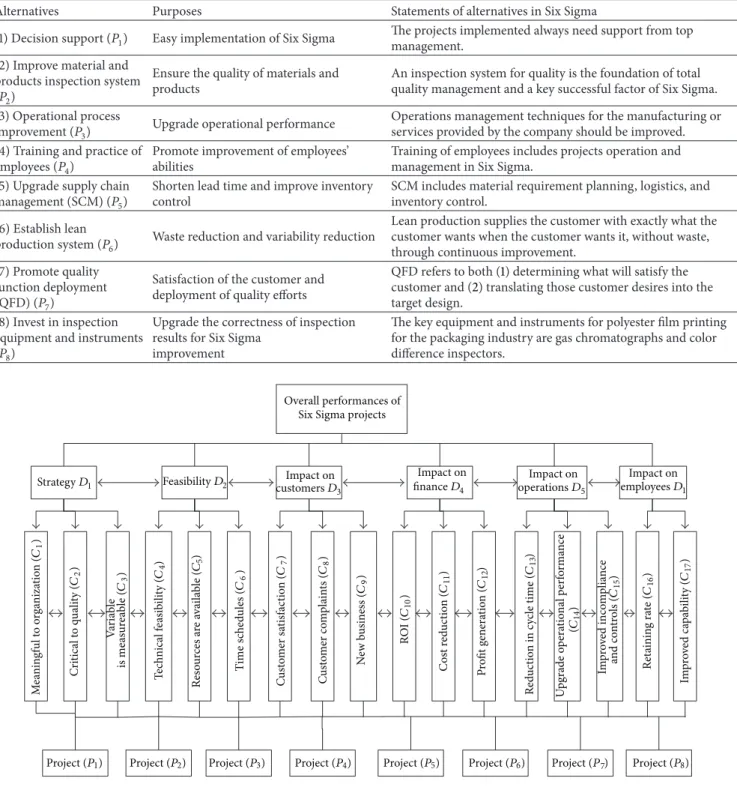
illustrated a set of 17 project alternatives for a manufacturing company, using AHP to determine the priorities of these projects. Project alternatives can be suggested by a bottom-up process, such as by Black or Green Belts, which are familiar with operational problems and flaws, or by a top-down
process, when senior managers raise strategic issues [22].
We modified the AHP developed by Kenderick and Saaty [8]
to establish a framework for project selection that includes the dimensions of feasibility, impact on customers, impact on finance, impact on operations, and impact on employees and that aligns with the strategy of the company. There are four levels of hierarchy, as well as different dimensions and
criteria (seeTable 1andFigure 1).
We consider Corporation J, which has dedicated its efforts since 1993 to the development of soft packaging material
for electronics and food packaging in Taiwan. Corpora-tion J is one of the largest soft packaging material (SPM) manufacturers in Taiwan. The products of Corporation J include polycello and aluminum; in particular, it produces easy-peel top film and heat-sealable aluminum foil for food packaging and antistatic pouches for electronic components packaging. The quality of its products is very important to the food and electronics industries. The SPM manufacturers in Taiwan are promoting Six Sigma activities at this time. PS is the key management action required for the success of
Six Sigma. There are eight alternative projects (seeTable 2)
that could be used to improve the manufacturing processes of Corporation J. We denote the above 6 dimensions, 17 criteria, and 8 alternatives to form a hierarchy for PS in Six Sigma as
shown inFigure 1. In order to avoid “select the best among
inferior projects/alternatives (i.e., pick the best apple among a barrel of rotten apples),” we compared the performance of projects and applied methods to improve the performance of dimensions and criteria in reducing the gaps remaining to achieve the aspiration levels in this study.
To assess the interinfluence of the PS criteria for the DEMATEL technique calculation, we designed a question-naire to collect data from experts in the SPM industry and consultants for Six Sigma. These sixteen knowledge-based experts were the corporation general manager, the plant assistant general manager, the R&D manager, the purchasing manager, the vice plant manager, and the section managers.
3. A Hybrid MCDM Model
A hybrid MCDM model combines the DEMATEL technique
[23] with the basic concept of ANP [24] to find the influential
weights of DANP and the “VIseKriterijumska Optimizacija I Kompromisno Resenje” (VIKOR, which translates as “Multi-criteria Optimization and Compromise Solution”) method
[25] for evaluating the gaps of performance in each criterion
and dimension. The DEMATEL technique was designed to determine the degrees of influential relationship matrix of the PS criteria and apply them to build supermatrix (including the unweighted and weighted supermatrices) in the basic concept of ANP. The ANP handles dependence within a dimension (inner dependence) and among different dimensions (outer dependence). The ANP is a nonlinear structure, whereas the AHP is hierarchical and linear, with
goals at the top and alternatives at lower levels [26]. A hybrid
MCDM model combining DEMATEL with the basic concept of ANP (referred to as DANP) has been widely applied in various fields for finding influential weights, such as inno-vation policy portfolios for Taiwan’s silicon/semiconductor intellectual property mall, airline safety measurements,
e-learning evaluations, and exploring stock selection [27–
33]. Using the VIKOR method to rank and improve
the prioritization of dimensions/criteria can be found in
[34–38].
A hybrid MCDM model contains three main phases (see
Figure 2):(1) constructing the influential network relation
map (INRM) among the criteria by the DEMATEL
Table 1: The influence dimensions and criteria of comprehensive PS in Six Sigma.
Dimensions Influence criteria Statements
Strategy (𝐷1)
Meaningful to organization (𝐶1) The projects should contribute to process improvement within theorganization. Critical to quality (𝐶2) The selected projects should be critical for upgrading the quality ofthe product. Variable is measurable (𝐶3) The response variables in the projects should be easily measurable for
implementation. Feasibility
(𝐷2)
Technical feasibility (𝐶4) Any project in Six Sigma should be technically feasible for theorganization. Resources are available (𝐶5) The resources of the organization should be available to support theproject. Time schedule (𝐶6) Project completion within four to six months should be feasible. Impact on customers
(𝐷3)
Customer satisfaction (𝐶7) The projects for process improvement should be aimed at satisfyingcustomer needs. Customer complaints (𝐶8) The projects should reduce the complaints of the customers andincrease the reliability of the products. New business (𝐶9) The new project should not only consider present customers but also
provide benefits to new customers in the future.
Impact on finance (𝐷4)
ROI (𝐶10)
Many projects in Six Sigma require the investment of equipment or human power to improve the process. The return of investment (ROI) of the project must be considered.
Cost reduction (𝐶11) The project for process improvement should upgrade the quality ofproducts and reduce the cost of manufacturing. Profit generation (𝐶12) The projects selected should increase the generation of profit for theorganization. Impact on operations
(𝐷5)
Reduction in cycle time (𝐶13)
The projects for process improvement should not only improve the quality of products but also reduce the cycle time of relevant processes.
Upgrade operational performance (𝐶14)
The projects should increase the unit time production quantity and upgrade the equipment’s utilization.
Improved in compliance and controls (𝐶15)
The compliance and controls in operational systems should be improved by discussion and communication regarding project selection.
Impact on employees (𝐷6)
Retaining rate (𝐶16)
The retaining rate refers to the rate at which key employees were kept within the organization. The project selection in Six Sigma should support employee retention for the company.
Improved capability (𝐶17) Employees should be educated and trained to improve the capability of manufacturing processes and the performance of the organization.
by using the basic concept of ANP based on the
total-influence matrix by the DEMATEL technique, and(3)
rank-ing and improvrank-ing the prioritization of dimensions/criteria or projects through the VIKOR method for reducing gaps in each criterion and dimension to achieve the aspiration levels.
3.1. Phase I. The three steps of DEMATEL and INRM are summarized as follows.
Step 1. Calculate the direct-influence matrix A by scores. An assessment of the relationship between each criterion of mutual influence is made according to the opinions of knowledge-based experts in Six Sigma and maganers in the printing firms of Taiwan in real situation, using a scale ranging from 0 to 4, with scores represented by natural
language: “absolutely no influence (0),” “low influence (1),”
“medium influence(2),” “high influence (3),” and “very high
influence (4).” The knowledge-based experts are required
to indicate the direct-influence by a pairwise comparision,
and if they believe that criterion𝑖 has an effect/influence on
criterion 𝑗, they should indicate this by 𝑎𝑖𝑗. Thus, average
matrix A = [𝑎𝑖𝑗]𝑛×𝑛 of direct relationships can be obtained
as A = [ [ [ [ [ [ [ [ [ [ 𝑎11 ⋅ ⋅ ⋅ 𝑎1𝑗 ⋅ ⋅ ⋅ 𝑎1𝑛 .. . ... ... 𝑎𝑖1 ⋅ ⋅ ⋅ 𝑎𝑖𝑗 ⋅ ⋅ ⋅ 𝑎𝑖𝑛 .. . ... ... 𝑎𝑛1 ⋅ ⋅ ⋅ 𝑎𝑛𝑗 ⋅ ⋅ ⋅ 𝑎𝑛𝑛 ] ] ] ] ] ] ] ] ] ] . (1)
Table 2: The alternatives of PS in Six Sigma.
Alternatives Purposes Statements of alternatives in Six Sigma
(1) Decision support (𝑃1) Easy implementation of Six Sigma The projects implemented always need support from topmanagement. (2) Improve material and
products inspection system (𝑃2)
Ensure the quality of materials and products
An inspection system for quality is the foundation of total quality management and a key successful factor of Six Sigma. (3) Operational process
improvement (𝑃3) Upgrade operational performance
Operations management techniques for the manufacturing or services provided by the company should be improved. (4) Training and practice of
employees (𝑃4)
Promote improvement of employees’ abilities
Training of employees includes projects operation and management in Six Sigma.
(5) Upgrade supply chain management (SCM) (𝑃5)
Shorten lead time and improve inventory control
SCM includes material requirement planning, logistics, and inventory control.
(6) Establish lean
production system (𝑃6) Waste reduction and variability reduction
Lean production supplies the customer with exactly what the customer wants when the customer wants it, without waste, through continuous improvement.
(7) Promote quality function deployment (QFD) (𝑃7)
Satisfaction of the customer and deployment of quality efforts
QFD refers to both (1) determining what will satisfy the customer and (2) translating those customer desires into the target design.
(8) Invest in inspection equipment and instruments (𝑃8)
Upgrade the correctness of inspection results for Six Sigma
improvement
The key equipment and instruments for polyester film printing for the packaging industry are gas chromatographs and color difference inspectors.
Overall performances of Six Sigma projects
Strategy D1 Feasibility D2 customers DImpact on3 finance DImpact on4 operations DImpact on5 employees DImpact on1
Project (P1) Project (P2) Project (P3) Project (P4) Project (P5) Project (P6) Project (P7) Project (P8)
M ea n in gf ul t o o rga niza tio n ( C1 ) Cri tical t o q u ali ty ( C2 ) Va ri ab le is me asur ea ble ( C3 ) T echnica l f easib il it y ( C4 ) Res o ur ces a re a va ila b le ( C5 ) T ime s che d u les ( C6 ) C u sto m er s at isfac ti o n ( C7 ) C u st o m er co m p la in ts ( C8 ) N ew b u siness ( C9 ) R O I ( C10 ) C o st r ed u ct io n ( C11 ) Profit ge n er at ion ( C12 ) Re d u ct io n in c yc le time ( C13 ) U p gr ade o p era tio na l p er fo rma nce (C 14 ) Im p ro ve d inco m p lia n ce an d co n tr o ls ( C15 ) Ret ainin g ra te ( C16 ) Im p ro ve d ca pa b ili ty ( C17 )
Figure 1: The network of project selection in Six Sigma.
Step 2. Calculate the normalized direct-influence matrix X. The normalized direct-influence matrix X is derived by
X = 𝑧 × A, (2)
where 𝑧 = min𝑖,𝑗{1/max𝑖∑𝑛𝑗=1𝑎𝑖𝑗, 1/max𝑗∑𝑛𝑖=1𝑎𝑖𝑗}, for all
𝑖, 𝑗 = (1, 2, . . . , 𝑛). Its diagonal is zero, and the maximum sum of rows or columns is one.
Step 3. Derive the total-influence matrix T. The continuous decrease in the indirect effects of problems can be determined
using the powers of X, for example, X2, X3, . . . , Xℎ, with
limℎ → 0Xℎ = [0]𝑛×𝑛, where X = [𝑥𝑖𝑗]𝑛×𝑛, 0 ≤ 𝑥𝑖𝑗 < 1,
0 ≤ ∑𝑖𝑥𝑖𝑗 ≤ 1, 0 ≤ ∑𝑗𝑥𝑖𝑗 ≤ 1, and at least one
column or one row of summation, but not every column
Criteria questionnaire
Solve Tand
INRM
Brain storming and Experts opinion
DEMATEL
Solve the influential weights
of DANP
Solve projects ranking, improve and make
strategies VIKOR based on INRM Performance questionnaire Tc TD W DANP limg→∞(W𝛼 W𝛼 )g
Figure 2: The process of a hybrid MCDM model combining DANP and VIKOR.
guaranteed. Thus, the total-influence matrix T is derived by
T = X + X2+ ⋅ ⋅ ⋅ + Xℎ= X(I − X)−1, (3)
where limℎ → 0Xℎ= [0]𝑛×𝑛and I denotes the identity matrix.
The sum of the rows and the sum of the columns of T are expressed separately as vector r and vector s. That is, we have
r = [𝑟𝑖]𝑛×1= [ [ 𝑛 ∑ 𝑗=1 𝑡𝑖𝑗] ]𝑛×1 , s = [𝑠𝑗]𝑛×1= [∑𝑛 𝑖=1 𝑡𝑖𝑗] 1×𝑛 , (4)
where the superscript denotes the transpose. Also,𝑟𝑖shows
the sum of the direct and indirect effects of criteria𝑖 on the
other criteria and𝑠𝑗shows the sum of the direct and indirect
effects that criteria 𝑗 has received from the other criteria.
Furthermore, (𝑟𝑖 + 𝑠𝑖) shows the degree that the criteria 𝑖
plays in the problem, and the difference (𝑟𝑖−𝑠𝑖) shows the net
effect that criteria𝑖 contributes to the problem. If (𝑟𝑖− 𝑠𝑖) is
positive, then criteria𝑖 is affecting other criteria, and if (𝑟𝑖−𝑠𝑖)
is negative, then criteria𝑖 is being influenced by other criteria.
These results are used to generate the INRM. The INRM can provide ideas for improvement.
3.2. Phase II. The five steps of DANP influential weights are described as follows.
Step 1. Find the normalized matrix T𝛼𝑐 by using
dimen-sions. After normalizing the total-influence matrix T𝑐 by
dimensions, we can obtain a new normalized matrix T𝛼𝑐 by
dimensions and is given by
T𝛼𝑐 = 𝐷1 𝐷𝑗 𝐷𝑛 𝑐11 ⋅ ⋅ ⋅ 𝑐1𝑚1 𝑐𝑗1 ⋅ ⋅ ⋅ 𝑐𝑗𝑚𝑗 ⋅ ⋅ ⋅ 𝑐𝑛1 ⋅ ⋅ ⋅ 𝑐𝑛𝑚𝑛 𝐷1 𝑐11 𝑐12 .. . 𝑐1𝑚1 .. . ... 𝐷𝑖 𝑐𝑖1 𝑐𝑖2 .. . 𝑐𝑖𝑚𝑖 .. . ... 𝐷𝑛 𝑐𝑛1 𝑐𝑛2 .. . 𝑐𝑛𝑚𝑛 [ [ [ [ [ [ [ [ [ [ [ [ [ [ [ [ [ [ [ [ [ [ [ [ [ [ [ [ T𝛼11𝑐 ⋅ ⋅ ⋅ T𝛼1𝑗 𝑐 ⋅ ⋅ ⋅ T 𝛼1𝑛 𝑐 .. . ... ... T𝛼𝑖1 𝑐 ⋅ ⋅ ⋅ T 𝛼𝑖𝑗 𝑐 ⋅ ⋅ ⋅ T 𝛼𝑖𝑛 𝑐 .. . ... ... T𝛼𝑛1 𝑐 ⋅ ⋅ ⋅ T 𝛼𝑛𝑗 𝑐 ⋅ ⋅ ⋅ T 𝛼𝑛𝑛 𝑐 ] ] ] ] ] ] ] ] ] ] ] ] ] ] ] ] ] ] ] ] ] ] ] ] ] ] ] ] . (5)
For instance the normalization T𝛼11𝑐 is shown as (5) and
(6).
Consider the following:
𝑑11𝑐𝑖 =∑𝑚1 𝑗=1𝑡 11 𝑐𝑖𝑗, 𝑖 = 1, 2, . . . , 𝑚1, (6) T𝛼11𝑐 = [ [ [ [ [ [ [ [ [ [ [ [ [ [ [ [ [ [ 𝑡𝑐1111 𝑑11 𝑐1 ⋅ ⋅ ⋅ 𝑡11 𝑐1𝑗 𝑑11 𝑐1 ⋅ ⋅ ⋅ 𝑡11 𝑐1𝑚1 𝑑11 𝑐1 .. . ... ... 𝑡11 𝑐𝑖1 𝑑11 𝑐𝑖 ⋅ ⋅ ⋅ 𝑡 11 𝑐𝑖𝑗 𝑑11 𝑐𝑖 ⋅ ⋅ ⋅ 𝑡 11 𝑐𝑖𝑚1 𝑑11 𝑐𝑖 .. . ... ... 𝑡11𝑐𝑚11 𝑑11 𝑐𝑚1 ⋅ ⋅ ⋅ 𝑡 11 𝑐𝑚1𝑗 𝑑11 𝑐𝑚1 ⋅ ⋅ ⋅ 𝑡 11 𝑐𝑚1𝑚1 𝑑11 𝑐𝑚1 ] ] ] ] ] ] ] ] ] ] ] ] ] ] ] ] ] ] = [ [ [ [ [ [ [ [ [ [ 𝑡𝛼11 𝑐11 ⋅ ⋅ ⋅ 𝑡𝛼11𝑐1𝑗 ⋅ ⋅ ⋅ 𝑡𝛼11𝑐1𝑚1 .. . ... ... 𝑡𝛼11 𝑐𝑖1 ⋅ ⋅ ⋅ 𝑡𝛼11𝑐𝑖𝑗 ⋅ ⋅ ⋅ 𝑡𝛼11𝑐𝑖𝑚1 .. . ... ... 𝑡𝑐𝑚𝛼1111 ⋅ ⋅ ⋅ 𝑡𝛼11𝑐𝑚1𝑗 ⋅ ⋅ ⋅ 𝑡𝛼11𝑐𝑚1𝑚1 ] ] ] ] ] ] ] ] ] ] . (7)
Step 2. Find the unweighted supermatrix W. Let the total-influence matrix match and be filled into the interdependence dimensions. It is based on transposing the normalized
influ-ence matrix T𝛼𝑐 by using dimensions, that is, W= (T𝛼𝑐), and
is derived by W = (T𝛼𝑐)= 𝐷1 𝐷𝑖 𝐷𝑛 𝑐11 ⋅ ⋅ ⋅ 𝑐1𝑚1 𝑐𝑖1 ⋅ ⋅ ⋅ 𝑐𝑖𝑚𝑖 ⋅ ⋅ ⋅ 𝑐𝑛1 ⋅ ⋅ ⋅ 𝑐𝑛𝑚𝑛 𝐷1 𝑐11 𝑐12 .. . 𝑐1𝑚1 .. . ... 𝐷𝑗 𝑐𝑗1 𝑐𝑗2 .. . 𝑐𝑗𝑚𝑖 .. . ... 𝐷𝑛 𝑐𝑛1 𝑐𝑛2 .. . 𝑐𝑛𝑚𝑛 [ [ [ [ [ [ [ [ [ [ [ [ [ [ [ [ [ [ [ [ [ [ [ [ W11 ⋅ ⋅ ⋅ W𝑖1 ⋅ ⋅ ⋅ W𝑛1 .. . ... ... W1𝑗 ⋅ ⋅ ⋅ W𝑖𝑗 ⋅ ⋅ ⋅ W𝑛𝑗 .. . ... ... W1𝑛 ⋅ ⋅ ⋅ W𝑖𝑛 ⋅ ⋅ ⋅ W𝑛𝑛 ] ] ] ] ] ] ] ] ] ] ] ] ] ] ] ] ] ] ] ] ] ] ] ] . (8)
Step 3. Obtain the normalized supermatrix T𝛼𝐷 by
dimen-sions. Total-influencematrix T𝐷is obtained by
T𝐷= [ [ [ [ [ [ [ [ [ [ [ [ 𝑡11 𝐷 ⋅ ⋅ ⋅ 𝑡1𝑗𝐷 ⋅ ⋅ ⋅ 𝑡1𝑛𝐷 .. . ... ... 𝑡𝑖1 𝐷 ⋅ ⋅ ⋅ 𝑡𝑖𝑗𝐷 ⋅ ⋅ ⋅ 𝑡𝑖𝑛𝐷 .. . ... ... 𝑡𝑛1 𝐷 ⋅ ⋅ ⋅ 𝑡𝑛𝑗𝐷 ⋅ ⋅ ⋅ 𝑡𝑛𝑛𝐷 ] ] ] ] ] ] ] ] ] ] ] ] . (9)
Each column of total-influence matrix T𝐷 by dimensions
can be summed for normalization. Then we normalize
the total-influence matrix T𝐷 and obtain a new
normal-ized matrix T𝛼𝐷. A new normalized matrix T𝛼𝐷 is derived
by T𝛼𝐷= [ [ [ [ [ [ [ [ [ [ [ [ [ [ [ [ [ [ 𝑡11 𝐷 𝑑1 ⋅ ⋅ ⋅ 𝑡1𝑗𝐷 𝑑1 ⋅ ⋅ ⋅ 𝑡1𝑛 𝐷 𝑑1 .. . ... ... 𝑡𝑖1𝐷 𝑑𝑖 ⋅ ⋅ ⋅ 𝑡𝑖𝑗𝐷 𝑑𝑖 ⋅ ⋅ ⋅ 𝑡𝑖𝑛𝐷 𝑑𝑖 .. . ... ... 𝑡𝑛1 𝐷 𝑑𝑛 ⋅ ⋅ ⋅ 𝑡𝑛𝑗𝐷 𝑑𝑛 ⋅ ⋅ ⋅ 𝑡𝑛𝑛 𝐷 𝑑𝑛 ] ] ] ] ] ] ] ] ] ] ] ] ] ] ] ] ] ]
= [ [ [ [ [ [ [ [ [ 𝑡𝛼11 𝐷 ⋅ ⋅ ⋅ 𝑡𝛼1𝑗𝐷 ⋅ ⋅ ⋅ 𝑡𝛼1𝑛𝐷 .. . ... ... 𝑡𝛼𝑖1𝐷 ⋅ ⋅ ⋅ 𝑡𝛼𝑖𝑗𝐷 ⋅ ⋅ ⋅ 𝑡𝛼𝑖𝑛𝐷 .. . ... ... 𝑡𝛼𝑛1 𝐷 ⋅ ⋅ ⋅ 𝑡𝛼𝑛𝑗𝐷 ⋅ ⋅ ⋅ 𝑡𝛼𝑛𝑛𝐷 ] ] ] ] ] ] ] ] ] , (10) where𝑡𝛼𝑖𝑗𝐷 = 𝑡𝑖𝑗𝐷/𝑑𝑖and𝑑𝑖= ∑𝑛𝑗=1𝑡𝑖𝑗𝐷.
Step 4. Calculate the weighted supermatrix. The weighted
supermatrix W𝛼is derived by W𝛼= T𝛼𝐷W = [ [ [ [ [ [ [ [ [ 𝑡𝛼11 𝐷 × W11 ⋅ ⋅ ⋅ 𝑡𝛼𝑖1𝐷 × W𝑖1 ⋅ ⋅ ⋅ 𝑡𝛼𝑛1𝐷 × W𝑛1 .. . ... ... 𝑡𝛼1𝑗𝐷 × W1𝑗 ⋅ ⋅ ⋅ 𝑡𝛼𝑖𝑗 𝐷 × W𝑖𝑗 ⋅ ⋅ ⋅ 𝑡𝛼𝑛𝑗𝐷 × W𝑛𝑗 .. . ... ... 𝑡𝛼1𝑛𝐷 × W1𝑛 ⋅ ⋅ ⋅ 𝑡𝛼𝑖𝑛𝐷 × W𝑖𝑛 ⋅ ⋅ ⋅ 𝑡𝛼𝑛𝑛𝐷 × W𝑛𝑛 ] ] ] ] ] ] ] ] ] . (11) Step 5. Limit the weighted supermatrix by raising it to a
suf-ficiently large power𝑘, until the supermatrix has converged
and become a long-term stable supermatrix to obtain the global vector weights, called the DANP influential weights,
such that lim𝑔 → ∞(W𝛼)𝑔, where𝑔 represents any number of
powers when𝑔 → ∞.
3.3. Phase III. The development of the VIKOR method began
with the following form of𝐿𝑝metric:
𝐿𝑝𝑘={{ { 𝑛 ∑ 𝑗=1 [ [ 𝑤𝑗(𝑓𝑗∗− 𝑓𝑘𝑗) (𝑓∗ 𝑗 − 𝑓𝑗−) ] ] 𝑝 } } } 1/𝑝 , (12)
where𝑓𝑘𝑗is the performance score of the𝑗th criterion on 𝑘th
alternative,𝑤𝑗 is the influential weight of the𝑗th criterion
from DANP, and𝑛 is the number of criteria and 1 ≤ 𝑝 ≤ ∞
[39]. Two measures𝐿𝑝=1𝑘 (as𝑆𝑘 for minimal average gap or
degree of regret) and𝐿𝑝=∞𝑘 (as𝑄𝑘for priority improvement)
are established as 𝑆𝑘 = 𝐿𝑝=1𝑘 =∑𝑛 𝑗=1 [ [ 𝑤𝑗(𝑓∗ 𝑗 − 𝑓𝑘𝑗) (𝑓∗ 𝑗 − 𝑓𝑗−) ] ] , 𝑄𝑘= 𝐿𝑝=∞𝑘 = max 𝑗 { { { (𝑓𝑗∗− 𝑓𝑘𝑗) (𝑓∗ 𝑗 − 𝑓𝑗−) | 𝑗 = 1, 2, . . . , 𝑛}} } . (13)
The compromise solution min𝑘𝐿𝑝𝑘shows the synthesized
gap to be minimized, which will be selected or improved such that its gap values in each criterion and dimension will be improved for the closest to the aspiration level. Regarding
INRM, the group utility is emphasized when𝑝 is small (such
as𝑝 = 1); in contrast, if 𝑝 grows toward infinity, the
indi-vidual maximal gaps attain greater importance for priority
improvement in each dimension or criterion. Consequently,
min𝑘𝑆𝑘stresses the maximum group utility; however, min𝑘𝑄𝑘
focuses on selecting the minimal value from the maximum individual gaps for priority improvement.
The VIKOR method in this study has four steps.
Step 1. Obtain an aspired/desired and tolerable level. We
calculated the best𝑓𝑗∗ values (the aspiration level) and the
worst𝑓𝑗−values (the tolerable level) of all criterion functions,
𝑗 = 1, 2, . . . , 𝑛. In traditional approach we suppose that the 𝑗th
function denotes benefits:𝑓𝑗∗ = max𝑘𝑓𝑘𝑗and𝑓𝑗− = min𝑘𝑓𝑘𝑗,
but in this research we use the performance scores from 1 to 9
(very poor←1, 2, . . ., 8, 9 → the best) in questionnaires (see
the appendix), so the aspiration level can be set at 9 score and the worst value at 1 score. Therefore, in this research,
we set 𝑓𝑗∗ = 9 as the aspiration level and 𝑓𝑗− = 1 as
the worst value, which differs from traditional approach. This approach can avoid “choose the best among inferior choices/options/alternatives (i.e., avoid pick the best apple among a barrel of rotten apples).” Furthermore, an original rating matrix can be converted into the following matrix:
𝑟𝑘𝑗=(𝑓 ∗ 𝑗 − 𝑓𝑘𝑗) (𝑓∗ 𝑗 − 𝑓𝑗−) . (14)
Step 2. Calculate the mean of group utility and maximal
regret. The values can be computed by𝑆𝑘 = ∑𝑛𝑗=1𝑤𝑗𝑟𝑘𝑗(the
synthesized gap for all of the criteria) and𝑄𝑘 = max𝑗{𝑟𝑘𝑗 |
𝑗 = 1, 2, . . . , 𝑛} (the maximal gap in criterion 𝑘 for priority improvement), respectively.
Step 3. Rank or improve the alternatives for a compromise solution. We order the alternatives from the calculated values, which are obtained as
𝑅𝑘= V (𝑆𝑘− 𝑆∗)
(𝑆−− 𝑆∗) +
(1 − V) (𝑄𝑘− 𝑄∗)
(𝑄−− 𝑄∗) , ∀𝑘 = 1, 2, . . . , 𝑚 ,
(15)
where𝑆∗ = min𝑖𝑆𝑖or𝑆∗ = 0 (when all of the criteria have
been achieved to the aspiration level);𝑆−= max𝑖𝑆𝑖or𝑆− = 1
(in the worst case);𝑄∗ = min𝑖𝑄𝑖or can be set as𝑄∗ = 0;
𝑄− = max𝑖𝑄𝑖or𝑄− = 1; and V is presented as the weight of
the strategy of the maximum group utility. Conversely,1−V is
the weight of individual regret. When𝑆∗= 0, 𝑆−= 1, 𝑄∗ = 0,
and𝑄−= 1, we can rewrite (15) as
𝑅𝑘= V𝑆𝑘+ (1 − V) 𝑄𝑘. (16)
Step 4. Decreasing order of the values of 𝑆𝑘, 𝑄𝑘, and 𝑅𝑘, then, we can use them for a compromise solution for all alternatives.
4. Results and Discussions
The significant confidence of the 16 experts’ group consensus in the questionnaires, the mean of sample gap equals only 1.795%; that is, the significant confidence is obtained as
Table 3: The initial influence matrix A for criteria. Criteria 𝐶1 𝐶2 𝐶3 𝐶4 𝐶5 𝐶6 𝐶7 𝐶8 𝐶9 𝐶10 𝐶11 𝐶12 𝐶13 𝐶14 𝐶15 𝐶16 𝐶17 C1 0.00 3.38 3.00 3.13 3.31 3.06 3.19 3.13 2.94 3.00 3.06 3.06 3.00 3.25 2.56 2.63 2.88 C2 3.25 0.00 3.00 3.19 3.13 3.13 3.56 3.44 2.56 2.81 2.69 3.00 2.69 3.06 2.56 2.50 2.81 C3 2.81 3.06 0.00 2.88 2.81 2.81 2.81 2.56 2.38 2.69 2.69 2.75 2.94 3.00 2.31 2.13 2.19 C4 2.88 3.25 3.19 0.00 3.00 3.06 3.06 2.88 2.75 3.31 2.88 3.25 3.13 3.31 2.44 2.19 2.69 C5 3.00 3.06 2.94 3.19 0.00 3.13 2.88 2.75 2.44 3.06 3.13 3.13 3.00 3.13 2.38 2.69 2.56 C6 2.63 2.88 3.00 3.00 2.88 0.00 3.06 2.75 2.06 2.69 2.94 2.88 3.00 3.06 2.31 2.50 2.50 C7 3.38 3.38 3.00 3.19 3.06 3.06 0.00 3.38 2.81 2.94 2.63 3.06 2.38 2.81 2.69 2.94 2.63 C8 3.31 3.56 2.94 3.13 2.88 2.88 3.44 0.00 2.50 2.63 2.44 2.69 2.38 2.50 2.75 2.81 2.63 C9 3.19 2.56 2.69 3.19 3.13 2.56 3.19 2.56 0.00 3.13 2.63 3.13 2.38 2.63 2.69 2.44 2.69 C10 2.94 3.06 3.19 3.25 3.38 2.81 3.25 2.94 3.00 0.00 3.00 3.25 3.19 3.31 2.56 2.69 2.94 C11 3.00 3.00 3.06 3.19 3.13 3.06 3.19 3.13 2.81 3.00 0.00 3.31 2.75 3.19 2.75 2.56 2.81 C12 3.13 3.25 2.94 3.44 3.38 3.13 3.00 3.00 3.13 3.25 3.44 0.00 3.06 3.25 2.81 3.06 2.81 C13 3.00 2.75 3.13 3.31 3.13 3.31 2.94 2.81 2.63 2.81 3.25 3.19 0.00 2.94 2.75 2.44 2.94 C14 3.13 3.31 3.00 3.25 3.25 3.31 3.25 3.00 2.63 2.94 2.94 3.13 3.31 0.00 2.69 2.94 3.06 C15 2.69 2.88 2.50 2.75 2.69 2.63 2.88 2.81 2.50 2.56 2.50 2.56 2.75 2.81 0.00 3.00 2.75 C16 2.50 2.75 2.50 2.38 2.44 2.13 2.81 2.81 2.25 2.63 2.69 2.63 2.69 2.88 3.00 0.00 2.81 C17 2.88 3.06 2.63 3.06 2.88 2.69 3.13 2.94 2.94 2.88 2.88 3.06 3.31 3.50 2.88 2.69 0.00
Note: the mean of sample gap =(1/𝑛(𝑛 − 1)) ∑𝑛𝑖=1∑𝑛𝑗=1(|𝑎𝑝𝑖𝑗− 𝑎𝑝−1𝑖𝑗 |/𝑎𝑖𝑗𝑝) × 100% = 1.795% < 5%, where 𝑛 is the number of criteria and 𝑝 is the sample of 16
experts.
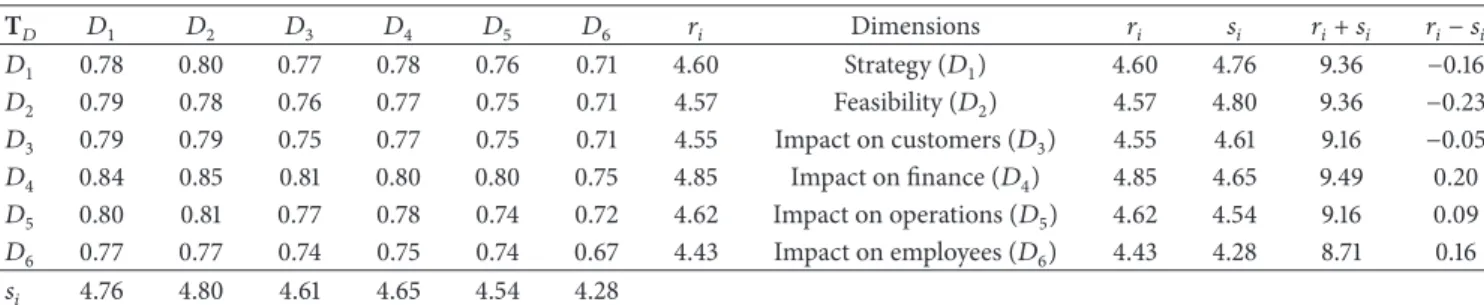
Table 4: The total-influence matrix T𝐷and influence given/received for dimensions.
T𝐷 𝐷1 𝐷2 𝐷3 𝐷4 𝐷5 𝐷6 𝑟𝑖 Dimensions 𝑟𝑖 𝑠𝑖 𝑟𝑖+ 𝑠𝑖 𝑟𝑖− 𝑠𝑖 𝐷1 0.78 0.80 0.77 0.78 0.76 0.71 4.60 Strategy (𝐷1) 4.60 4.76 9.36 −0.16 𝐷2 0.79 0.78 0.76 0.77 0.75 0.71 4.57 Feasibility (𝐷2) 4.57 4.80 9.36 −0.23 𝐷3 0.79 0.79 0.75 0.77 0.75 0.71 4.55 Impact on customers (𝐷3) 4.55 4.61 9.16 −0.05 𝐷4 0.84 0.85 0.81 0.80 0.80 0.75 4.85 Impact on finance (𝐷4) 4.85 4.65 9.49 0.20 𝐷5 0.80 0.81 0.77 0.78 0.74 0.72 4.62 Impact on operations (𝐷5) 4.62 4.54 9.16 0.09 𝐷6 0.77 0.77 0.74 0.75 0.74 0.67 4.43 Impact on employees (𝐷6) 4.43 4.28 8.71 0.16 𝑠𝑖 4.76 4.80 4.61 4.65 4.54 4.28
98.205% which is greater than 95% (see note in Table 3).
There are eight projects that were submitted by the Six Sigma team of Corporation J. Utilizing the aforementioned six dimensions and 17 criteria, we evaluated the performance of each project based on the opinions of sixteen knowledge-based experts and the consultants in SPM manufacturing and the Six Sigma technique. We evaluated performances on a scale of 1 to 9, with 1 indicating very poor performance
(i.e.,𝑓𝑗− = 1 is called the worst value) and 9 indicating the
best performance (i.e.,𝑓𝑗∗ = 9 is called the aspiration level).
Then, we used the average performance scores of each project and applied the VIKOR method to obtain the performances and the gaps to the aspiration levels of the alternative projects.
Using (2) and (3), the normalized direct-influence matrix
and the total-influence of T𝐶and T𝐷can be easily derived.
The INRM was constructed using the vectors r and s fromthe
total direct-influence matrix T𝐷 (seeTable 4). The sum of
influences given and received on criteria is shown inTable 5.
In addition, the INRM maps are shown inFigure 3.
InFigure 3, we found that six dimensions are influenced
by each other such as strategy (𝐷1) will be influenced by
impact on customers (𝐷3), impact on finance (𝐷4), and
impact on operations (𝐷5); feasibility (𝐷2) will be influenced
by strategy (𝐷1), impact on customers (𝐷3), impact on
finance (𝐷4), and impact on employees (𝐷6). These
influen-tial relationships will help the Six Sigma team to perform the decision-making. To increase the feasibility of projects, the first step is to improve their impact on finance. In particular,
the Six Sigma team can first refer to𝐷4inFigure 3to improve
the contribution of ROI (𝐶10) for the project. For the same
reason, the projects need the support of the top management
of strategy (𝐷1), but strategy (𝐷1) depended on the impact
on finance (𝐷4), impact on customers (𝐷3), and impact on
employees (𝐷6). In conclusion, the managers of Six Sigma
can refer to the INRM to prioritize their improvements to the dimensions and criteria in PS.
We used the DANP method to obtain the influential weights and priorities of the dimensions and criteria in the empirical case of Corporation J. The performances and the gaps to the aspiration levels of the alternative projects
are shown inTable 6. We found that the priority in global
weights of the first dimension is feasibility (𝐷2), followed by
0.000 0.200 −0.200 0.400 0.600 0.800 1.000 1.200 23.500 24.000 24.500 25.000 25.500 26.000 D5 D1 D2 D4 D3 D6 ri+ si ri+ si ri+ si ri+ si ri+ si ri −s i ri −s i ri −si ri −s i ri −s i −0.800 −0.600 −0.400 −0.200 0.000 0.200 0.400 0.600 0.800 24.500 25.000 25.500 26.000 26.500 27.000 27.500 (C6) (C4) (C5) (C3) (C2) (C1) (C15) (C13) (C14) (C11) 10) (C12) −0.25 −0.20 −0.15 −0.10 −0.05 Retaining Improved capability rate (C16) (C17) (23.85, −0.07) ri+ si ri+ si ri −si ri −s i (25.749, 1.01) Customer satisfaction New business (C9) (C7) (27.306, −0.6) Customer complain (C8) (26.08, −0.41) (24.691, 0.6) 0.00 0.05 0.10 0.15 0.20 0.25 8.60 8.70 8.80 8.90 9.00 9.10 9.20 9.30 9.40 9.50 9.60 Strategy (D1) (9.401, −0.159) Feasibility (D2) (9.412, −0.223) Impact on consumer (D3) Impact on finance (D4) Impact on process (D5) Impact on employee (D6) (9.198, −0.050) (8.696, 0.144) (9.538, 0.203) (9.504, 0.084) Reduction in cycle time Upgrade operation performance Improved compliance and controls 0.000 0.050 0.100 0.150 0.200 0.250 0.300 0.350 0.400 24.000 24.500 25.000 25.500 26.000 26.500 27.000 27.500 28.000 (26.339, 0.37) (27.535, 0.13) (24.178, 0.31) Technical feasibility Available resources Time schedule −0.800 −0.700 −0.600 −0.500 −0.400 −0.300 −0.200 −0.100 0.000 25.600 25.800 26.000 26.200 26.400 26.600 26.800 27.000 27.200 27.400 (27.306, −0.589) (26.796, −0.53) (25.746, −0.72) ROI (C Cost reduction Revenue generation 0.000 0.100 0.200 0.300 0.400 0.500 0.600 0.700 26.400 26.600 26.800 27.000 27.200 27.400 27.600 27.800 Meaningful to organization Critical to quality Measureable variable −1.200 −1.000 −0.800 −0.600 −0.400 −0.2000.000 0.200 0.400 25.000 25.500 26.000 26.500 27.000 27.500 (26.464, 0.586) (26.835, 0.655) (27.640, 0.527) (27.156, 0.230) (27.246, −0.501) (25.37, −1.043)
Figure 3: The influential network relation maps.
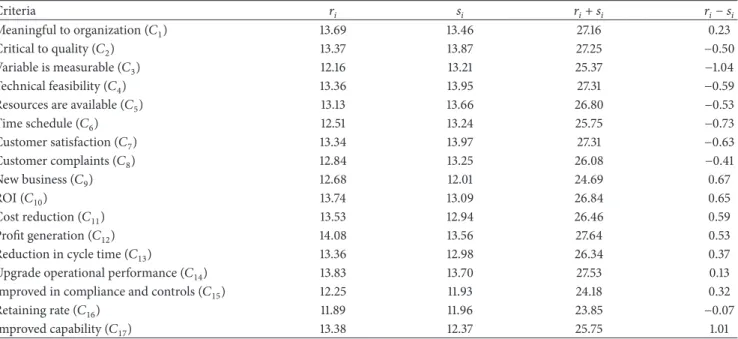
Table 5: The sum of influences given and received on criteria.
Criteria 𝑟𝑖 𝑠𝑖 𝑟𝑖+ 𝑠𝑖 𝑟𝑖− 𝑠𝑖
Meaningful to organization (𝐶1) 13.69 13.46 27.16 0.23
Critical to quality (𝐶2) 13.37 13.87 27.25 −0.50
Variable is measurable (𝐶3) 12.16 13.21 25.37 −1.04
Technical feasibility (𝐶4) 13.36 13.95 27.31 −0.59
Resources are available (𝐶5) 13.13 13.66 26.80 −0.53
Time schedule (𝐶6) 12.51 13.24 25.75 −0.73 Customer satisfaction (𝐶7) 13.34 13.97 27.31 −0.63 Customer complaints (𝐶8) 12.84 13.25 26.08 −0.41 New business (𝐶9) 12.68 12.01 24.69 0.67 ROI (𝐶10) 13.74 13.09 26.84 0.65 Cost reduction (𝐶11) 13.53 12.94 26.46 0.59 Profit generation (𝐶12) 14.08 13.56 27.64 0.53
Reduction in cycle time (𝐶13) 13.36 12.98 26.34 0.37
Upgrade operational performance (𝐶14) 13.83 13.70 27.53 0.13
Improved in compliance and controls (𝐶15) 12.25 11.93 24.18 0.32
Retaining rate (𝐶16) 11.89 11.96 23.85 −0.07
Improved capability (𝐶17) 13.38 12.37 25.75 1.01
(𝐷3), impact on operations (𝐷5), and impact on employees
(𝐷6), in that order. In addition, we extended the priority
of the criteria in each dimension from the local weights in
Table 6. For instance, feasibility (𝐷2) is the first priority in dimensions of global weights; when extended to the local
weight dimensions, however, we know that the technical
feasibility (𝐶4) will be the first priority of feasibility (𝐷2). All
of these local and global weights will be helpful in selecting and improving the best alternatives in MCDM problems with the VIKOR method.
T a b le 6 :Th e p er for m an ce an d ga p of d es ire d le ve lof al la lt er n at ive proj ec ts . Loc al we ig h t Glob al we ig h t Pe rf o rm an ce G ap o f d es ir ed le ve l 𝑃1 𝑃2 𝑃3 𝑃4 𝑃5 𝑃6 𝑃7 𝑃8 𝑃1 𝑃2 𝑃3 𝑃4 𝑃5 𝑃6 𝑃7 𝑃8 St ra te gy (D 1 ) 0.17 2 (2 ) 7. 03 1 6.5 49 6.7 94 7.1 92 6.4 62 6.6 48 6.4 37 6.17 5 0.21 9 (1 ) 0.27 2 (2 ) 0.24 5 (1 ) 0.2 01 (6 ) 0.2 82 (4 ) 0.26 1 (4 ) 0.2 85 (2 ) 0.3 14 (3 ) M ea nin gf ul to o rga niza tio n (𝐶1 ) 0.3 32 (2 ) 0.057 7.87 5 5.7 50 6.87 5 7. 12 5 6.5 63 6.6 88 6.2 50 5.7 50 0.12 5 0.3 61 0.2 36 0.208 0.2 71 0.2 57 0.3 0 6 0 .3 61 Cri tical to q u ali ty (𝐶 2 ) 0.3 4 2 (1 ) 0.05 9 7.3 13 7. 31 3 6.87 5 7. 50 0 6.6 25 6.7 50 6.5 0 0 6.8 13 0.188 0.188 0.2 36 0.167 0.26 4 0.2 50 0.2 78 0.2 43 V ar iabl e is me asu rabl e (𝐶 3 ) 0.3 25 (3 ) 0.05 6 5.87 5 6.5 63 6.6 25 6.9 38 6.188 6.5 0 0 6.5 63 5.9 38 0.3 47 0.2 71 0.26 4 0.229 0.3 13 0.2 78 0.2 71 0.3 4 0 Fe as ib ili ty (D 2 ) 0.17 3 (1 ) 6.4 67 6.3 82 6.7 09 6.9 59 6.47 3 6.7 04 6.421 6.21 2 0.2 81 (3 ) 0.291 (3) 0.2 55 (2 ) 0.227 (4) 0.2 81 (2 ) 0.2 55 (3 ) 0.2 87 (3 ) 0.3 10 (2 ) T ec hnical fe asib ili ty (𝐶 4 ) 0.3 41 (1 ) 0.05 9 6.7 50 6.9 38 6.8 13 7. 12 5 6.2 50 6.5 0 0 6.6 25 6.3 75 0.2 50 0.229 0.2 43 0.208 0 .3 0 6 0.2 78 0.26 4 0.29 2 Res o ur ces ar e ava il ab le (𝐶5 ) 0.3 34 (2 ) 0.058 6.8 13 6.12 5 6.5 63 6.7 50 6.2 50 6.6 25 6.4 38 6.3 13 0.2 43 0.3 19 0.2 71 0.2 50 0.3 0 6 0.26 4 0.2 85 0.29 9 T ime sc he d u le (𝐶 6 ) 0.3 24 (3 ) 0.05 6 5.8 13 6.0 63 6.7 50 7. 0 0 0 6.9 38 7. 0 0 0 6.188 5.9 38 0.3 54 0.3 26 0.2 50 0.222 0 .229 0.222 0.3 13 0.3 4 0 Im pa ct on cu st om er s( D3 ) 0.16 6 (4 ) 6.27 1 6.6 45 6.3 12 6.7 01 6.4 69 6.2 85 6.6 65 6.6 16 0.3 03 (4 ) 0.26 2 (1 ) 0.299 (4) 0.2 55 (2 ) 0.2 81 (3 ) 0.3 02 (5 ) 0.2 59 (1 ) 0.26 5 (1 ) C u st o m er sa ti sfac ti o n (𝐶7 ) 0.3 56 (1 ) 0.05 9 6.5 63 7. 25 0 6.6 88 7. 188 6.813 6.5 63 7. 0 0 0 6.9 38 0.2 71 0.1 94 0.2 57 0.201 0.2 43 0.2 71 0.222 0 .229 C u st o m er co m p la in ts (𝐶 8 ) 0.3 37 (2 ) 0.05 6 6.4 38 6.87 5 6.3 13 6.9 38 6.2 50 6.2 50 6.6 88 7. 0 63 0.2 85 0.2 36 0.29 9 0.229 0 .3 0 6 0.3 0 6 0.2 57 0.215 Ne w b u si n es s (𝐶9 ) 0.3 0 6 (3 ) 0.05 1 5.7 50 5.6 88 5.87 5 5.87 5 6.3 13 6.0 0 0 6.2 50 5.7 50 0.3 61 0.3 6 8 0.3 47 0.3 47 0.29 9 0.3 33 0.3 0 6 0.3 61 Im pa ct on fin an ce (D 4 ) 0.16 8 (3 ) 6.5 62 6.0 21 6.29 0 6.3 77 6.6 05 6.8 50 5.6 43 5.7 94 0.27 1 (2 ) 0.3 31 (4 ) 0.3 01 (5 ) 0.291 (1) 0.26 6 (1 ) 0.23 9 (2 ) 0.3 73 (6 ) 0.3 56 (5 ) ROI (𝐶10 ) 0.3 30 (2 ) 0.05 6 6.5 0 0 6.7 50 6.0 0 0 6.188 6.6 25 6.3 13 5.6 25 5.9 38 0.2 78 0.2 50 0.3 33 0.3 13 0.26 4 0.29 9 0.3 75 0.3 4 0 Co st re d u ct io n (𝐶 11 ) 0.3 26 (3 ) 0.05 5 6.6 25 5.4 38 6.6 25 6.3 75 6.5 63 7. 50 0 5.87 5 5.5 63 0.26 4 0.3 9 6 0.26 4 0.29 2 0.2 71 0.167 0 .3 47 0.3 82 Re ve n u e genera tio n (𝐶12 ) 0.3 4 2 (1 ) 0.058 6.5 63 5.87 5 6.2 50 6.5 63 6.6 25 6.7 50 5.4 38 5.87 5 0.2 71 0.3 47 0.3 0 6 0.2 71 0.26 4 0.2 50 0.3 9 6 0.3 47 Im pa ct on op er at io ns (D 5 ) 0.16 4 (5 ) 6.15 0 5.8 85 6.42 5 6.9 01 6.22 5 6.9 06 6.0 67 6.159 0.3 17 (5 ) 0.3 46 (5 ) 0.2 86 (3 ) 0.23 3 (3 ) 0.3 08 (5 ) 0.23 3 (1 ) 0.3 25 (4 ) 0.3 16 (4 ) Red u ctio n in cy cle tim e (𝐶13 ) 0.3 36 (2 ) 0.05 5 6.12 5 5.188 6.4 38 6.0 63 5.6 88 6.7 50 5.5 63 6.12 5 0.3 19 0.4 24 0.2 85 0.3 26 0 .3 6 8 0.2 50 0.3 82 0.3 19 Up gr ad e o p er at io n al pe rf o rm an ce (𝐶14 ) 0.3 54 (1 ) 0.058 6.2 50 6.5 0 0 7. 0 0 0 7. 50 0 6.87 5 7. 62 5 6.87 5 6.87 5 0.3 0 6 0.2 78 0.222 0.167 0.2 36 0.15 3 0.2 36 0.2 36 Im p ro ved co m p lia n ce an d co n tr o ls (𝐶15 ) 0.3 0 9 (3 ) 0.05 1 6.0 63 5.9 38 5.7 50 7. 12 5 6.0 63 6.2 50 5.6 88 5.3 75 0.3 26 0.3 4 0 0.3 61 0.208 0.3 26 0.3 0 6 0 .3 6 8 0.4 03 Im pa ct on em pl oy ee (D 6 ) 0.15 4 (6 ) 6.0 04 5.6 00 5.5 68 7. 16 6 5.3 75 6.2 58 5.7 62 5.6 03 0. 333 (6) 0.3 78 (6 ) 0.3 81 (6 ) 0.2 04 (5 ) 0.4 03 (6 ) 0.3 05 (6 ) 0.3 59 (5 ) 0.3 77 (6 ) Ret ainin g ra te (𝐶16 ) 0.4 91 (2 ) 0.07 6 5.7 50 5.2 50 5.2 50 6.5 63 5.3 75 5.7 50 5.0 63 5.0 63 0.3 61 0.41 7 0.41 7 0.2 71 0.4 03 0.3 61 0.4 38 0.4 38 Improv ed ca p abi li ty (𝐶 17 ) 0.5 08 (1 ) 0.079 6.2 50 5.9 38 5.87 5 7. 75 0 5.3 75 6.7 50 6.4 38 6.12 5 0.3 0 6 0.3 4 0 0.3 47 0.13 9 0 .4 03 0.2 50 0.2 85 0.3 19 To ta lp er fo rm an ce 6.423 (3) 6.1 91 (6 ) 6.3 63 (4 ) 6.8 80 (1 ) 6.2 81 (5 ) 6.6 13 (2 ) 6.17 3 (7 ) 6.0 99 (8 ) To ta lg ap 0.2 86 (3 ) 0.3 12 (6 ) 0.29 2 (4 ) 0.23 5 (1 ) 0.3 02 (5 ) 0.26 5 (2 ) 0.3 14 (7 ) 0.3 22 (8 ) N o te :t he n u m b ers in the ( ) d eno tes th e ra n ks o f lo ca lw eig h ts in d imen sio n s and cr it er ia.
In analyzing the empirical case of an SPM manufacturing company using a hybrid MCDM model, we successfully obtained the influential relationship matrix as well as the map of the PS dimensions and criteria in interdependent and feedback problems. We also, compared the perfor-mance of projects and obtained how to improve the per-formance of dimensions and criteria in reducing the gaps remaining to achieve the aspiration levels. We conclude the following.
(1) Based on the DANP method, the global influential weights and local influential weights of the dimensions and criteria can be obtained, and then by combining DANP with the VIKOR method the average scores of the projects from
project 𝑃1 to project 𝑃8, in performance, are 6.423, 6.191,
6.363, 6.880, 6.281, 6.613, 6.173, and 6.099, respectively (see
Table 6). We found that project𝑃4has the best performance
among the eight projects, with a score of 6.88, which means
that the training and practice of employees (𝑃4) are the first
priority for the Six Sigma projects. In accordance with the scores of the projects, the subsequent priorities are the
estab-lishment of a lean production system (𝑃6), decision support
(𝑃1), operational process improvement (𝑃3), the upgrading
of supply chain management (𝑃5), the improvement of the
material/products inspection system (𝑃3), the promotion of
quality function deployment (𝑃7), and the investment in
inspection equipment/instruments (𝑃8).
(2) The traditional PS approach is to rank the project alternatives and then only select the best of the project. Our proposed model can not only use the best project selection but can also analyze which gaps in the dimensions and criteria should be the priorities for improvement. From the
perspec-tive of the VIKOR method, project𝑃4is the first priority of
Six Sigma projects in this SPM case; however the gap of 0.292 in this case should also be reduced to zero (the aspiration level, no gap) questions regarding how to minimize this gap as much as possible. We can propose several improvement strategies and suggestions for the managers of Six Sigma to promote the project’s performance based on the INRM.
For example, inTable 6andFigure 3, the largest gap to the
aspiration level in project𝑃4is 0.291 (impact on finance,𝐷4);
next is 0.255 (impact on customers,𝐷3), then 0.233 (impact
on operations,𝐷5), 0.227 (feasibility,𝐷2), 0.204 (impact on
employees,𝐷6), and 0.201 (strategy, 𝐷1). This information
can assist managers in improving the project performance of Six Sigma to reduce the gaps in question and achieve the aspiration level quickly and directly.
5. Conclusion
PS is one of the most critical and challenging activities faced by companies,and selecting the right project in Six Sigma is a major factor in its early success and long-term acceptance within any organization. Based on the definition of a project, the objectives must be clear, succinct, achievable, realistic, and measurable, with a high probability of success. We developed dimensions and criteria that align with the strategy of a SPM manufacturing company to evaluate and select Six Sigma projects.
We present a hybrid MCDM model combining the influential weights of DANP with the VIKOR method for an empirical case in the SPM industry to integrate each criterion performance into each dimension and overall performance. So a DANP model can overcome the problems of interde-pendence and feedback among dimensions and criteria in the real world. Based on the global and local influential weights of
DANP and combined with VIKOR’s calculation (seeTable 6),
mangers can make decisions which take into account the integration of performances and the improvement of the gaps to the aspiration level of each dimension. In this case study, we not only designated the prioritization of the projects in
the order of training and practice of employees (P4) →
establish lean production system (P6) → decision support
(P1) → operational process improvement (P3) → upgrade
supply chain management (P5) → improve material and
products inspection system (P2) → promote quality
func-tion deployment (P7) and invest in inspecfunc-tion equipment and instrument (P8), but we also determined how to improve the gaps to achieve the aspiration level of performance in each project, from low value to high value.
To reduce the gaps and achieve the aspiration level (zero gaps) in the best or most suitable areas, other methods, such as the dominance-based rough set approach (DRSA) and PROMETHEE III, should be addressed in the future studies. In order to deal with uncertainty or fuzziness in the decision making process, a fuzzy-ANP can be considered in our proposed model.
Appendix
Liou and Tzeng [40] found that the traditional MCDM
ignored some important new concepts and trends (some assumptions limit/defects) for solving actual problems in the real world. First, the traditional model assumes that the criteria are independent and hierarchical in structure; however, criteria are often interdependent in real-world problems; because “Statistics and Economics are unrealistic in the real world,” DEMATEL technique can be used to find the influence matrix and build an INRM for solving this problem. Second, the relative good solution from the existing alternatives is replaced by the aspiration levels. Note: Herbert A. Simon, in his lecture given in Stockholm upon receiving the Nobel Prize in Economics, 1978; the Scottish word “satisficing” (=satisfying) has been revived to denote problem solving and decision making that sets an aspiration level, searches until an alternative is found that is satisfactory by the aspiration level criterion, and selects that alternative
[41]. In this research, if 𝑓𝑗∗ is the aspiration level and𝑓𝑗−
is the worst value, we use the performance scores from
0 to 10 (very dissatisfaction ← 0, 1, 2, . . . , 9, 10 → very
satisfaction) in questionnaires, so the aspiration level can
be set at 10 score (i.e., 𝑓𝑗∗ = 10) and the worst value at
zero score (i.e.,𝑓𝑗− = 0); this approach can avoid “Choose
the best among inferior/choices/alternatives,” that is, avoid “Pick the best apple among a barrel of rotten apples.” Third, the trends have shifted from how to carry out the “ranking” or “selection” of the most preferable alternatives, to how to
“improve” their performances based on INRM, because “we need a systematic approach to problem-solving; instead of addressing the systems of the problem, we need to identify
the sources of the problem [42].” These ideas and concepts can
offer major contributions in this type of research problem.
Conflict of Interests
The authors declare that they have no conflict of interests.
Acknowledgments
The authors gratefully acknowledge assistant editor and two reviewers of this paper who helped clarify and improve this presentation.
References
[1] J. Antony and R. Banuelas, “Key ingredients for the effective implementation of six sigma program,” Measuring Business
Excellence, vol. 6, no. 4, pp. 20–27, 2002.
[2] J. Antony, “Some pros and cons of six sigma: an academic perspective,” The TQM Magazine, vol. 16, no. 4, pp. 303–306, 2004.
[3] R. D. Snee, “Six sigma: the evolution of 100 years of business improvement methodology,” International Journal of Six Sigma
and Competitive Advantage, vol. 1, no. 1, pp. 4–20, 2004.
[4] A. Y. T. Szeto and A. H. C. Tsang, “Antecedents to successful implementation of six sigma,” International Journal of Six Sigma
and Competitive Advantage, vol. 1, no. 3, pp. 307–322, 2005.
[5] Y. H. Kwak and F. T. Anbari, “Benefits, obstacles, and future of six sigma approach,” Technovation, vol. 26, no. 5-6, pp. 708–715, 2006.
[6] P. S. Pande, R. P. Neuman, and R. R. Cavanagh, The Six Sigma
Way, McGraw-Hill, New York, NY, USA, 2000.
[7] R. Banuelas, C. Tennant, I. Tuersley, and S. Tang, “Selection of six sigma projects in the UK,” The TQM Magazine, vol. 18, no. 5, pp. 514–527, 2006.
[8] J. D. Kendrick and D. Saaty, “Use analytic hierarchy process for project selection,” Six Sigma Forum Magazine, vol. 6, no. 4, pp. 22–29, 2007.
[9] U. D. Kumar, H. Saranga, J. E. Ram´ırez-M´arquez, and D. Nowicki, “Six sigma project selection using data envelopment analysis,” The TQM Magazine, vol. 19, no. 5, pp. 419–441, 2007. [10] G. Hu, L. Wang, S. Fetch, and B. Bidanda, “A multi-objective
model for project portfolio selection to implement lean and six sigma concepts,” International Journal of Production Research, vol. 46, no. 23, pp. 6611–6625, 2008.
[11] C. Kahraman and G. B¨uy¨uk¨ozkan, “A combined fuzzy AHP and fuzzy goal programming approach for effective six-sigma project selection,” Journal of Multiple-Valued Logic and Soft
Computing, vol. 14, no. 6, pp. 599–615, 2008.
[12] T. Yang and C.-H. Hsieh, “Six-Sigma project selection using national quality award criteria and Delphi fuzzy multiple crite-ria decision-making method,” Expert Systems with Applications, vol. 36, no. 4, pp. 7594–7603, 2009.
[13] G. B¨uy¨uk¨ozkan and D. ¨Ozt¨urkcan, “An integrated analytic approach for six sigma project selection,” Expert Systems with
Applications, vol. 37, no. 8, pp. 5835–5847, 2010.
[14] S. Perc¸in and C. Kahraman, “An integrated fuzzy multi-criteria decision-making approach for six sigma project selection,”
International Journal of Computational Intelligence Systems, vol.
3, no. 5, pp. 610–621, 2010.
[15] M. Tk´ac¸ and ˇS. Ly´ocsa, “On the evaluation of six sigma projects,”
Quality and Reliability Engineering International, vol. 26, no. 1,
pp. 115–124, 2010.
[16] S. Vinodh, S. G. Gautham, R. Anesh Ramiya, and D. Rajanayagam, “Application of fuzzy analytic network process for agile concept selection in a manufacturing organisation,”
International Journal of Production Research, vol. 48, no. 24, pp.
7243–7264, 2010.
[17] S. Boran, H. R. Yazgan, and K. Goztepe, “A fuzzy ANP-based approach for prioritising projects: a six sigma case study,”
International Journal of Six Sigma and Competitive Advantage,
vol. 6, no. 3, pp. 133–155, 2011.
[18] R. K. Padhy and S. Sahu, “A real option based six sigma project evaluation and selection model,” International Journal of Project
Management, vol. 29, no. 8, pp. 1091–1102, 2011.
[19] A. Saghaei and H. Didehkhani, “Developing an integrated model for the evaluation and selection of six sigma projects based on ANFIS and fuzzy goal programming,” Expert Systems
with Applications, vol. 38, no. 1, pp. 721–728, 2011.
[20] M. Kumar, J. Antony, and B. R. Cho, “Project selection and its impact on the successful deployment of six sigma,” Business
Process Management Journal, vol. 15, no. 5, pp. 669–686, 2009.
[21] J. Antony and C. Fergusson, “Six sigma in the software industry: results from a pilot study,” Managerial Auditing Journal, vol. 19, no. 8, pp. 1025–1032, 2004.
[22] J. Van den Heuvel, R. J. M. M. Does, A. J. J. C. Bogers, and M. Berg, “Implementing six sigma in the Netherlands,” Joint
Commission Journal on Quality and Patient Safety, vol. 32, no.
7, pp. 393–399, 2006.
[23] E. Fontela and A. Gabus, “The DEMATEL observe,” Battelle Institute, Geneva, Switzerland, 1976.
[24] T. L. Saaty, Decision Making with Dependence and Feedback: The
Analytic Network Process, RWS, Pittsburgh, Pa, USA, 1996.
[25] S. Opricovic and G.-H. Tzeng, “Multicriteria planning of post-earthquake sustainable reconstruction,” Computer-Aided Civil
and Infrastructure Engineering, vol. 17, no. 3, pp. 211–220, 2002.
[26] T. L. Saaty, “Rank from comparisons and from ratings in the analytic hierarchy/network processes,” European Journal of
Operational Research, vol. 168, no. 2, pp. 557–570, 2006.
[27] C.-Y. Huang, J. Z. Shyu, and G.-H. Tzeng, “Reconfiguring the innovation policy portfolios for Taiwan’s SIP mall industry,”
Technovation, vol. 27, no. 12, pp. 744–765, 2007.
[28] F. Jin, P. Liu, and X. Zhang, “The evaluation study of human resources based on intuitionistic fuzzy set and TOPSIS method,”
Journal of Information and Computational Science, vol. 4, no. 3,
pp. 1023–1028, 2007.
[29] J. J. H. Liou, G.-H. Tzeng, and H.-C. Chang, “Airline safety measurement using a hybrid model,” Journal of Air Transport
Management, vol. 13, no. 4, pp. 243–249, 2007.
[30] G.-H. Tzeng, C.-H. Chiang, and C.-W. Li, “Evaluating inter-twined effects in e-learning programs: a novel hybrid MCDM model based on factor analysis and DEMATEL,” Expert Systems
with Applications, vol. 32, no. 4, pp. 1028–1044, 2007.
[31] J. J. H. Liou, L. Yen, and G.-H. Tzeng, “Building an effective safety management system for airlines,” Journal of Air Transport
[32] W.-S. Lee, G.-H. Tzeng, J.-L. Guan, K.-T. Chien, and J.-M. Huang, “Combined MCDM techniques for exploring stock selection based on Gordon model,” Expert Systems with
Appli-cations, vol. 36, no. 3, part 2, pp. 6421–6430, 2009.
[33] L. Pei-de, “A novel method for hybrid multiple attribute decision making,” Knowledge-Based Systems, vol. 22, no. 5, pp. 388–391, 2009.
[34] J. J. H. Liou, C.-Y. Tsai, R.-H. Lin, and G.-H. Tzeng, “A mod-ified VIKOR multiple-criteria decision method for improving domestic airlines service quality,” Journal of Air Transport
Management, vol. 17, no. 2, pp. 57–61, 2011.
[35] P. Liu and X. Zhang, “Research on the supplier selection of a supply chain based on entropy weight and improved ELECTRE-III method,” International Journal of Production Research, vol. 49, no. 3, pp. 637–646, 2011.
[36] C.-H. Hsu, F.-K. Wang, and G.-H. Tzeng, “The best vendor selection for conducting the recycled material based on a hybrid MCDM model combining DANP with VIKOR,” Resources,
Conservation and Recycling, vol. 66, no. 1, pp. 95–111, 2012.
[37] C.-H. Liu, G.-H. Tzeng, and M.-H. Lee, “Improving tourism policy implementation—the use of hybrid MCDM models,”
Tourism Management, vol. 33, no. 2, pp. 239–488, 2012.
[38] P. Liu and X. Wu, “A competency evaluation method of human resources managers based on multi-granularity linguis-tic variables and VIKOR method,” Technological and Economic
Development of Economy, vol. 18, no. 4, pp. 696–710, 2012.
[39] S. Opricovic and G.-H. Tzeng, “Compromise solution by MCDM methods: a comparative analysis of VIKOR and TOP-SIS,” European Journal of Operational Research, vol. 156, no. 2, pp. 445–455, 2004.
[40] J. H. Liou and G. H. Tzeng, “Comments on multiple cri-teria decision making (MCDM) methods in economics: an overview,” Technological and Economic Development of
Econ-omy, vol. 18, no. 4, pp. 672–695, 2012.
[41] H. A. Simon, “A behavioral model of rational choice,” The
Quarterly Journal of Economics, vol. 69, no. 1, pp. 99–118, 1955.
[42] J. H. Liou, “New concepts and trends of MCDM for tomorrow— in honor of professor Gwo-Hshiung Tzeng on the occasion of his 70th birthday,” Technological and Economic Development of
Submit your manuscripts at
http://www.hindawi.com
Hindawi Publishing Corporation
http://www.hindawi.com Volume 2014
Mathematics
Journal ofHindawi Publishing Corporation
http://www.hindawi.com Volume 2014
Hindawi Publishing Corporation http://www.hindawi.com
Differential Equations
International Journal of Volume 2014
Applied MathematicsJournal of
Hindawi Publishing Corporation
http://www.hindawi.com Volume 2014
Hindawi Publishing Corporation
http://www.hindawi.com Volume 2014
Hindawi Publishing Corporation
http://www.hindawi.com Volume 2014 Mathematical PhysicsAdvances in
Complex Analysis
Journal ofHindawi Publishing Corporation
http://www.hindawi.com Volume 2014
Optimization
Journal ofHindawi Publishing Corporation
http://www.hindawi.com Volume 2014
Combinatorics
Hindawi Publishing Corporation
http://www.hindawi.com Volume 2014
International Journal of
Hindawi Publishing Corporation
http://www.hindawi.com Volume 2014
Journal of Hindawi Publishing Corporation
http://www.hindawi.com Volume 2014
Function Spaces
Abstract and Applied Analysis Hindawi Publishing Corporation
http://www.hindawi.com Volume 2014 International Journal of Mathematics and Mathematical Sciences
Hindawi Publishing Corporation http://www.hindawi.com Volume 2014
The Scientific
World Journal
Hindawi Publishing Corporation
http://www.hindawi.com Volume 2014
Hindawi Publishing Corporation
http://www.hindawi.com Volume 2014
Discrete Dynamics in Nature and Society Hindawi Publishing Corporation
http://www.hindawi.com Volume 2014 Hindawi Publishing Corporation
http://www.hindawi.com Volume 2014
Discrete Mathematics
Journal ofHindawi Publishing Corporation
http://www.hindawi.com Volume 2014
Hindawi Publishing Corporation
http://www.hindawi.com Volume 2014