國立台灣大學醫學院微生物學研究所 碩士論文
Department and Graduate Institute of Microbiology College of Medicine
National Taiwan University Master Thesis
探討 Mismatch repair 在細胞受到攜有 pks island 的大腸 桿菌感染後引發的癌化現象中所扮演之角色
Study on potential roles of mismatch repair in tumor-promoting propensity of cells infected with
E. coli pks
+廖偉翔
Wei-Hsiang Liao
指導教授: 李財坤 博士 Advisor : Tsai-Kun Li, Ph. D.
中華民國 107 年 7 月
July, 2018
致謝
碩士兩年生涯已近尾聲。我的碩士論文能夠完成並有初步成果全部歸功於 TK lab 的大家。我要謝謝我的指導教授李財坤老師,開朗的個性及領導風格使我在 碩士兩年過得很充實也很開心。老師也提供優渥的研究資源以及研究環境,培養 我們獨立思考、解決問題的能力,而在實驗上也不斷提點我的缺陷並幫助我解決。
同時提供大量國外交流的機會給我們,讓我在碩士的研究生涯中,增添了深刻且 極有幫助的經驗。我也要謝謝我的兩個口試委員倪衍玄醫師及賴逸儒醫師。從進 度報告開始到最終口試,倪老師和賴老師皆提供了我許多研究的建議及實驗上的 盲點,並輔助我完成碩士論文,感謝您們!
此外,感謝 TK lab 的所有成員們。首先感謝彥秀學姊教導我許多實驗技巧,
並時時刻刻關心我的實驗成果,除了實驗之外也會關心我的生活,並在最後進入 撰寫論文階段時親自幫我看研究進度並給予我大量寶貴的經驗。謝謝小 8 學姊在 我這兩年碩士時間給予我生活上及實驗上的幫助,以及分擔假日待在實驗室的苦 悶。謝謝我的同學奕萱一直當開心果,從剛進來很迷惘時一起抱怨到開始研究生 生活互相討論實驗。謝謝乙菘學長、柏谷學長、恬文學姐、Tom 學長、冠伶學姊、
明智學長、筱涵學姐、兆賢學長、承學學長、儼哲、宗儒,感謝這兩年大家的陪 伴與幫助,才能過這兩年精采的碩士生活。
最後,我要謝謝我的爸爸和媽媽,謝謝您們的栽培以及支持我繼續念書,讓我 能全心全意完成我的碩士學位。謝謝我的哥哥和兩個妹妹的關心與支持。感謝這 兩年內認識的朋友以及同學的陪伴!
中文摘要
大腸桿菌是微生物感染中最常見來源之一,同時也是人體腸內菌的一員。近來已
發現某些大腸桿菌大有一大段基因名為pks+-island,帶有此基因的大腸桿菌稱為
E. coli pks+。目前已知,E. coli pks+會造成細胞DNA 斷裂,且細胞若存活下來會
產生基因不穩定(genome instability)及癌化現象 (tumorigenesis)。而動物實驗也發
現E. coli pks+加上腸道發炎的微環境會形成腫瘤。臨床上也發現大腸癌病患腸道
中帶有E. coli pks+的比例較正常人高出2 至 3 倍。大腸癌的發生是藉由一系列的
基因突變而造成的,其中已知參與的基因有APS、K-Ras 及 p53。其中 p53 的突
變 是 屬 於 最 終 一 步 的 突 變 , 並 且 會 使 腺 癌(adenoma) 轉 變 成 惡 性 的 癌 瘤 (carcinoma),由此可知 p53 的正常或突變對於大腸癌化扮演很重要的角色。錯配 修復 (mismatch repair)的功能對於大腸癌進程也有相當的影響。研究顯示,部分 大腸癌患者的細胞帶有錯配修復的缺失,且也發現錯配修復的缺失的大腸癌患者 其腫瘤普遍具有侵略性且更為惡化。目前推論,若癌細胞帶有錯配修復的缺失,
細胞易產生二次突變(secondary mutation),倘若突變發生在抑癌基因(tumor
suppressor gene)或原致癌基因(proto-oncogene),則會使癌細胞更惡劣。在本篇研
究,我們利用多株大腸癌細胞株配合著E. coli pks+以多個面向探討,包括: E. coli
pks+造成的DNA 斷裂、E. coli pks+引發的抑制細胞生長、細胞受到E. coli pks+
感染後DNA 修復的情形及 E. coli pks+引發的癌化現象來探討。此外,我們利用
HCT116 和 HCT116 p53-/-細胞執行上述的實驗,來探討 p53 扮演的角色。另外,
為了研究錯配修復機制,我們利用 HCT116 + chr2 (錯配修復缺失的細胞)及
HCT116 + chr3 (錯配修復正常的細胞) 執行上述的實驗,來探討錯配修復扮演的 角色。目前實驗結果顯示,在HCT116 和 HCT116 p53-/-細胞中,E. coli pks+抑
制生長的能力及腫瘤生成能力皆差不多,我們推論p53 可能沒有參與 E. coli pks+
引發的生物反應; 在 HCT116 + chr2 及 HCT116 + chr3 細胞中,我們發現在彗星 (comet)實驗中,細胞受到 E. coli pks+感染後相較於HCT116 + chr3 細胞,HCT116
+ chr2 產生較多的 DNA 斷裂,且產生的尾距 (tail moment)也較多。 而我們也發 現E. coli pks+對於HCT116 + chr2 產生的腫瘤生成能力比 HCT116 + chr3 還明顯。
綜上所述,我們認為錯配修復對於E. coli pks+ 所引發的腫瘤生成能力扮演一定
的角色,而在未來或許可以多加探討。
ABSTRACT
Escherichia coli is the most common cause of infections and a commensal of normal gut microbiota. In recent years, Scientists found that some E. coli carry a conserved genomic island named “ pks+ island”. This gene clusters allow for producing a putative genotoxin, Colibactin. According to previous researches, a short exposure of cultured mammalian epithelial cells to live E. coli pks+ would induce a transient DNA damage response, following by cell division with incomplete DNA repair. The exposed cells present a significant increase in anchorage-independent soft agar colony formation, indicating that the infection of E. coli pks+ may cuase genomic instability and mutagenic potential, thus favoring tumor progression. In my project, we try to elucidate the molecular pathways associated with the E. coli pks+ infected colon cells. p53 is a tumor suppressor gene, and plays an important role in colon cancer progression. In colon cacner progression, loss of p53 can be seen as the last step from adenoma to carcinoma.
Recently, mismatch repair status is also key factor in cancer development. In colorectal cancer, loss of mismatch repair factor may induce secondary mutation.
If secondary mutation is tumor suprressor gene or proto-oncogene, cancer may develop more tumorigenesis and invasion. In this thesis, we first build up the in vitro infection assay protocol. Next, we try to investigate the influence of E. coli pks+ on colon cancer cells from different aspect: Initial damage, recovery time, cell viability and tumorigenesis. We found that infection of E. coli pks+ increases the protein level of γH2AX and activation of phosphorylated ATM and Chk2, which indicated that E. coli pks+ may cause G2/M phase cell cycle arrest. In the other aspect, we attempt to repeat the results of anchorage-independent soft agar colony formation. According to our data, we found that E. coli pks+ would
suppress cell proliferation in HCT116, HCT116 p53-/-, LoVo, SW480 and HT29 cell line. E. coli pks+ increases colony number in HCT116, HCT116 p53-/- and LoVo cell line but not in SW480 and HT29 cell line in anchorage-independent soft agar assay. To investigate more, we look back the genetic and mutation status of these colon cancer cell line. We found that mismatch repair (MMR) status may have some correlation with E. coli pks+ –increasing colony number. To confirm this hypothesis, we use HCT116 + chr2 (MMR-) and HCT116 + chr3 (MMR+) cell line as model, and perform the experiments described in previous. Western blot was used to check the MMR status and it showed that HCT116 + chr3 cells expressed MLH1 but HCT116 + chr2 cells did not express. In comet assay, we found that E. coli pks+ induced higher damage rate in HCT116 + chr2 cells (MMR-) compare to HCT116 + chr3 cells (MMR+) when cells were recovered 20 and 44 hours. Finally, combining with colony formation and soft agar assay, pks++E. coli may induce more colonies in HCT116 + chr2 cells and less colonies in HCT116 + chr3 cells. Together, mismatch repair may be involved in E. coli pks+-induced tumorigenicity and it shall be further investigated.
CONTENTS
口試委員會審訂書...i
ACKNOWLEDGEMENTS...ii
中文摘要...iii
ABSTRACT...v
CONTENTS...vii
INTRODUCTION...1
1. E. coli pks+...1
1.1 Microbiota...1
1.2 Distribution...1
1.3 Genome and metabolite...2
1.4 E. coli pks+-induced tumorigenicity...3
2. Colorectal cancer (CRC)...3
2.1 Epidemiology...3
2.2 Risk factors...4
2.3 Genetic basis of CRC development...4
2.4 The role of p53 in CRC...5
2.5 Microsatellite instability and mismatch repair status in CRC...6
SPECIFIC AIM...8
MATHERIALS AND METHODS...9
Bacteria strains ...9
Polymerase chain reaction (PCR) ...9
Bacterial growth curve...10
Cell lines...10
In vitro infection assay...11
Western blot analysis...11
Alkaline single cell gel-electrophoresis (Comet) Assay...12
Clonogenic Assay...13
Anchorage-Independent Soft Agar Assay...13
RESULTS...15
1. Prevalence of pks+ island in E. coli (E. coli pks+) in colorectal cancer patient...15
2. To validate the presence of functional E. coli pks+...15
2.1. E. coli pks+ harbor genotoxic gene...15
2.2. E. coli pks+ harbor genotoxic function...16
3. To set up the experimental model for identifying the factors involved in the mutagenic and tumorigenic propensities induced by E. coli pks+...17
3.1. Cell culture system; colon cancer cell lines...17
3.2. Setting up the best bacterial condition for in vitro infection...17
3.3. Signaling pathways activated by E. coli pks+ infection...18
4. Investigation of p53 involvement in E. coli pks+-induced tumorigenesis...19
4.1. The role of p53 in E. coli pks+-induced cell viability...19
4.2. p53 involvement in E. coli pks+-induced tumorigenic activity...19
5. The effects on the tumorigenecity of different colon cancer cell lines exposed to E. coli pks+...20
5.1. 4 colon cancer cell lines genetic status and E. coli pks+-induced cytotoxicity. ...20
5.2. The cell viability of different colon cancer cell line exposed to E. coli pks+... 21 5.3. The soft agar assay of different colon cancer cell line exposed to E. coli
6. Investigation of mismatch repair involvement in E. coli pks+-induced
tumorigenesis...22
6.1. Confirm the characteristics of mismatch repair proficient cell line...22
6.2. The role of mismatch repair in E. coli pks+-induced DNA break...23
6.3. The role of mismatch repair in DNA repair after E. coli pks+ infection...23
6.4. The role of mismatch repair in E. coli pks+-induced cell viability...24
6.5. Mismatch repair involvement in E. coli pks+-induced tumorigenic activity…...24
DISCUSSION...26
TABLE AND FIGURE...31
Table 1: the prevalence of B2 strain E. coli and E. coli pks+ in colorectal cancer...31
Table 2.1: Colorectal cancer cell lines that were used in this thesis...32
Table2.2 Mismatch repair (MMR) related protein status of colorectal cancer cell lines. ...32
Table2.3 Genetic background of colorectal cancer cell line ...33
Figure 1. E. coli pks+ harbor pks-island which can be detected by PCR...34
Figure 2. Bacterial growth curve of E. coli pks- and E. coli pks+...36
Figure 3. E. coli pks+ induces the expression level of γH2AX in HCT116...37
Figure 4. E. coli pks+ induces DNA break and increase the level ofγH2AX thus activates T68 Chk2. ...38
Figure 5. Plating efficiency of HCT116 and HCT116 p53-/- exposed to E. coli pks- or E. coli pks+ ...40
Figure 6. Anchorage-independent growth of HCT116 and HCT116 p53-/- exposed to E. coli pks- or E. coli pks+...43 Figure 7. Plating efficiency of LoVo, SW480 and HT29 exposed to E. coli pks- or E.
coli pks+...45 Figure 8 Anchorage-independent growth of LoVo, SW480 and HT29 exposed to E.
coli pks- or E. coli pks+...48 Figure 9. The expression level of MLH1 in HCT116 + chr2 and HCT116 + chr3 cell line...49 Figure 10. E. coli pks+ did not induce chromosomal DNA break in both HCT116 + chr2 and HCT116 + chr3 cell line exposed bacteria after 4 hours. ...51 Figure 11. E. coli pks+ induces chromosomal DNA break in both HCT116 + chr2 and HCT116 + chr3 cell line exposed bacteria after 20 hours. ...54 Figure 12. E. coli pks+ induces chromosomal DNA break in both HCT116 + chr2 and HCT116 + chr3 cell line exposed bacteria after 44 hours. ...57 Figure 13. Plating efficiency of HCT116 + chr2 and HCT116 + chr3 exposed to E.
coli pks- or E. coli pks+...59 Figure 14. Anchorage-independent growth of HCT116 + chr2 and HCT116 + chr3 exposed to E. coli pks- or E. coli pks+...63 REFERENCE...65
INTRODUCTION
1. E. coli pks+
1.1 Microbiota
Microbiota plays an important role in human health and disease.
Microbiota inhabits the intestinal tract call “gut microbiota.” Gut microbiota generally influence host in beneficial ways by changing gastrointestinal function, immune regulation, secret some factor to protect from pathogens, and contribute to metabolic pathway[1].
E. coli is one of most common gut microbiota, which is composed of four main groups (A, B1, B2, D) by phylogenetic analysis. Phylogenetic category is based on 3 gene (chuA, yjaA and TspE4.C2)[2]. Each of four groups has different type of phenotypic features, causing their ability to exploit different sugars, antibiotic-resistance profiles and growth rate-temperature relationships[3].
Several studies have shown the relation between phylogeny and pathogenicity of E.coli strains. Most commensal strains belong to A and B1 groups, and the virulent extra-intestinal strain belongs mainly to group B2 and, to a lesser extent to group D[4, 5]. In this study, E. coli pks+ belongs to phylogenetic group B2.
1.2 Distribution
According previous studies, the ratio of phylogenetic group B2 E. coli strains isolated from a healthy individual is 30~50%. Among these E. coli strains, E.
coli pks+ is 20~30 % [1, 6, 7]. Interestingly, several studies has shown that, the ratio of E. coli pks+ is up to 40~65% in CRC patients’ gut [6, 8, 9], which may indicates that E. coli pks+ prevalence in CRC patients is higher compared to healthy people.
1.3 Genome and metabolites
As mention, E. coli pks+ belongs to phylogenetic group B2. pks island is a conserved genomic island which is 54kb length. This region encodes polyketide synthases (PKS) and non-ribosomal peptide synthases (NRPS) that, in addition to eight accessory proteins, are required for toxin synthesis [10].
The toxin was considered a secondary metabolite named Colibactin, which is synthesis by PKS and NRPS. Since colibactin was identified in 2006 by Dr.
Oswald and co-workers, it is remain to be isolated. As known, colibactin needs to be cell-cell direct contact rather than secreted to supernatant. A logic might is well accepted that colibactin synthesis and tested is by characterizing the activity of prodrug strategy[11, 12].
1.4 E. coli pks+-induced tumorigenicity
In 2006, first research summarized that E. coli pks+ would cause DNA damage[1]. Same research group published another paper in 2010, and the research reported the gene mutation assay and anchorage-independent soft agar assay of HCT116 exposed to E. coli pks+. The results showed that E. coli pks+ increases gene mutation frequency and the colony number after cell infected with E. coli pks+. Next, the other report was publish in 2012, the finding presented that E. coli pks+ enhanced tumor progression in azoxymethane-treated IL10-/- mice, a model for colitis associated CRC. The effect on tumor progression may proceed combined with inflammation and through induction of cellular senescence by secreting growth factor from neighboring infected cells [7, 13].
2. Colorectal cancer (CRC) 2.1 Epidemiology
According to recent epidemiologic study from Health Promotion Administration, colorectal cancer is the most common diagnostic cancer and the incidence rate of colorectal cancer is highest among all cancer in Taiwan. In 2018, 15,579 individuals were diagnosed with cancer of the colon and rectum and it was estimated that 5,687 patients were died because of colorectal cancer.
In 2017, colorectal cancer was the third leading cause of death among cancers that affect both men and women in Taiwan (from Health Promotion
Administration, Taiwan).
2.2 Risk factors
Several risk factors are associated with the incidence of colorectal cancer.
Age is the factor associated with colorectal cancer. The likelihood of colorectal cancer diagnosis increases after the age of 40, increases progressively from age 40, rising sharply after age 50[14]. Genetic predisposition is another factor which induces somatic mutation in cells. Inherited genetic risk is one of factors.
The major inherited disease is familial adenomatous polyposis (FAP) and it is mediated by mutation of adenomatous polyposis coli (APC) [15].
Environmental factors like, cigarette, alcohol, diet habits and so on, were linked to incidence of colorectal cancer. Recently, gut microbiota was considered to be one of important factor related with colorectal cancer. Streptococcus bovis[16], Enterococcus faecalis[17], and E. coli pks+ were associated with colorectal
cancer.
2.3 Genetic basis of CRC development
Colorectal cancer is thought to be a multistep process on its genetic basis. It
appears to arise as a result of the mutational activation of oncogenes or mutational inactivation of tumor suppressor genes. At least four or five genes are required for the formation of tumor[18].
APC is reported that the initial gene mutation in colorectal cancer
progression, and APC mutation results being unable to control cell proliferation.
APC is proposed to function as “ gatekeeper ” gene, considering as an entry of
epithelial cell into the adenocarcinoma[19].
K-ras is a proto-oncogene which is involved in G protein-mediated signal
transduction and control cell proliferation. Mutated K-ras leads to increase and disregulate cellular proliferation and malignant transformation[20].
p53 functions as a transcriptional factor, control the cell cycle by binding to
certain recognition sequence of some genes, including p21, Bax and Bcl in response to DNA damage[21]. Mutated p53 is proposed to be late events in developments of colorectal tumors. The loss of p53 is considered to be an important determinant of progression from adenoma to malignant carcinoma because dysregulation of apoptosis pathway.
2.4 The role of p53 in CRC
Here, we aimed to focus on the role of p53 in colorectal cancer. As mention in
previous introduction, loss of p53 is thought the late event in transition from adenoma to carcinoma. Furthermore, different mutation types of p53 play a crucial role of determining the biologic behaviors, such as invasive depth, metastatic site and the prognosis patients[22]. In clinical studies, it was observed that patients with mutant p53 in exon 5 had worse outcome for colorectal cancer and inactivating mutation of p53 occurred more frequent in advanced stage tumors and were negatively associated with survival[23]. Besides, several studies show that normal p53 is required for the response of colorectal cancers to 5-fluorouracil-based chemotherapy[24]. In summary, behavior of p53 exhibits an essential and important role in colorectal cancer progression.
2.5 Microsatellite instability and mismatch repair status in CRC
Colorectal cancer is also called a heterogeneous disease that harbors distinct genetic, pathologic and clinical characteristics, and one of most characteristics is microsatellite instability. Approximately 15~17 % of colorectal carcinoma is display high level microsatellite instability[25]. Microsatellite instability exhibits a mutable state of cells and is believed to cause by impaired mismatch repair. Deficient mismatch repair and mutated phenotype can lead to loss-of function of tumor-suppressor gene, as well as causing gain-of function
mutations in some oncogenes[26]. Some genes that may mutated in mismatch repair deficient cell, include that DNA repair related gene, transcriptional regulator, signaling transduction factors, apoptosis related genes and damage signaling. These secondary mutations are thought to drive the oncogenic process[26]. Colorectal cancer patients harbor cancer cell with mismatch repair deficient has been investigate for a long time. Patients usually occur as results of inherited abnormalities, certain phenotypic characteristics, resistant to 5-FU treatment and need specific surgical management with systemic treatment[26].
Thus, microsatellite instability has high correlation with mismatch repair status in colorectal cancer and exhibition of high level microsatellite instability refers to mismatch repair deficient, which is an important and worth to investigate the mechanism deeply.
SPECIFIC AIM
E. coli pks+ can induce DNA break in vitro and in vivo by direct contact, and increase the mutation rate. Besides, several studies show that E. coli pks+ would cause tumorigenesis. Furthermore, E. coli pks+ promote tumor formation and invasion with inflammatory environment. In clinical data, presence of E. coli pks+ in colon has been linked with colorectal cancer. However, there is no clear mechanism or factors that have been investigated in E. coli pks+-induced tumorigenesis.
Colorectal cancer is the highest incidence cancer. There are two factors, p53 and mismatch repair, that have been investigated the high correlation with colon cancer.
p53 is a tumor suppressor gene which plays an important role in colorectal cancer progression. Mutation or depletion of p53 may cause cell proliferation and may not presumably suppress tumor progression in colorectal cancer. Mismatch repair is also a key factor in colorectal cancer. Mutation in mismatch repair gene may cause secondary gene mutation, thus inducing microsatellite instability and malignant cancer.
In this study, we aim to investigate the roles of p53 and mismatch repair in tumor-promoting propensity of cells exposed to E. coli pks+.
MATERIALS AND METHODS
Bacteria strains
E. coli strain DH10B hosting the pBeloBAC11 bearing the pks+-island (E. coli pks+) that produces colibactin. DH10B hosting the pBeloBAC11 vector only (pks- E. coli).
E. coli pks+ was obtain from Dr. Eric Oswald, Head of the Laboratory of bacteriology
at the university hospital of Toulouse, France[1].
For preparing for In Vitro infection assay, bacteria were cultured overnight in LB broth containing chloramphenicol at 37 °C with shaking. The next day, this culture was diluted 1:30 in infection medium (IM), consisting of DMEM (Corning) buffered with 25mM HEPES and supplemented with 5% heat inactivated Fetal bovine serum (FBS; Gibco). This preactivated culture was incubated at 37 °C with shaking until an optical density of 0.6 at 600 nm was obtained. Then the bacteria were added to the cells[27].
Plasmid & Polymerase- chain reaction (PCR)
Plasmid pBeloBAC11 vector only and plasmid pBeloBAC11 bearing the pks+-island were extracted. PCR amplification was carried out bacterial plasmid with standard preparing conditions, and the following primers that target at the left end of pks+-island (L1:5’-AATCAACCCAGCTGCAAATC-3’ and L2:5’-CACCCCCATCAT
TAAAAACG-3’, pks+ L, product size = 1824 bp) and the right end of pks+-islad (R1:5’-AGCCGTATCCTGCTCAAAAC-3’and
R2:5’-TCGGTATGTCCGGTTAAAGC-3’, pks+ R, product size = 1413 bp). The PCR cycling parameters used with the The Applied Biosystems Veriti 96-Well Thermal Cycler (Life Technologies) are as follows: denature at 95℃ for 5 minutes, anneal at 56℃ for 30 seconds and extend at 72℃ for 40 seconds. 36 cycles were programmed.
Bacterial growth curve
Efficiency of plating (EOP) assay was conducted for bacterial growth curve. Bacterial cultures were grown in LB medium until OD600 = 0.5 and 10-fold serial dilution started from 105 cells were done. Therefore, there were six cellular numbers of bacteria that the range was 105 to 1. After dotting the six dilutions on a plate, bacteria were spread on whole the plate.
Cell culture
Human colorectal cancer cell line (HCT116, HCT116 p53-/-, HCT116 + chr2, HCT116 + chr3, SW480, LoVo, HT-29) were cultured with DMEM supplemented with 10% FBS and 1% Penicillin-Streptomycin (P/S; Corning) (Table 2.1). All the colorectal cancer cell line were cultured in the incubator with 37℃ and 5% CO2
concentration.
In vitro infection assay
Cells were incubated with IM containing bacteria. The infection dose was calculated according to a multiplicity of infection (number of bacteria per cell at the onset of infection MOI)[27], After a 4 hours infection at 37 °C in a 5% CO2 atmosphere, cells were washed three to six times with autoclaved PBS and incubated in cell-culture medium supplemented with 200μg/mL gentamicin (Gibco). Cells were kept until continued work.
Western Blot analysis
Western blot was performed as following protocol : Cell was lyse by adding RIPA (150 mM sodium chloride, 1% Tirton X-100, 0.5% sodium deoxycholate, 0.1% SDS, 50mM Tris, pH 8.0) buffer) and vortex. Proteins were isolated by centrifugation (13000 rpm, 10 minutes), collected in supernatant. Proteins were then quantified by ELISA reader (Bio-Rad) at O.D.595. Next, protein were mixed with SDS sample buffer incubated at 100 ℃ for 5 minutes, and denatured proteins were analyzed by SDS-polyacrylamide gel electrophoresis. After electrophoresis, proteins on the gel were transferred to nitrocellulose membrane. Membrane was blocked with 5%
milk/TBS-T for 1 hour at room temperature. The primary antibody was applied for 2 hours at room temperature. The following antibodies were used: rabbit monoclonal anti- γ H2AX antibody (GeneTex, GTX61796); mouse polyclonal anti-GAPDH antibody (GeneTex, GTX627408); rabbit polyclonal anti-MLH1 antibody (GeneTex, GTX101160). Membrane was washed three times for 10 minutes with TBS-T and was incubated with secondary antibodies for 1 hour at room temperature rotating.
Membrane was washed three times for 10 minutes with TBS-T. ECL then was added, and result was detected by UVP® imaging system.
Alkaline single cell gel-electrophoresis (Comet) Assay
Cells were kept with gentamicin for 20 hours and 44 hours after bacterial infection.
Cells were treated 20 µM VP-16 as positive control. After treatment, cell were detached, washed and re-suspended with 200 µl ~ 1000 µl of pre-chilled 1 X PBS. 50 µl of cell suspension were mixed with 100 µl of 1 % pre-warmed low melting point (LMP) agarose gel and layered onto 150 µl 0.7% agarose layer on the slides. The mixture were covered with cover slides and wait 10 minutes for solidification at 4℃.
Then submerge the slide in pre-chilled lysis buffer (2.5 M NaCl, 0.1 M EDTA, 10mM Tris, 1% Triton X-100, pH10.5) for 30 minutes at 4℃. The remove the cover slides, wash the slide by pre-chilled 1 X PBS three times and place the slides in pre-chilled
unwinding buffer (30 mM NaOH, 2 mM EDTA) for 40 minutes at 4 ℃ . Electrophoresis was performed at 25 mA for 25 minutes in unwinding buffer, followed by washing the slides with pre-chilled 1 X PBS. At last ,the slides were stained by SYBR Gold (1:10,000 dilute in PBS) (Invitrogen). The image was take CCD camera (Nikon DS-Ril). The result was analyzed Comet ScoreTM (TriTek Crop.) software.
Clonogenic Assay
After infection, the cells were cultured for 3 days with gentamicin (200µg/ml).
Cells(500) were plated in 6-well plates with DMEM containing gentamicin (200 µg/ml) and incubated at 37℃ in a 5% CO2 incubator for colon formation. After 14 to 20 days, colonies were fixed with 20% (v/v) methanol, 20% (v/v) acetic acid for 10 minutes and stained with 0.04% crystal violet for 2 hours. The number of colonies was visualized and scored.
Anchorage-Independent Soft Agar Assay
After infection, the cells were cultured for 3 days with gentamicin (200µg/ml). Cells (104) were mixed with 2 ml of 0.2% Agar Low EEO (Bionovas)-containing DMEM medium with gentamicin (200µg/ml) and overlaid on a pre-coated layer of 0.6% agar
DMEM (2 ml) in 6-well plates. The gel was allowed to dry for 30 minutes and a top layer of fresh medium with gentamicin (200 µg/ml) was added on top of it. Fresh medium (~2ml) was changed every week to prevent gels from drying out. After 3 weeks, the colonies were stained using 0.04% crystal violet for overnight. The colonies (>50 cells) were counted by using CCD camera (Nikon DS-Ril).
RESULTS
1. I Prevalence of pks++ island in E. coli (E. coli pks+) in colorectal cancer patients As mention in introduction, some studies already showed that prevalence of E. coli pks+ has correlation with colorectal cancer patients. The prevalence of E.
coli pks+ showed in Table1. In a healthy individuals, about 30~50 % E. coli
belongs to phylogenetic group B2 E. coli, which is predominant[28]. Further, the E. coli pks+ prevalence in healthy person would be 20~30 % [1, 6, 7]. Next, we try
to find more researches that investigate colorectal cancer patients and E. coli pks+ prevalence. As shown in Table 1, prevalence of phylogenetic B2 group E. coli is 43.2%, 47.1%, 48.6% and 40.6% in researches. As for prevalence of E. coli pks+, the population is 26%, 47.2%, 55.3%, 67% and 68%[6-9, 15, 29]. From these studies, we may anticipated that the prevalence of E. coli pks+ in colorectal cancer patients was higher 2 to 3 fold than in healthy person.
2. To validate the presence of functional E. coli pks+
2.1 E. coli pks+ harbor genotoxic gene
As described in materials and methods,E. coli pks- harbored only pBeloBAC11 vector. E. coli pks+ harbored pBeloBAC11 vector covering the whole pks+-island, a 54kb genome. First, PCR was used to confirm E. coli pks+
did harbor pks+-island. Detection sites and designed primers were based on previous studies[1], and there were two detected site of pks+-island, pks+ L (1824 bp) and pks+ R (1413 bp).
We purified the bacterial plasmid, and use restriction enzyme to cut then did the PCR. As shown in figure1, lane 1 and lane 2 areE. coli pks-, which has no PCR product as predict. Lane 3 and lane 4 are E. coli pks+, which has two different size PCR products. Compared with DNA marker, we assumed that there are pks+ L (1824 bp) and pks+ R (1413 bp). We thus concluded that E. coli pks+ contains genotoxic genome, pks+-island. (Figure. 1)
2.2 E. coli pks+ harbor genotoxic function
To further confirm whether E. coli pks+ has genotoxic ability, we try to use western blot to check. Previous studies have shown that E. coli pks+ would increase the level of γH2AX [27], which is DNA break signal. Base on the researches, we use in vitro assay and western blot. Western blot results show that after cell infected with E. coli pks+, the expression level ofγH2AX is higher compared to control and cells infected with E. coli pks-. (Figure 3) According the western blot, we insure that E. coli pks+ did have genotoxic function to cause DNA break, following increasing the expression level of γH2AX.
3. To set up the experimental model for identifying the factors involved in the mutagenic and tumorigenic propensities induced by E. coli pks+
3.1 Cell culture system; colon cancer cell lines
In our studies, we use HCT116 cell line as basic model. Most colorectal cancer cell lines have abnormal chromosome number and exhibit chromosomal instability. However, HCT116, as colorectal cancer cell line, is a chromosome stable cell line[30], which is a suitable model for following experiments.
Besides, we also have HCT116 p53-/-, HCT116 + chr2 and HCT116 + chr3 in our lab. With knocking out or overexpressing certain protein, it is simple for us to investigate the involving factors. (Table2.1)
3.2 Setting up the best bacterial condition for in vitro infection
After checking genotoxic ability and determining cell models, we have to find the best bacterial condition for in vitro infection. According researches, it indicated that E. coli pks+ would produce secondary metabolite, like colibactin and other metabolites, and cause genotoxic damage when growing to late-log phase and stationary phase. Besides, previous reports show that O.D.600 = 0.6 is
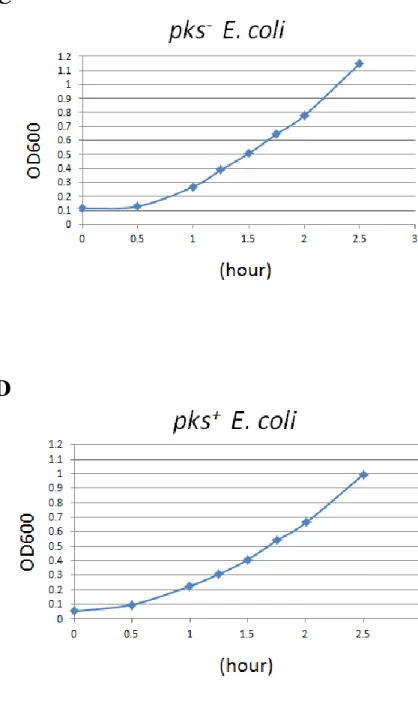
the best condition [27].We did the serial dilution, efficiency of platting and detection bacterial concentration by O.D600. Then we built the bacterial growth curve with time and O.D.600. The figure shows that after growing 1.5 and 2 hours, E. coli pks- and E. coli pks+’sO.D.600 = 0.6 (Figure 2C, 2D). With results of Efficiency of plating, we counted the bacterial number and built growth curve.
According figure, we choose O.D.600 = 0.6, which E. coli pks- and E. coli pks+ is 1.5^108 CFU/ml (Figure 2A, 2B), is the best infection condition for in vitro assay.
3.3 Signaling pathways activated by E. coli pks+ infection
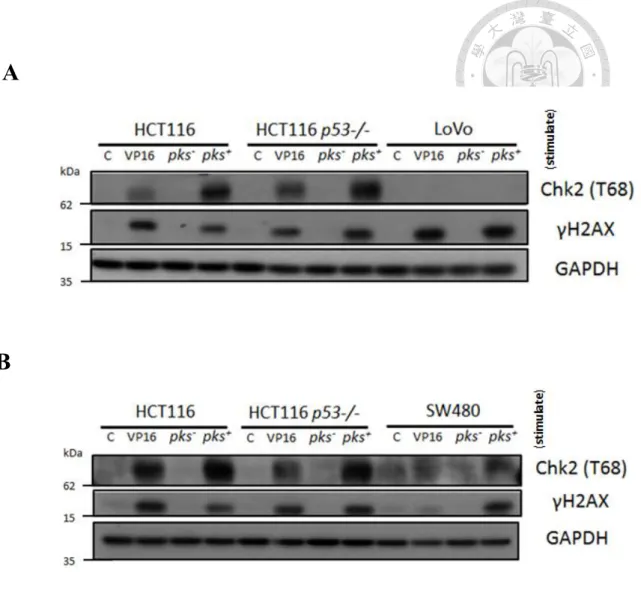
A review study presents that E. coli pks+ would increase γ H2AX expression then induce phosphorylation of ATM and Chk2, following activate G2/M phase cell cycle arrest [10]. Thus, we try to use Western blot to check Chk2 phosphorylation. 40 µM VP16 treatment for 4 hours as positive control, which has been known thatγH2AX induction and Chk2 phosphorylation.
HCT116, HCT116 p53-/-, LoVo and SW480 were exposed to E. coli pks- and E. coli pks+ (MOI: 100) for 4 hours. The result showing in figure 4A, 4B, E.
coli pks+ would induce expression level ofγH2AX in HCT116, HCT116
p53-/-, LoVo and SW480. Besides, E. coli pks+ increases the expression of phosphorylated Chk2 in HCT116, HCT116 p53-/- and SW480 but not in LoVo.
(Figure 4A, 4B)
4. Investigation of p53 involvement in E. coli pks+-induced tumorigenesis
4.1 The role of p53 in E. coli pks+-induced cell viability
Further, we are about whether p53 is involved in cell viability after infection with E. coli pks+. The clonogenic assay shows that E. coli pks- did not affect cell viability (Figure 5A). On the other hand, E. coli pks+ decreased cell growth rate in both HCT116 and HCT116 p53-/-. We counted the colonies and quantified the cell growth rate, and the figure 5 shows that, E. coli pks+ decrease 20% growth in both HCT116 and HCT116 p53-/-. (Figure 5B)
4.2 p53 involvement in E. coli pks+-induced tumorigenic activity
To evaluate E. coli pks+-induced tumorigenic activity, we performed anchorage-independent soft agar assay. From the results, both HCT116 and HCT116 p53-/- without infection would form colonies on soft agar, and the same results for HCT116 and HCT116 p53-/- infected with pks+- and E. coli pks+. (Figure 6A)
We also counted the colonies and quantified. The figure 6B shows that HCT116 infected with pks+ E.coli group has more colonies, and this result is the
same with previous studies (Figure 6B) [27].Next, HCT116 p53-/- control group has more colonies compared to HCT116 control group, which is similar with previous studies from our lab[31].
Furthermore, from the quantified results, we found thatE. coli pks- did not affect the colonies growth in both HCT116 and HCT p53-/- cells on soft agar. As for HCT116 and HCT p53-/- cells infected with E. coli pks+, the colonies numbers is significantly higher compared to control and E. coli pks- group. Hence, we may anticipate that p53 may not be involved tumorigenic activity in HCT116 model.
5. The effects on the tumorigenecity of different colon cancer cell lines exposed to E.
coli pks+
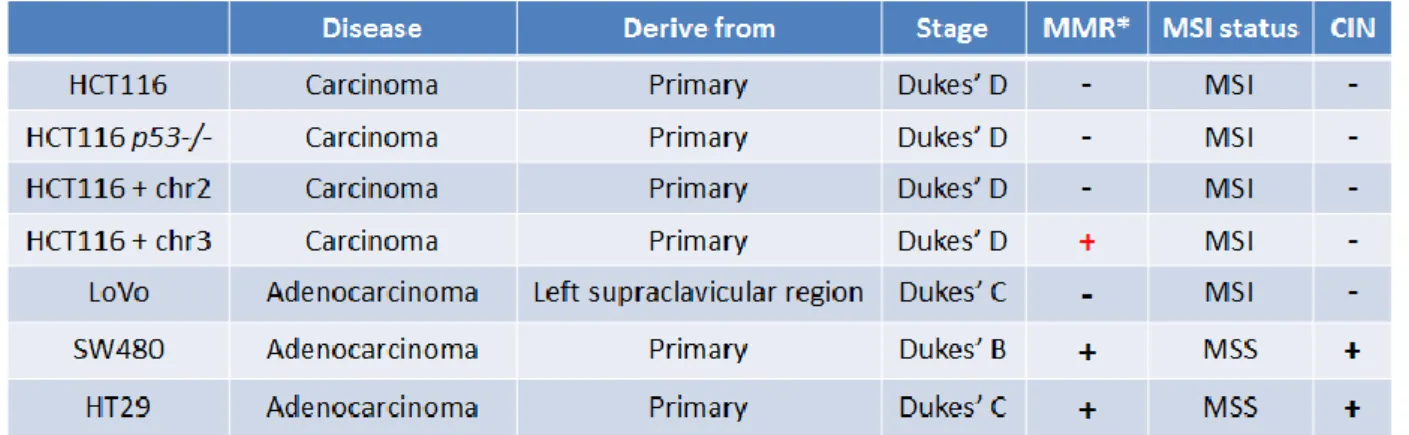
5.1 4 colon cancer cell lines genetic status and E. coli pks+-induced cytotoxicity In addition to HCT116, we also use other colon cancer cell lines (LoVo, HT29 and SW480) to investigate. (Table 2.1) represents the cancer stage, genetic status, mismatch repair and microsatellite status of these four cell lines.
To evaluate the influence of E. coli pks+, these four cell lines (HCT116, LoVo, HT29 and SW480) were infected by E. coli pks+ and performed following experiments.
5.2 The cell viability of different colon cancer cell line exposed to E. coli pks+ First, we use these four cell line (HCT116, LoVo, HT29 and SW480) to investigate cell viability after cell exposed to E. coli pks+.
After bacterial infection and keeping growing for 10 to 14 days, clonogenic results show that E. coli pks- did not inhibit cell growth in HCT116, LoVo, HT29 and SW480. On the other hand, E. coli pks+ would cause lower number of colonies. We counted and quantified the colonies number. The Figure 7A, 7B shows that E. coli pks+ may decrease the cell viability down to 80% in four cell lines. Taken together, our data reveal that E. coli pks+ may inhibit cell growth in colon cancer cell lines. (Figure 7A, 7B)
5.3 The soft agar assay of different colon cancer cell line exposed to E. coli pks+
In support of previous studies that demonstrate the increasing of colony on soft agar after HCT116 exposed to E. coli pks+[27], we hypothesized that it may be the case in other colon cancer cell lines.
We conducted in vitro infection assay on, LoVo, SW480 and HT29 then perform soft agar assay. As shown in Figure 8A, the colonies were formed and observed under microscope no matter in LoVo without infection or infected
with pks- or E. coli pks+. Same results were also observed in SW480 and HT29 under same treatment.
We combined soft agar data with clonogenic assay data together. We used cell viability to normalize soft agar data. The figure 8B showed that LoVo with E. coli pks+ infection had more colonies formation compared to E. coli pks-
infection. As for HT29, cells infected with E. coli pks+ has close colony number compared to without infection or infected with E. coli pks-.(Figure 8C) Surprisingly, we found that SW480 exposed to E. coli pks+ has less colonies formation compared to SW480 without infection or E. coli pks- infection.
(Figure 8D)
6. Investigation of mismatch repair involvement in E. coli pks+-induced tumorigenesis
6.1 Confirm the characteristics of mismatch repair proficient cell line
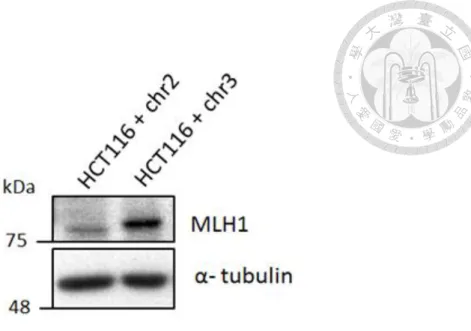
To confirm characteristics of HCT116 + chr2 and HCT116 + chr3 cell line, we use western blot to check mismatch repair related protein. HCT116 + chr2 is MLH1-deficient cell line; HCT116 + chr3 is MLH1-proficient cell line (Table2.2 )[32, 33]. The results showed that HCT + chr3 cells expressed MLH1 protein; however, HCT + chr2 cells did not express MLH1 protein.
(Figure 9)
6.2 The role of mismatch repair in E. coli pks+-induced DNA break
To determine whether mismatch repair factor is involved in E. coli pks+-induced initial DNA break, we conducted comet assay in HCT116 + chr2 and HCT116 + chr3 cell exposed to bacteria. The experiments revealed that E.
coli pks- or E. coli pks+ did not induce DNA break in two cell lines. However,
these results need to investigate more. (Figure 10A, 10B)
6.3 The role of mismatch repair in DNA repair after E. coli pks+ infection
To investigate role of mismatch repair in E. coli pks+-induced DNA break, comet assay was performed. After HCT116 + chr2 and HCT116 + chr3 cell line were infected with bacteria for 4 hours then remove bacteria, and cells were recovered with gentamicin for 20 to 44 hours. In 20 hours, high bacterial dose (MOI=100) has higher damage rate compared to low bacterial dose (MOI=40).
However, there is no significant difference between HCT116 + chr2 (MMR-) and HCT116 + chr3 (MMR+) cell line in high and low bacterial dose group. We count the tail moment, and there is no significant difference. (Figure 11A, 11B, 11C and 11D)
In 40 hours, DNA damage rate decrease in both HCT116 + chr2 and HCT116
+ chr3 cells but still no significant difference. However, we found that tail moment in VP treatment, low and high E. coli pks+ (MOI: 40, 100) have significant difference in HCT116 + chr2 and HCT116 + chr3 cells. (Figure 12A, 12B, 12C and 12D)
6.4 The role of mismatch repair in E. coli pks+-induced cell viability
Next, we want to check the potential relation of mismatch repair in cell viability, and it may participate in E. coli pks+-induced cell viability. The figures 13A showed that E. coli pks- did not inhibit cell growth in HCT116 + chr2 and HCT116 + chr3 cells. Besides, we counted the colonies and quantified the cell growth rate, and it seems that E. coli pks+ may suppress 20
% cell growth in both cell lines. (Figure 13B)
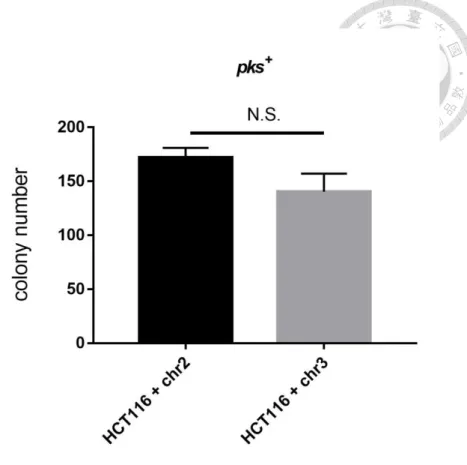
6.5 Mismatch repair involvement in E. coli pks+-induced tumorigenic activity Finally, to determine whether mismatch repair affected E. coli pks+-induced tumorigenesis, the soft agar assay was performed in the HCT116 + chr2 and HCT116 + chr3 cells exposed E. coli pks- or E. coli pks+. The colonies were formed and observed under microscope no matter in HCT116 + chr2 and HCT116 + chr3 without infection or infected with E. coli pks- or E.
coli pks+. (Figure 14A)
Combination with clonogenic assay results together, the figure 14B showed that: In HCT116 + chr2 cells, pks++ E. colli did induced more colonies in soft agar compared to E. coli pks- or control group. (Figure 14B)
On the other hand, in HCT116 + chr3 cells, E. coli pks+ did not increase colonies growth, and the colonies number has no significant difference compared with E. coli pks- or control group. (Figure 14C)
Finally, we compare HCT116 + chr2 and HCT116 + chr3 cells in each group.
In control group, colony number in soft agar is about the same in two cell lines;
in E. coli pks- group, E. coli pks- induce same colony number in two cells; in pks++ group, we found that E. coli pks+ was capable to support more colony growth in HCT116 + chr2 cells compare to HCT116 + chr3 cells. However, there is no significance after statistic analysis.
DISCUSSION
1. The prevalence of E. coli pks+ is higher in colorectal cancer patients than in
healthy individuals.
In an earlier study in 2012, Jobin and colleagues reported a clinical data, and they found that E. coli pks+ are associated with chronic intestinal inflammation and colorectal cancer and may affect carcinogenesis [7]. Based on these concepts, we collected the prevalence of E. coli pks+ researches in recent 5 years. The research showed that the prevalence of E. coli pks+ is higher 2 to 3 fold in colorectal cancer patients than in healthy person. (Table 1) Thus, we insure that the close relation between E. coli pks+ and colon cancer.
2. E. coli pks+ induced DNA break, suppressed cell growth and induced
tumorigenesis.
First, we used in vitro infection assay and performed western blot, colony formation and anchorage-independent soft agar assay. The experiments in HCT116 cells showed that E. coli pks+ induced γH2AX expression level in western blot (Figure 3). We use more colon cancer cell line, including HCT116, LoVo, SW480 and HT29, to do western blot. E. coli pks+ can also induceγH2AX expression in other colon cancer cell lines (Figure 4A, 4B). These results indicated that E. coli pks+ harbored genotoxin and causes DNA break. Next, we use these
colon cancer cell line to do further experiments. Colony formation results presented that E. coli pks+ decreased 20% colony number in HCT116, LoVo, SW480 and HT29 cell lines (Figure 5A, 7A, 13A).
In 2010 study, Oswald and colleagues reported that HCT116 exhibited tumorigenicity after infection with E. coli pks+ [27]. Hence, we repeat the soft agar assay on HCT116. HCT116 infected with E. coli pks+ increased colony number in soft agar compare to without infection after 21 days. (Figure 6A, 6B). It suggests that E. coli pks+ may have ability to induce tumorigenicity. Same experiments also conduct in LoVo, SW480 and HT29 cell lines (Figure 8A). LoVo exposed to E. coli pks+ has more colonies than exposed to E. coli pks- or no exposed (Figure 8B). Interestingly, E. coli pks+ did not increase colonies in HT29 cells (Figure 8C). Furthermore, we found that SW480 infected with E. coli pks+ has less colony number in soft agar (figure 8D). As a result, we assumed that E.
coli pks+ did have tumorigenicity but some factors or mechanism may participate
in this progression.
3. p53 may not be involved in E. coli pks+-induced growth inhibition and tumorigenesis
As mention in introduction, p53 as a tumor suppressor gene is one of most important elements of anti-cancer[34]. In our lab, we have HCT116 p53-/- cell
line so that we decided to investigate more. We would like to know whether deletion of p53 may influence E. coli pks+- suppressed cell proliferation, E. coli pks+-induced DNA break or E. coli pks+-induced tumorigenesis. The colony formation data showed that after HCT116 or HCT116 p53-/- exposed to E. coli pks+, both cell lines present 20 % decrease proliferation. Moreover, soft agar assay was conducted after HCT116 and HCT116 p53-/- cells exposed to bacteria. After growing for 3 weeks, the results represented that E. coli pks+ infected HCT116 and HCT116 p53-/- cells had tumorigenic ability compared to without infection or E. coli pks- infection. Taken together, we assume that p53 may not be involved in
E. coli pks+-suppressed cell proliferation, E. coli pks+-induced DNA break and E.
coli pks+-induced tumorigenesis.
4. Mismatch repair may participated in E. coli pks+-induced DNA break and
tumorigenesis
According previous results, we found E. coli pks+ did induce tumorigenesis in HCT116, HCT116 p53-/- and LoVo cell lines and did not induce tumorigenesis in HT29 and SW480. So we traced back to check their genetic background and we found that HCT116, HCT116 p53-/- and LoVo cells are mismatch repair deficient cell and HT29 and SW480 belong to mismatch repair proficient cells. Hence, we wanted to investigate whether mismatch repair is involved in E. coli pks+-induced
tumorigenesis. We used HCT116 + chr2 and HCT + chr3 cells as cell model.
HCT116 + chr2 cell is mismatch repair deficient which is lack of MLH1, a mismatch repair protein; HCT116 + chr3 cells contain MLH1 protein which is mismatch repair proficient. With these two cell line, we can investigate role of mismatch repair in E. coli pks+- suppressed cell proliferation, E. coli pks+-induced DNA break or E. coli pks+-induced tumorigenesis. The colony formation presented that E. coli pks+ suppressed around 20 % down cell proliferation in HCT116 + chr2 and HCT + chr3 cells (Figure 13A, 13B). As for E. coli pks+-induced DNA break, comet assay showed that E. coli pks+ induce more DNA damage in HCT116 + chr2 than in HCT116 + chr3 cells after bacterial infection for 20 and 44 hours (Figure 10, 11, 12); however, it is not significant difference.
The tail moment counting showed that E. coli pks+ induced sever tail moment in HCT116 + chr2 after 44 hours (Figure 12D). Finally, soft agar assay was performed, and it presented that HCT116 + chr2 exposed to E. coli pks+ show more colonies than HCT116 + chr3 exposed to E. coli pks+. Taken together, we hypothesized that mismatch repair may participated in E. coli pks+-induced tumorigenesis.
5. Mismatch repair and E. coli pks+-induced DSB
As we knowing, mismatch repair mechanism is for repairing single strand DNA
break; E. coli pks+induced double strand break. It is surprising that E. coli pks+- induced DNA break and tumorigenesis has correlation with mismatch repair mechanism. According our current knowledge, we still don’t know the clear mechanism. We anticipated that there are some factors may be involved in this process with mismatch repair.
TABLES AND FIGURES
Table 1: the prevalence of B2 strain E. coli and E. coli pks+ in colorectal cancer patients
The table shows that some studies which clarify the prevalence of B2 strain E. coli and E. coli pks+ in colorectal cancer. N/A: no data in the studies.
Table 2.1: Colorectal cancer cell lines that were used in this thesis
The table represents several colorectal cancer cell lines that were used. MMR:
mismatch repair ; MSI: microsatellite instability ; CIN: chromosomal instability [35]
MMR*: table2.2
Table2.2 Mismatch repair (MMR) related protein status of colorectal cancer cell lines.
Table2.3 Genetic background of colorectal cancer cell line
The table represents genetic background of several colorectal cancer cell lines that were used. wt: wild type
Figure 1. E. coli pks+ harbor pks+-island which can be detected by PCR.
First, second lane is E. coli pks-, and there is no band. Third and Fourth lane is E. coli pks+. Third land has pks+ R (1413 bp) and fourth lane has pks+ L (1824 bp).
A
B
Figure 2. Bacterial growth curve of E. coli pks- and E. coli pks+.
(A) CFU/ml versus O.D.600 of E. coli pks- (B) CFU/ml versus O.D.600 of E. coli pks+ (C) O.D.600 versus growth time of E. coli pks- (D) O.D.600 versus growth time of E. coli pks+
C
D
Figure 3. E. coli pks+ induces the expression level of γH2AX in HCT116.
The protein level ofγH2AX in HCT116 exposed to E. coli pks- and E. coli pks+ for 4 hours, MOI:100. 40 µM VP16 treatment for 4 hours is positive control.
Figure 4. E. coli pks+ induces DNA break and increases the level ofγH2AX thus activates T68 Chk2.
(A) HCT116, HCT116 p53-/- and LoVo infected with E. coli pks- and E. coli pks+ for 4 hours, MOI: 100. 40 µM VP16 treatment for 4 hours is positive control.
(B) HCT116, HCT116 p53-/- and SW480 infected with E. coli pks- and E. coli pks+ for 4 hours, MOI: 100. 40 µM VP16 treatment for 4 hours is positive control.
A
B
A
B
Figure 5. Plating efficiency of HCT116 and HCT116 p53-/- exposed to E. coli pks- or E. coli pks+
(A) Clonogenic assay (seed 500 cell/well) was performed in HCT116 and HCT116 p53-/- infected with E. coli pks- or E. coli pks+, Representative image are shown
(B) Quantitative and normalized data is shown. Control groups (without bacterial infection) were normalized to 1, and E. coli pks- or E. coli pks+ were compared to control group. Bacterial MOI: 20, N = 3
A
B
C
Figure 6. Anchorage-independent growth of HCT116 and HCT116 p53-/- exposed to E. coli pks- or E. coli pks+
(A) Anchorage-independent growth assay was performed in HCT116 and HCT116 p53-/- cells infected with E. coli pks- or E. coli pks+. The photos were taken under 40X microscope. Representative images are shown.
(B) Plot depicts the average number of colonies in HCT116 treated with bacteria
(C) Plot depicts the average number of colonies in HCT116 p53-/- treated with bacteria. N = 3. Two-tailed unpaired t-test is used for statistical analysis where *P
< 0.05.
A
B
Figure 7. Plating efficiency of LoVo, SW480 and HT29 exposed to E. coli pks- or E. coli pks+
(A) Clonogenic assay (seed 500 cell/well) was perform in HCT116 and HCT116 p53-/- infected with E. coli pks- or E. coli pks+, Representative image are shown
(B) Quantitative and normalized data is shown. Control groups (without bacterial infection) were normalized to 1, and E. coli pks- or E. coli pks+ were compared to control group. Bacterial MOI: 20, N = 3
A
B
C
D
Figure 8 Anchorage-independent growth of LoVo, SW480 and HT29 exposed to E. coli pks- or E. coli pks+
(A) Anchorage-independent growth assay was performed in LoVo, SW480 and HT29 cells infected with E. coli pks- or E. coli pks+. The photos were taken under 40X microscope. Representative images are shown.
(B) Plot depicts the average number of colonies in LoVo treated with bacteria (C) Plot depicts the average number of colonies in SW480 treated with bacteria
(D) Plot depicts the average number of colonies in HT29 treated with bacteria. N = 3.
Two-tailed unpaired t-test is used for statistical analysis where *P < 0.05. N.S.
(not significant)
Figure 9. The expression level of MLH1 in HCT116 + chr2 and HCT116 + chr3 cell line.
Western blot analysis of MLH1 in HCT116 + chr2 and HCT116 + chr3 cell line
A
B
Figure 10. E. coli pks+ did not induce chromosomal DNA break in both HCT116 + chr2 and HCT116 + chr3 cell line exposed bacteria after 4 hours.
(A) Representative image of comet assay. HCT116 + chr2 cells infected with E. coli pks- or E. coli pks+ (MOI: 40, 100) for 4 hours or cells treated with 20 µM VP16 for 1 hour then remove bacteria or drug.
(B) Representative image of comet assay. HCT116 + chr3 cells infected with E. coli pks- or E. coli pks+ (MOI: 40, 100) for 4 hours or cells treated with 20 µM VP16 for 1 hour then remove bacteria or drug. N = 1